


 Arguments


Recent Comments
Prev 760 761 762 763 764 765 766 767 768 769 770 771 772 773 774 775 Next
Comments 38351 to 38400:
-
Klapper at 00:58 AM on 14 February 2014Unprecedented trade wind strength is shifting global warming to the oceans, but for how much longer?
@Rob Painting #65:
My 30 year 0.18C/decade trend was from 1978 to 2007 inclusive. Because Pinatubo lies right in the middle of this period, it has no leverage on the trend either way. El Chichon does have an effect on this trend however, making it stronger than it would be otherwise by introducing a cold deflection at the beginning of the record.
-
Dikran Marsupial at 00:53 AM on 14 February 2014Discussing global warming: why does this have to be so hard?
just, I wouldn't worry about minor typos, the meaning was clear.
The comment about propaganda appears to me to be itself propaganda. If you have concerns about some particular article being propaganda, then do feel free to point out your concerns on the relevant article. Likewise the following paragraph seems to be a rather transparent way of saying SkS is not balanced. Here is a challenge, pick an article that you think is not balanced and make a comment explaining why and I'm sure there are plenty that would be willing to discuss it with you. If you think climate change is a young field, I suggest you get a copy of the warming papers, you will find it isn't that young at all.
Now if you want to see people arguing the world is flat, try going to some of the more popular skeptic blogs and try explaining how it is we know that the rise in CO2 is anthropogenic. Sadly, you will find that there is still lots of communication that needs to be done on issues as basic as that.
-
John Hartz at 00:50 AM on 14 February 20142014 SkS Weekly News Roundup #6
Chandra:
Be sure to check out the SkS rebuttal article, How reliable are climate models?
-
just at 00:44 AM on 14 February 2014Discussing global warming: why does this have to be so hard?
How do I edit my post?
The last lines should read;
"Give it some thought
Cheers"
-
just at 00:39 AM on 14 February 2014Discussing global warming: why does this have to be so hard?
well done guys, I must concur with Russ R that it is refreshing to see an attempt towards a more objective and rational view on the topic. should be more of it: I am convinced you will attract more 'quality' attention for the 'right' reasons.
So what kind of site do you want this to be? A site that continues to concentrate on experimenting with communication strategies/propaganda:(that by now should be clear to you) that has done more to damage your credibilty than most anything else?
Or would you like this site to be a "go to" site for credible, objective; balanced information on the state and development related to such a young and undeveloped topic as climate change?
I see very few people discussing if the earth is flat, the topic is settled enough. Most reasonable people do know very little is settled in the area of climate/climate change/finite fossil fuels and how to do what needs to be done about it.
So,.... how many more people do you truly want to inform well? Just imagine how many more people could visit this site and stay for the right reasons.
Give some thought.
Cheers
-
Jubble at 00:26 AM on 14 February 2014Discussing global warming: why does this have to be so hard?
I think it is unlikely that people can be as rational as this post. I don't think people are weighing up the risks. I think they are burying their heads, avoiding the problem, thinking of something else. They are in denial, part of the process of accepting change. Trouble is, in this case, that the world keeps moving, so denial is not passive.
-
kmalpede at 23:59 PM on 13 February 2014Discussing global warming: why does this have to be so hard?
I had a long, heated, even angry, argument with a businessman from Ghana over dinner--it's the sun, he kept on saying, and we "don't know" etc. Everyone finally got invovled. By the end of the meal, everyone, including him, was offering possible "solutions"--things we can do now, and things governments can do now, and he was agreeing, at least, that coal is a major problem. And, at the end of the dinner, everyone said they felt oddly refreshed that they had had a meaningful conversation--for a change. Of course, I live in Brooklyn, but I think my point is that people are frightened to speak and to share and if "pushed to" and I was pushing, they might end up grateful.
-
John Hartz at 23:50 PM on 13 February 20142014 SkS Weekly News Roundup #6
Chandra's request for assistance was originally posted on the comment thread of the article, "The 'pause' that isn’t" posted on the And Then There's Physics (ATTP) website. I encouraged Chandra to repost her request here which see obviously did.
Subsequent to her posting the above, a number of high quality responses to her request have been posted on the ATTP website by some very well informed individuals. You can access those by going to "The 'pause' that isn’t" on the ATTP website.
-
barry1487 at 22:55 PM on 13 February 2014Australia’s hottest year was no freak event: humans caused it
On a global scale I have been assuming that the increased atmospheric water vapour would lead to more clouds in general (and more precipitation). Is that incorrect? I did point out that effects would be different regionally, and was thinking of evaporative potential.
And "more water vapour means more cloud" is not necessarily true, either. To form cloud, you need to take moist air and cool it to the condensation point. If the air is both more moist and warmer, it may be further from the condensation point (dew point temperature) rather than closer.
How does this work in the tropics? I have spent a lot of time in very hot places like Malaysia, and the air is very warm day and night with lots of cloudiness.
There are many confounding factors. If high clouds tend to augment the greenhouse effect, and low clouds tend to feedback negatively by reflecting solar energy, then a reduction of one more than the other has different consequences for surface temperatures. A change in solar exposure largely due to fewer high clouds would have an effect inverse to what we've been assuming. I don't know to what degree solar exposure is determined by high/low cloud changes.
I guess it must be near impossible to isolate and tally attributing components to global, and especially regional temperature on annual and decadal periods. The long-term probability estimate seems to be a more robust way of estimating the impact of natural and anthroopogenic factors. But bruiser raised an interesting point on solar exposure.
-
Discussing global warming: why does this have to be so hard?
ubrew12 @ 5 and 12
The sea level rise for the last 22 years looks to be occurring in a fairly straight line: the slope in the 90s has continued since - so far (see link below). There doesn't seem to be a 10 mm upturn during the 2000s decade or since. If the Greenland and Antarctic melt is a new and growing contributor and as significant as your link in 12 indicates then it's got to show itself soon. In fact why haven't we see it already? (My comments are based on eyeballing a graph I know but it does seem to be legitimate or am I mistaken?)
-
mgardner at 21:16 PM on 13 February 2014Discussing global warming: why does this have to be so hard?
ubrew12@19
An interesting analysis, but don't geographical demographics contradict your premise? Mostly urban areas are 'liberal', and mostly rural areas are 'conservative'. Maybe it has more to do with who is exploiting the natural environment rather than appreciating it in the abstract.
Urban dwellers can romanticize about wilderness, and experience it as a sometime adventure. For those who make their living in extraction of one form or another, there is an adversarial and dependent relationship.
Since we're being all psycho-sociological, I would agree that conservatives are more concerned with the 'human environment', but in the sense of us v them, group identity, hierarchical structure, and so on. Again, look at the urban dweller, tending to be far more of an 'individual' following her own path. Isn't that one of the reasons people leave their small town environments, stop attending church, and so on?
Which leads me also to agree that "it's hard", but not necessarily for the rational reason that you suggest. We're all motivated by economic interests, but clinging to the team position is more important for some than others.
-
Dikran Marsupial at 18:45 PM on 13 February 2014Greenhouse effect has been falsified
rugbyguy59, that argument demonstrates a fundamental lack of understanding of the greenhouse effect. The Earths energy budget is determined at the top of the atmosphere by the temperature of the atmosphere at the height at which outbound IR is no longer absorbed by CO2. The lapse rate means this is much colder than the surface. As we add more CO2 the height of this layer rises, which means that the radiating layer is colder and hence radiates less energy. The Earth as a whole then gains heat until the temperature of the radiating layer warms enough for the radiated energy to be high enough for the energy budget to be balanced.
Now, as the atmosphere as a whole warms, it will radiate heat at a range of frequencies, because it is due to the heat of the atmosphere as a whole, not just the IR radiated from CO2. So of course it isn't all at the absorption bands for CO2.
Gilbert Plass worked out the details of this back in the 1950s.
-
jyyh at 18:16 PM on 13 February 2014How we know the greenhouse effect isn't saturated
atmosphere isn't full of CO2 and other greenhouse gases, thus the greenhouse effect isn't saturated.
-
scaddenp at 17:40 PM on 13 February 2014Greenhouse effect has been falsified
Sigh, it is pretty hard to take Steve "Co2 falls as snow in Antarctica" Goddard seriously. Now its conservation of energy is wrong? It pretty hard to make sense of what he is saying - I dont think he knows. However, there is excellent series taking you through the text book details at Science of Doom.
-
Klapper at 17:13 PM on 13 February 2014Unprecedented trade wind strength is shifting global warming to the oceans, but for how much longer?
@KR #60:
"As others have noted, you appear to be jumping around from thread to thread, topic to topic..."
My motives are irrelevant to whether my arguments have merit or not. The facts determine that. Read my post number 61, which ties my thinking together somewhat. The the IPO, ENSO, models, solar etc are not disconnected arguments, they are components of an overarching idea, namely that there is a climate cycle overprinting a secular warming trend, and the warm phase of that cycle has confused the tuning of feedbacks in the AOCGCMs. Not really my idea though is it?
Indirect solar effects may be a factor in driving this cycle, I don't know. What do you think it is? Roy Spencer just treats it as an oscillation, nothing more. Whatever drives it, saying it doesn't exist because you don't know the mechanism doesn't make logical sense.
-
Elmwood at 17:12 PM on 13 February 2014A methane mystery: Scientists probe unanswered questions about methane and climate change
The first well to start the hydrualic fracturing boom in the Bakken was in 2006 if I remember correctly. I believe that is basically when it started everywhere and that is about when the methane concentrations shown in post #2 start to increase. But then again, it may have nothing to do with fracing if most of the methane is biogenic rather than thermogenic in origin.
-
rugbyguy59 at 17:09 PM on 13 February 2014Greenhouse effect has been falsified
A new variant of this has appeared on Goddard's blog. A guy, recently retired and so now "free to talk" (although he still writes under a pseudonym), who claims to be an infrared astronomer is saying that IR at the CO2 wavelength can't warm the Earth.
He says "In all the bands that are responsible for back radiation in the brightness temperatures (color temperatures) related to earth’s surface temperature (between 9 microns and 13 microns for temps of 220K to 320 K) there is no absorption of radiation by CO2 at all. In all the bands between 9 and 9.5 there is mild absorption by H2O, from 9.5 to 10 microns (300 K) the atmosphere is perfectly clear except around 9.6 is a big ozone band that the warmists never mention for some reason. From 10 to 13 microns there is more absorption by H2O. Starting at 13 we get CO2 absorption but that wavelength corresponds to temperatures below even that of the south pole. Nowhere from 9 to 13 microns do we see appreciable absorption bands of CO2."
So obviously I'm not buying into the overturning of years of well tested science by some anonimous conspiracy theorist on a blog and ask those who mention it to tell me when he's publishing his paper or for a scientific reference where I can check his claims. On the other hand I wouldn't appreciate if someone could give me a more scientific understanding of why he is wrong. Always looking to learn.
-
Rob Painting at 17:07 PM on 13 February 2014Unprecedented trade wind strength is shifting global warming to the oceans, but for how much longer?
Klapper - you made this comment @61 - "The problem is that 0.18C/decade trend was boosted by the +phase of the IPO. The underlying anthropogenic signal is not that strong."
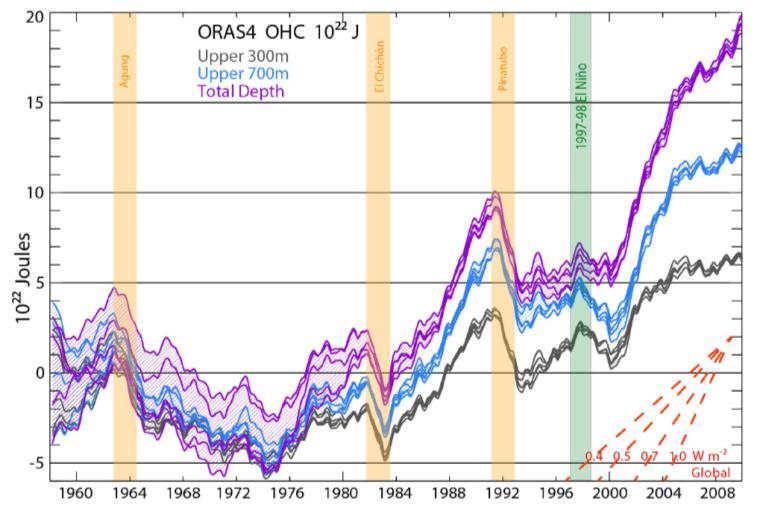
You neglected to account for the strong cooling of both the ocean and global surface from the light-blocking effects of sulfate aerosols ejected into the atmosphere by the 1991 Mt Pinatubo eruption. It goes to the heart of your claim highlighted above.
-
Klapper at 16:47 PM on 13 February 2014Unprecedented trade wind strength is shifting global warming to the oceans, but for how much longer?
@Rob Painting #63:
Pinatubo would affect my 30 year trend, but not the 10 year (2000 to 2010). Mind the 10 year trends get a bit wobbly as opposed to the 30 year. However, looking at 10 year trends which avoid the Pinatubo problem, I can see that the current rate of sea level rise from tide guages is comparable to the rate of rise from '43 to '53. The complicating factor is net runoff/meltwater input into sea level rise during the recent and mid 20th periods. Because the planet is warmer over the last 10 years than in 1950, one would expect a higher rate of sea level rise from net melt runoff. What that means is there must have been a very large heat gain post mid '40's. Unfortunately the heat content data is pretty sparse back then and even into the '50's.
-
Sea level rise is decelerating
jsmith - I believe the issue of concern is statistical significance. "Since 2004" is a very short time period, including the 2010 dip in sea level associated with La Nina, or "pot hole".
You really need to look at multi-decadal time periods to determine trends, as in Church and White 2011 who found "1900 to 2009 is 1.7 ± 0.2 mm/year and since 1961 is 1.9 ± 0.4 mm/year" and "For 1993–2009 and after correcting for glacial isostatic adjustment, the estimated rate of rise is 3.2 ± 0.4 mm/year from the satellite data and 2.8 ± 0.8 mm/year from the in situ data". They also note that "There is considerable variability in the rate of rise during the twentieth century but there has been a statistically significant acceleration since 1880 and 1900 of 0.009 ± 0.003 mm/year2 and 0.009 ± 0.004 mm/year2, respectively." (Emphasis added)
Short time periods, such as a single decade, are only going to show noise, not trends. While I don't subscribe to that particular journal and have not read the entire article, I fear that the paper is not properly evaluating the statistical significance of their results. If they can clearly support their hypotheses it will be interesting - but as it stands I see little support for such claims.
-
Rob Painting at 15:57 PM on 13 February 2014Sea level rise is decelerating
jsmith - that paper has been doing the rounds on contrarian blogs, so you probably 'stumbled' across a contrarian blog.
I haven't looked at the research paper in detail, but the general slowing of sea level rise after 2004-2005 fits in with the sharp acceleration of heat uptake into the ocean during 2000-2005, and a slower rate of heat uptake thereafter. This 'slowdown' is perhaps the most striking feature of the Hiroshima widget.
The recent trend in sea level rise is consistent with ocean heat uptake, so we shouldn't be surprised that the recent trend in sea level rise has slowed somewhat too. A similar pattern seems to have occurred during the 20th century too - short-term accelerations and decelerations against a background of long-term acceleration in sea level rise.
There are a few other factors to consider too (decadal variations in continental storage of water mass, for example), but land-ice melt is accelerating and thermal expansion is not really going to be a factor throughout 21st Century - the disintegration of the vast ice sheets of Greenland and Antarctica will be.
-
Rob Painting at 15:35 PM on 13 February 2014Unprecedented trade wind strength is shifting global warming to the oceans, but for how much longer?
Klapper - 1976-1999, the last positive phase of the IPO, was interrupted by the large tropical volcanic eruption of Mt Pinatubo in 1991. - which cooled the Earth for several years and made an enormous impact on heat uptake by the ocean. See the graph below from Balmaseda (2013). This would have to be taken into consideration.
-
DSL at 15:04 PM on 13 February 2014Sea level rise is decelerating
jsmith, take a look at why SLR might seem to be decelerating between 2004 and 2012. Between 2011 and 2013, SLR was rising at ~7mm per year. You'd do better to ask what caused that trough.
-
jsmith at 14:36 PM on 13 February 2014Sea level rise is decelerating
Hello all. I recently stumbled upon a paper which states, in the abstract, that global mean sea level "rises with the rate of 3.2 ± 0.4 mm/yr during 1993–2003 and started decelerating since 2004 to a rate of 1.8 ± 0.9 mm/yr in 2012." This seems to indicate that sea level rise is decelerating globally (not just locally as was the case with Houston and Dean's paper). The paper can be viewed here. I would like to get some feedback on whether or not this does any damage to the apparently "consensus" view that sea level rise is accelerating.
-
scaddenp at 14:10 PM on 13 February 2014A methane mystery: Scientists probe unanswered questions about methane and climate change
What the summary above misses but the linked article states is:
"since 2007, atmospheric methane has become more depleted in 13C (14), an indication that growth is dominated by 12C-richer wetland and ruminant emissions"
That kind of lets FF and methane hydrates off the hook to some extent.
-
dr2chase at 14:04 PM on 13 February 2014Unprecedented trade wind strength is shifting global warming to the oceans, but for how much longer?
How much does this extra heat dumped into the ocean affect sea level rise?
-
Klapper at 13:20 PM on 13 February 2014Unprecedented trade wind strength is shifting global warming to the oceans, but for how much longer?
@ HK #55:
"Of course a +IPO can enhance surface warming...."
I think you're starting to understand my argument. I accept there is an anthropogenic signal underlying the IPO cycle. However, the models have trouble with the IPO. They can't duplicate it so they ignore it and project that it should be warming right now at 0.20C/decade. After all, it's already warmed at over 0.18C/decade on a 30 year timescale and the CO2 level is higher then ever so it should be warming even faster than 0.18C decade, right?
The problem is that 0.18C/decade trend was boosted by the +phase of the IPO. The underlying anthropogenic signal is not that strong.
"...likely unprecedented heat uptake..."
That statement is probably not true since a rolling 30 year trend on the Church & White tide level sea level dataset shows an early peak of 2.13mm/year in the period 1933 to 1963 and 2.09 mm/year in the period 1980 to 2010. So if there was unprecedented heat uptake there should have been unprecedented sea level rise, unless you believe that the sea level rise before 1963 had higher levels of glacier melt than in the period 1980 to 2010.
Obviously those rates of sea level rise span both + and - phases of the IPO. However, if you look at shorter time spans (10 years) you will also find that current heat level gain is likely unprecedented, or not by much if it is. The sea level gain 1943 to 1953 was at 3.5mm/yr. 2000 to 2010 was 3.2 mm/yr., so there is nothing unprecedented about the last decade (Church & White ends at 2010 so I can't compare trends later than that to the '50s).
-
scaddenp at 13:11 PM on 13 February 20142014 SkS Weekly News Roundup #6
0.5 to 0.6W/m2 would be a better estimate. Forcings are recalculated to TOA for reasons outlined in I think the 2nd IPCC report. That does not mean you can make more or less direct measurements on which base that recalculation. However, with respect to TOA imbalance, he is right that the instrumentation cannot give a direct absolute measurement. However, the Argo network provides another way to do estimate it. Conservation of Energy dictates that you cannot have OHC increasing without an energy imbalance, and furthermore it gives a good way to estimate the imbalance in absolute terms.
-
Unprecedented trade wind strength is shifting global warming to the oceans, but for how much longer?
Klapper - The IPO is generally considered to be strongly driven by (among other things) teleconnections to the long term ENSO variations, as per Newman et al 2003.
Given a strong influence such as that, the IPO may wll be an add-on effect to the ENSO variations. And since over the long term ENSO variations cancel out, reddened ENSO teleconnections will too. Remember that correlation is not causation - variations in the IPO may very well be longer term lagged ENSO effects, rather than causes of atmospheric temperature variation in and of themselves.
As others have noted, you appear to be jumping around from thread to thread, topic to topic, in search of support for pre-existing convictions - rather than following the physical evidence to see where it leads. Once a particular unsupported assertion is shown not to hold (it's the sun!, the models are bad!, ENSO, now IPO) you jump to something else that might give your views support. The term for this behavior is confirmation bias.
I would recommend applying some of your skepticism to your own views, rather than making additional unsupported assertions.
-
Bob Loblaw at 12:40 PM on 13 February 2014Australia’s hottest year was no freak event: humans caused it
Something nopbody has mentioned is that solar radiation reaching the surface is only one factor in how much energy is available to heat the overlying air (which is where air temperature comes from).
Nobody has mentioned the role of soil moisture, which plays a critical role in the division between thermal transfer to the atmosphere and evaporation (latent heat) transfer to the atmosphere. Dry soil means less evaporation means more thermal transfer means hotter air.
An less evaporation combined with warmer air often means less cloud, which lets more solar radiation through to the surface. HIgher solar radiation could be the result of the hot, dry conditions, not the cause of it.
And "more water vapour means more cloud" is not necessarily true, either. To form cloud, you need to take moist air and cool it to the condensation point. If the air is both more moist and warmer, it may be further from the condensation point (dew point temperature) rather than closer.
-
Klapper at 12:39 PM on 13 February 2014Unprecedented trade wind strength is shifting global warming to the oceans, but for how much longer?
@ scaddenp #54:
If by "internal variability" you mean some random process, I disagree. The IPO cycle doesn't look random. And if it is not random, then what drives it?
-
Unprecedented trade wind strength is shifting global warming to the oceans, but for how much longer?
Bob Loblaw - Tamino's model is even simpler than that. The two boxes are representative of the atmosphere and the oceans, not different levels of the oceans. What he's doing is a (relatively) simple statistical correlation of forcings and temperature with a 6-month lagged ENSO index (lag from the lowest residual result as per Foster and Rahmstorf 2011) as part of the multiple regression.
The fit of even this simple energy balance correlation is quite remarkable.

-
Bob Loblaw at 12:26 PM on 13 February 2014Unprecedented trade wind strength is shifting global warming to the oceans, but for how much longer?
Papy:
The 2-box model that Tamino uses has no "horizontal" in it, and very limited "vertical", so it can't include much in teh way of a physical process. When he incorporates an El Nino/La NIna process via the Souther Oscillation Index (SOI - a pressure indicator), all he is saying is that he can adjust heat transfer between his two ocean boxes (stacked vertically) according to the SOI. Including this adjustment in the model improves the fit, so that he had conclude that something (not sure what) about SOI/El Nino/La Nina cycles provides statistical explanation of the global surface temperature variation. It's a statistical correlation, not a physical explanation.
In contrast, the new study examines the physical process in much greater detail. It includes measurements of actual wind (not just a pressure index), reanalysis data (based on GCMs), and consideration of the physical processes. This is a much stronger methodology/confirmation than the statistical correlation at Tamino's.
-
Bob Loblaw at 12:13 PM on 13 February 2014Unprecedented trade wind strength is shifting global warming to the oceans, but for how much longer?
mgardner and ianw01:
Thanks for the feedback. Perhaps it could be said that "all explanations are wrong, but some explanations are useful".
I do indeed manage to muddy the waters a bit by switching back and forth between force and shear stress, which have different units. SkS does not allow one to edit posts - perhaps a good thing as everything that is said is there for posterity. Shear stress is a concept that is difficult to put into simple words. I won't even try to go into strain.
..but to clarify mgardner's comment about the friction not depending on area - yes, as is easily demonstrated (if your brick isn't a cube) by turning the brick onto the smaller side (less area in contact with the ground) and seeing that friction (as measured by the pull on the rope) has not changed. The shear stress between the brick and the surface has changed, though. If the area is now half, then the shear stress has doubled - but with only half the area, the (shear stress X area) is constant... (to first order, as Ianw01 says).
Another place where shear stress shows up is on hill slopes. Stability depends on how large the shear stress induced by gravity is compared to the shear strength of the soil. As soon as the stress exceeds strength, the soil "breaks" and failure occurs.
We now return to our regularly-scheduled program.
-
barry1487 at 12:05 PM on 13 February 2014Australia’s hottest year was no freak event: humans caused it
bruiser,
reference to "1990 - 2013" is not my comment.I'm not sure you read my post clearly. I didn't "go back 80 years." All the records were pre-1909, and half of them were from the late 1880s. The reason a handful of them are little more than 80 years long is because the record truncates in the 1980 or 90s. I took your reference to pre-1900s and early 1900s as the basis for the selction.
The majority of sites are rural. For many of them I checked the siting of the weather station.
In the records I saw 1888 or 89 were often warm, occasionally warmest, but for the most part the average decadal warmth of that period was less than in the last decade or two of the record selected, whether the period stretched to recent temps or the 1980s/90s.
The topic we were discussing was the influence on solar exposure on the 2013 record. Your argument seems to have shifted to a general proposition that Australia is no warmer than it was more than a century ago. Your argument is based on very spotty data with obvious problems (and you have cited precisely one weather station), vague assertions about UHI (which the Australian record attempts to correct for), and absolutely no number-crunching or even casual testing of your opinion as I did. As the global record is quite robust on warming from 1880, with all large-region (continental-scale) records showing significantly warmer temps now than then, your assertions are not at all convincing. (Not enough data for the Antarctic, but it shows warming from the 1950s, corroborated by analysis from 'skeptics')
I provided a list for you of Australian weather stations with long records. Amongst them is a usable subset that roughly covers the periods you have nominated. The station numbers are provided, which you can type into a box at the BOM page you linked me to, and immediately bring up the annual min/max temperture series, each of which BOM will chart for you with a click. Why don't you select all that fit the period, cherry-picking none, and see for yourself? It's no more than two hours' work. Confirming the locations for those stations takes ony a little bit of googling. There is a site that briefly describes the locations, and plots them on google maps for you. Frequently the description I read was in the vein of "the station is located 650 metres from an unnamed sealed road."
If you take the trouble to investigate for yourself, I will repeat what I did the other day, this time noting down the weather station numbers and providing them to you so that you can cross-check that I selected appropriately.
To reemphasise a point, our excursion has little to do with the analysis given in the main article, which would be unaffected by pre-1910 data. If you're not sure why, I recommend reading it carefully.
-
Riduna at 11:51 AM on 13 February 2014Discussing global warming: why does this have to be so hard?
Dr Abraham presents a very conservative view. Admittedly there are many areas where our knowledge is less than perfect but surely we know enough to know that we are already, to use a technical term, in dire shtuck.
Seems to me there is little, if anything, we can now do to retrieve the situation.
-
Chandra at 11:46 AM on 13 February 20142014 SkS Weekly News Roundup #6
Hi, apologies for a long question, but I would appreciate an opinion on a discussion I have had with a skeptic. I have understood there to be an energy imbalance and have seen it quantified as being about 1.7W/m2 currently and expected to rise. The skeptic, who appears to be a retired but experienced engineer, electronics perhaps, questions this. Here are some of his observations to me:
1. The properties of CO2 in absorbing and radiating IR over certain wavelengths has been precisely measured and is not open to dispute.
2. There is no doubt that a planet with an atmosphere of pure CO2 would be warmer than the same planet with an atmosphere of a gas that did not interact with IR.
3. From there on things are not “well understood” in the way that expression is normally used in science. The radiation imbalance does not come from measurement or observation of any actual imbalance. It comes from calculations based on notions including “radiative forcing” which can exist only in computer models and which is inherently incapable of being validated by observation or by experiment. ([Science of Doom] is not very complimentary about radiative forcing, though mainly because of its approximations.)
Its very, very hard for me to express how utterly ludicrous or irresponsible the idea of relying on unverified models would be regarded in any of the fields I have worked in. The fact that its widely done in climate science means that the subject just cannot be taken seriously. Its got the word science in its title but, whatever it is, it is simply not science. If learned people believe things about a physical system for which there is no physical evidence – and nothing that comes out of a model is evidence – then their learning has to be regarded as a form of theology. Its faith, not science.
And he goes on later, quoting from Science of Doom / IPCC:
“The radiative forcing of the surface-troposphere system due to the perturbation in or the introduction of an agent (say, a change in greenhouse gas concentrations) is the change in net (down minus up) irradiance (solar plus long-wave; in Wm-2) at the tropopause AFTER allowing for stratospheric temperatures to readjust to radiative equilibrium, but with surface and tropo-spheric temperatures and state held fixed at the unperturbed values”. (IPCC)
In other words, a concept that has no physical existence, that can exist only within computer models and which is incapable of being validated (and, equally, of being falsified). This give a lucid illustration of how climate science is not science, despite having the word in its title and wearing some of the clothes of science. If a concept cant be verified by experiment, it makes no difference how many learned people believe in it, it remains unverified.
A good principle when things are uncertain is to look for the simplest explanation that requires the fewest assumptions.
Instead of looking in the deep ocean, under the carpet, or elsewhere, to find what has happened to “the missing heat” that radiative forcing says should be there, climate scientists might well take a hint from Nature. With their models unvalidated, they cannot rule out that Nature is whispering: “Im sorry but the static temperature of the past fifteen years is simply because there is actually no imbalance between incoming and outgoing energy flows. The missing heat is nothing but a phantom conjured up by the approximations and errors in your models.”
I don’t have the necessary smarts to judge adequately what he says, but his mentioning of static temperatures for 15 years at the end indicates to me that he is not as “skeptical” as he would like to suggest. Can someone help untangle this web for me please?
-
ubrew12 at 10:41 AM on 13 February 2014Discussing global warming: why does this have to be so hard?
Abraham asks "why does this have to be so hard?" I'm going to hazard a guess, take it as you wish. Loosely translated, the 2nd law of thermodynamics applied to a system (such as, a human) surrounded by much larger Environments, says "Your Environments are bigger than you". So it says you tend toward your Environments rather than the other way around. But what is the Environment? For Liberals, its Nature, for Conservatives, its humanity (i.e. the socioeconomic construction humanity has wrung from within Nature). For us as humans, it's probably a bit of both. Regarding the Conservative interpretation the phrase that applies is "there's the right way, the wrong way, and the Army way". That means: you may have a strong opinion about Right and Wrong, but the way that is going to apply is the Army way. You cannot ignore your socioeconomic Environment, even if it is poised to destroy Nature and with Nature, itself. That's why its so hard. The people you are asking to listen to the Natural Environment are fundamentally oriented to listen to their more immediate Socioeconomic Environment. To them, you are a 'tree hugger': you hug the tree rather than the stock market. It's your choice, but as we showed recently, the FED will make up whatever money it needs to support the stock market. Of course this matters: trees have no such recourse. The reason this is so hard, is that you're trying to convince people that the real environment still matters, is still powerful, and has the ability, as in days of old, to make your life miserable if ignored for long. But they are increasingly trained to think that's not true, that humanity exists outside of Nature, and is the exception to it. The reason this is so hard is that, in the short term, they are right. Of course, in the long term, even Nature balances her books.
-
Unprecedented trade wind strength is shifting global warming to the oceans, but for how much longer?
Klapper 51:
Of course a +IPO can enhance surface warming just as –IPO can enhance surface cooling as more heat is released from or stored in the oceans, but there are very good reasons to believe that its impact on the long-term climate is close to zero compared to anthropogenic greenhouse gases.
Look at the bottom frame in figure 1 in the blog post.
The IPO was negative until 1920, positive until 1945, negative until 1978 and then positive until 2000, in other words a typical oscillation around an average value without a clear trend.
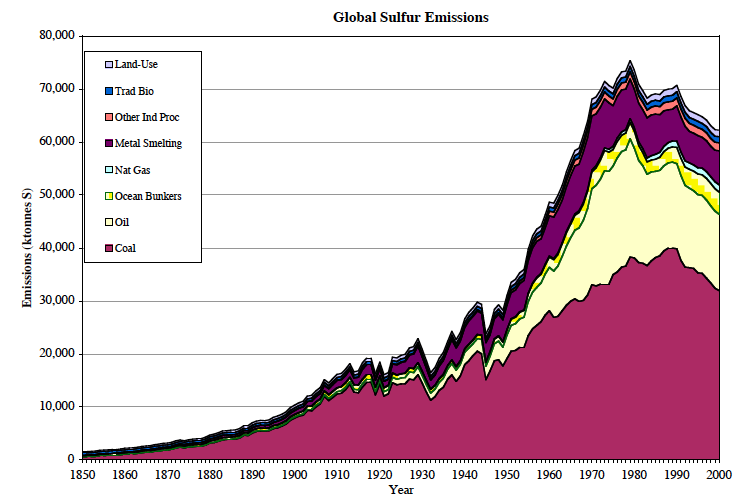
The temperature in the top frame shows a very clear trend over the same period, so whatever caused that, the IPO cannot have been a factor when we consider the entire period from about 1910 to 2000.If IPO was as important as you seem to think it is, the negative IPO should have had a cooling effect between 1945 and 1978. In that period, the global sulphur emissions tripled, from about 25 to 75 million tonnes, so the negative IPO got a lot of “help” from global dimming.
Why was the temperature more or less flat despite two large negative impacts? Maybe because one of them wasn’t as large as you seem to think?The next period (1978-2000), with a positive IPO and a very clear warming trend, coincides with a continued growth of the greenhouse gas forcing and a moderate reduction of the sulphur emissions (global brightening). It’s worth noting that the oceans continued to accumulate a lot of heat, so the main driver of the surface warming must have been an external forcing even if the positive IPO gave a small contribution.
Regarding the period after 2000, I find it interesting and revealing that it takes “unprecedented” trade winds and likely unprecedented heat uptake in the oceans to slow down the surface warming, even with some help from a weak sun and (possibly) Chinese aerosols. And maybe the surface warming hasn’t slowed down that much after all.
Greenhouse gases are still the most important factor controlling the Earths climate!
-
scaddenp at 09:56 AM on 13 February 2014Unprecedented trade wind strength is shifting global warming to the oceans, but for how much longer?
Klapper, "could the +IPO have enhanced the warming between 1975 and 2000?"
Firstly, the IPO is an index rather than process and would appear to be a metric recording the superposition of a number of oceanic processes. If you restate the question, "could internal variability enhanced the post 1975 warming, (esp 1992 to 2006)" then yes, as noted it in Rahmsdorf 2007.
-
scaddenp at 09:24 AM on 13 February 20142014 SkS News Bulletin #1: Keystone XL Pipeline
I doubt that you would find much argument amoungst climate scientists for the desirability of a pigovian tax on carbon (the "Hansen tax"). Except that it is more expensive to administer than simple ban on new FF infrastructure.
There have been a no. of studies on cost of mitigation versus cost of adaption. (eg the Stern report). If the study considers impacts in line with the IPCC WG2 report, then mitigation is economically desirable. Further discussion on this could perhaps take place here.
-
gws at 09:24 AM on 13 February 2014A methane mystery: Scientists probe unanswered questions about methane and climate change
-
Russ R. at 08:52 AM on 13 February 20142014 SkS News Bulletin #1: Keystone XL Pipeline
chriskoz,
I'm quite familiar with the tragedy of the commons (from a few years of economics study at both the undergraduate and graduate levels), but I don't believe your analysis of solutions is complete.
You listed:
- some form of governmental regulations,
- individuals can cooperate to conserve the resource in the name of mutual benefit
- conversion of common good into private property, giving the new owner an incentive to enforce its sustainability.
First of all, you omitted a perfectly valid solution:
4. Do nothing (if the costs of correcting the externality exceeds the costs of the suboptimal outcome).
But I'll leave that one aside for now.
Second, after excluding solutions 2 and 3, you picked up solution 1, "some form of governmental regulations" and jumped straight to "banning the further proliferation of FF infrastructure" without considering that there may be other forms of "governmental regulations" that are less drastic (and impose fewer externalities of their own).
For example, a Pigouvian tax.
As above, to avoid argument over the appropriate figure for the social cost of carbon (SCC) let's just use the $36/tC figure adpoted recently by the White House. Insert a different value if you prefer.
We've already established above that the differential CO2 emissions between the tar sands oil coming through the pipeline and conventional light crude available in the US Gulf Coast is 0.121 tCO2/bbl (559.6 kgCO2/bbl vs. 438.6 kgCO2/bbl). That works out ot 0.033 tC/bbl. Applying a tax of $36/tC results in a charge of $1.19 per bbl to the outflow from the pipeline to correct the "externality" of using tar sands oil instead of conventional oil.
Problem solved.
-
scaddenp at 08:32 AM on 13 February 2014Unprecedented trade wind strength is shifting global warming to the oceans, but for how much longer?
Klapper I have responded on aa index in a more appropriate thread, here.
-
scaddenp at 08:30 AM on 13 February 2014It's the sun
Over here Klapper postulated a link to climate from AA index.
Klapper, lets see if I have understood this:
You are postulating a climate effect from geomagnetic activity (or other) for which the AA index is a proxy. Furthermore, you are implying that variation in this phenomena is more effective climatically than variations in radiative energy from the sun (ie TSI, measured directly from satellites since 1979). As a corollary, you are also postulating an undiscovered negative feedback or process that stops the extra longwave irradiation due to enhanced greenhouse effect from warming the earth.
Your lag proposal postulates a process where the response can increase after the driving force has decreased.
Frankly, call me skeptical. What is missing from your arguments is evidence for plausable physical processes. Rather it seems further evidence that you have uninformed a priori position on AGW and looking for supporting arguments while ignoring the overwhelming support for a better model.
-
chriskoz at 07:47 AM on 13 February 2014A methane mystery: Scientists probe unanswered questions about methane and climate change
In the figure by Andy@2, the biggest surge of emmisions happened at N mid-lattitude around 2002-2003. That was immediately followed by the biggest drop in the following year at the same location (is it really the same 'locality' in the raw data or just happens to be in the same band but somewhere else, e.g. NAmer vs. Europe/Asia?). These are the two biggest anomalies on this figure. Has anyone looked at explaining this? Do we have a 'smoking gun' here (but do not understand the processes involved yet) or is it just random noise from naturaql variabilities?
-
Papy at 07:45 AM on 13 February 2014Unprecedented trade wind strength is shifting global warming to the oceans, but for how much longer?
Last year, Tamino estimated the influence of ENSO with a 2-box model, NASA forcings and SOI data for ENSO.
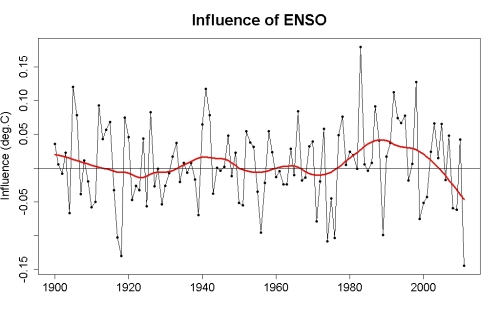
Could someone explain me what's the difference with this tremendous new study ?
-
gws at 07:32 AM on 13 February 2014A methane mystery: Scientists probe unanswered questions about methane and climate change
thanks, witsend @10 for pointing out that paper. However, the study was about live, standing trees, not dead/decaying trees. Its sample size was very small, the variability (range) near 100% in most cases, and its extrapolation (from the mean) rather bold. If real, there is no reason to believe the source (~20 Tg/yr, thus relatively small) would not have existed before 2007/08, thus cannot explain the current rise.
-
ubrew12 at 06:44 AM on 13 February 2014Discussing global warming: why does this have to be so hard?
In the '2014 SkS Weekly News Roundup #6' there was an article 'How to convince your friends to believe in climate change' that seemed fairly helpful. Shortly, avoid trotting out Scientific facts or Scientific consensus. Come from your heart, state that the issue is important to you. Then offer 4 reasons why you 'came around': 1)taking action is like taking insurance, 2)taking action will involve nuclear power, 3)since illness hits people where they live, talk about how tropical illnesses are expected to spread if we do nothing, 4)mention that the US Department of Defense considers AGW to be a top threat. If I get the psychology right, you aren't talking to people who care about Nature, and have probably already pegged you for a 'Tree Hugger'. These people are prudent and buy insurance policies to cover most things, they like nuclear power because they know it irritates the 'greenies', like most people they feel illness in their bones, and they are apt to salute whenever you mention the Military. Good Luck!
-
scaddenp at 06:23 AM on 13 February 2014Discussing global warming: why does this have to be so hard?
What Russ R is pointing to for "unintended consequences" to my mind is actually the certainity of pursuing policies favoured by business lobby groups which nearly always turn out badly - namely using subsidies. That these will have unintended consequences is a near certainity not an uncertainity. I accept the need for government subsidies on health and education but in every other arena, they tend to be a disaster. "Dry" governments of both left and right here (NZ) in the 90s ended subsidies right across the economy - a good move. 73% renewable generation and no subsidy in sight. First step is kill subsidies on fossil fuel, second step is ban new generation using FF and let the market decide the next best source. The obvious foreseeable consequence is that you will pay more your energy. However, you are going to pay more future energy one way or the other - if not directly, then through your insurance bill if not worse.
Prev 760 761 762 763 764 765 766 767 768 769 770 771 772 773 774 775 Next


