


 Arguments


Recent Comments
Prev 779 780 781 782 783 784 785 786 787 788 789 790 791 792 793 794 Next
Comments 39301 to 39350:
-
Esop at 10:18 AM on 15 January 20142014 SkS Weekly Digest #2
chriskoz (#2): The clueless anti-science piece by this Mr. Switzer that you link to is obvious damage control. The Australian based denier fraction is completely besides themselves with desperation right now and will do anything to deflect the publics attention from the extreme heat in Australia at the moment.
I just watched CNN from the Australian Open and players are passing out from the extreme heat, so a very visible PR nightmare for the deniers, as the AUS Open is broadcast around the world.
It is going to be a very interesting year, and likely a very difficult one for the flat earth crowd, so they will turn up the rhetoric and noise to 11.
-
Tom Curtis at 08:59 AM on 15 January 20142014 SkS Weekly News Roundup #2
Poster @7, Tom Switzer's article begins with the claim that the Australasian Antarctic ("Spirit of Mawson") Expedition (AAE) "... was promoted as the voyage to study the melting of ice sheets in the South Pole". That is, at best a 1/10th truth, and a massive misdirection. The Antarctic Ice Sheet is indeed melting, but the AAE did not go to Antarctica to study that melt, and nor was the Akademik Shokalskiy trapped by a sudden freeze of the Antarctic Ice Sheet.
The actual scientific reasons for the expedition are explained at the AAE website, an explanation mentions ice sheet melt just twice; and which details the specific scientific reasons for going to Antarctica:
"We are going south to:
- gain new insights into the circulation of the Southern Ocean and its impact on the global carbon cycle
- explore changes in ocean circulation caused by the growth of extensive fast ice and its impact on life in Commonwealth Bay
- use the subantarctic islands as thermometers of climatic change by using trees, peats and lakes to explore the past
- investigate the impact of changing climate on the ecology of the subantarctic islands
- discover the environmental influence on seabird populations across the Southern Ocean and in Commonwealth Bay
- understand changes in seal populations and their feeding patterns in the Southern Ocean and Commonwealth Bay
- produce the first underwater surveys of life in the subantarctic islands and Commonwealth Bay
- determine the extent to which human activity and pollution has directly impacted on this remote region of Antarctica
- provide baseline data to improve the next generation of atmospheric, oceanic and ice sheet models to improve predictions for the future"
(My emphasis)
The most interesting item (in this context) is (2). The Akademik Shokalskiy was trapped by windblown fast ice (ie, sea ice) and the AAE went to Antarctica to study (among other things) "...the growth of extensive fast ice...". Unfortunately for deniers, a tail about scientists going to Antarcitica to study growth of extensive fast ice and then being trapped by that extensive fast ice due to a short term wind change doesn't have the right level or irony. Consequently they simply made up reasons for the expedition not significantly related to the objectives of the expedition, and imply the ship was trapped by a sudden freeze (it was not), and in Switzer's case, imply it was trapped by a sudden extension of the ice sheet itself. That is, because the truth does not suit their propaganda needs, they deal in fantasies.
Almost the entire rest of the article discusses political facts. That is worth noting. Switzer's evidence against global warming consists almost entirely of evidence that people are ignoring the harm from global warming. Even his narrow purported case that he is not denying the warming but only the harm from the warming is not helped by that. Indeed, it is made worse in that he cites no studies or evidence of the likely impacts of global warming at all. Apparently in Switzer's opinion, global warming is likely to be harmless because all of the right people do not believe it to be harmfull, regardless of scientific evidence to the contrary.
I distinguish between his purported case and his actual case because his sole "scientific argument" is "Meanwhile, 2013 marked the 15th year of flat-lined global surface temperatures, despite record levels of carbon dioxide being pumped into the atmosphere since 1998." Flat lined? In fact the 15 year trend to the end of 2013 is 0.093 +/- 0.14 per C/decade, greater than the 0.084 +/-0.009 C/decade trend since January 1901. Further, adding that fifteen years increases the trend, ie, the trend from Jan 1901 to Dec 2013 is greater than the 0.071+/- 0.01 C/decade trend from Jan 1901-Dec 1998. Even with his obvious cherry pick, saying the temperature trends "flat-lined" is another case of spreading fantasies because the facts are not suitable to the propaganda purposes of the author.
The article is a disgrace to journalism. It shows in full that theory of journalism that anything labeled as "opinion" is publishable, if it comes from the right people, even if it is fact free, or completely counter factual. It represents, further, an example of that political theory that holds democracy in such high regard they think the way to advance their political cause is to con the people. To pervert Lincoln's famous dictum to say that "You can't fool all of the people all of the time, but you can fool enough of them enough of the time to suite your ends."
Given the debasement of journalistic and democratic ethics evident in Switzer's article, it is no surprise that his background is with the American Enterprise Institute; as opinion editor of The Australian, as an advisor to former Liberal Party leader, Brendan Nelson, and as an unsuccessful candidate for preselection for the Liberal Party.
-
Mike3267 at 08:19 AM on 15 January 2014The Weekly Standard's Lindzen puff piece exemplifies the conservative media's climate failures
A suggestion: Write an Op-Ed givng examples of convervatives and conservative media getting it right on climate change and energy policies. Start here: conservamerica.org/
-
scaddenp at 08:13 AM on 15 January 20142014 SkS Weekly News Roundup #2
Actually quoting the Lowry Institute report.
" For the first time since 2006, the steady decline in the number of Australians supporting strong action on climate change has reversed, with 40% (up 4 points) now saying global warming is a ‘serious and pressing problem. We should begin taking steps now even if this involves significant costs’. Opposition to the carbon-pricing legislation has fallen 5 points to 58%."
Not exactly the spin in the SMH is it?
-
scaddenp at 08:08 AM on 15 January 20142014 SkS Weekly News Roundup #2
poster, perhaps this discussion would be more focussed if could be more specific about which points from the Switzer article are actually right? That the cryosphere is increasing (implied) or that public doesnt get it? Others? A survey of public opinion is only a measure of how well the science is being communicated to the public, something seriously hindered by rhetoric from someone living in a reality-distortion field like this author.
-
chriskoz at 07:57 AM on 15 January 20142014 SkS Weekly News Roundup #2
Poster@7,
Tom Switzer's article is almost entirely distortion of reality (e.g. famous "global warming stopped" theme and confusion of weather event vs. climate) and baseless politically loaded rhetoric, as I indicated on Weekly Digest #2 thread.
It would be interesting to check the source of that Lowy Institute survey that allegedly showed the drop of acceptance of AGW in AUS from 70 to 40% to find out if his rhetoric is based on at least one undistorted fact.
-
Kevin C at 07:26 AM on 15 January 2014Global warming and energy – intertwined problems in Africa
Fungelstrumpet: Fair comment. Actually, all I hear in the media about Africa is conflict related, so a regular reminder of what's going on climate-wise is important.
-
william5331 at 05:18 AM on 15 January 2014Global warming and energy – intertwined problems in Africa
After living in Africa for 15 years, I can assure you that erratic weather with extreme floods and extended droughts are the norm. It may be true that the weather is getting more erratic but I would like to see records from weather stations before drawing any conclusions. The people of Africa are no more or less likely to misremember than we in the West are. We all like to think that the time we are in is something special and out of the ordinary.
-
rockytom at 05:03 AM on 15 January 2014Global warming and energy – intertwined problems in Africa
John, Excellent posting. I'm somewhat puzzeled by your last sentence though. Please enlighten me on "In this regard, the climate-energy problem is often thought of as a double-edged sword – solutions to the climate problem make access to low-cost electricity more difficult." It seems to me that at least some solutions to the climate problem will make access to cheap and clean energy at low cost more readily available to people in need. Implementation with great care is essential. It's mainly in the grid. We have the technology for wind and solar and other sources of clean energy, but not the grid. Or did I miss something in your post?
-
cjnankervis at 04:10 AM on 15 January 2014Global warming is being caused by humans, not the sun, and is highly sensitive to CO2, new research shows
My thesis showed that thin tropical cirrus covers a large portion of the globe and small increases in the high cloud fraction can have a large impact on the Earth's longwave radiation budget. Tropical anvil outflow cirrus extends several hundred kilometres with a relatively large mean "observed" longwave cloud radiative forcing from co-located CERES (Aqua) measurements of 33 +/- 20Wm**-2. This is inspite of a considerably drier upper atmospheric conditions and lower ice crystal concentrations (both around 4 fold lower) than deep convective plumes with a longwave cloud radiative forcing of 52 +/- 28Wm**-2.
The radiative impact of thin cirrus in the tropics is not to be undermined. Its microphysics and global impact is profound, yet it is poorly monitored and apparently insensitive to moisture and lower tropospheric conditions.This work is summarised in Chapter 6 of my PhD thesis - with visualised case studies of atmospheric conditions in the presence of tropical clouds in the Pacific and Indonesian regions in Chapter 5.
https://www.era.lib.ed.ac.uk/handle/1842/7755
Moderator Response:[PS] Fixed link
-
Mohamed Aboshady at 02:31 AM on 15 January 2014The Big Picture (2010 version)
Interesting !
-
LarryM at 02:13 AM on 15 January 2014Mitigation Mosaic: How small steps can make a difference
BaerbelW - Thank you for this description of practical steps that any community can take to reduce their fossil fuel use through energy efficiency and renewable energy, and begin to address climate change. Given the paralysis at the Federal level here in the U.S., mixed progress at the State level, and the insufficiency of relying on individual actions, it seems that the most productive way forward is from leadership at the community level.
My town of Lafayette, Colorado, USA is well behind Fellbach but is now on the verge of doing something similar, namely allocating significant resources from the town budget toward reducing greenhouse gas emissions by residents, businesses, and government through investments in EE and RE. A handful of passionate citizens who want to get something done began pressing for such an action last year, and it has been a lot of work (including passing a "citizen initiative" at the ballot in November), but now it looks very promising that Lafayette will soon be starting on the path that Fellbach has taken. One lesson is that individuals really can make a difference, which brings to mind this quote:
Never doubt that a small group of thoughtful, committed citizens can change the world; indeed, it's the only thing that ever has.
- Margaret MeadOne commonality with Fellbach is that we propose offering free energy consultations so that any resident or business can learn what EE measures they can take and how much it will save them on their energy bills, at no risk or cost to them, in order to get the ball rolling on actions. Mostly, though, it's not about give-aways, it's about education. We're promoting the following principles of successful programs aimed at high participation rates: 1) massive public outreach and education from many angles, sustained over time, about available programs and how people will benefit from them; 2) make it super-easy for people to participate once they understand the benefits; and 3) provide financing so that there is no or low upfront cost and payments come from energy savings (for example, establishing a low-interest revolving fund operated by the City, possibly with on-bill repayment).
We are confident that City Council will soon pass a Clean Energy Ordinance that establishes an Energy Sustainability Fund aimed at reducing greenhouse gas emissions and saving people a lot of money by not purchasing unnecessary energy. We're describing this idea in terms of a "City Service", not unlike other social benefits that the City invests in, like the Library and parks and the Rec Center. As the Fellbach article states, this community-level approach to energy sustainability is both scalable and adaptable, and Lafayette's on-going experience shows that it can all begin with just one or a handful of committed citizens who want to get something done on climate change.
-
funglestrumpet at 01:44 AM on 15 January 2014Global warming and energy – intertwined problems in Africa
Kevin C @1
I don't know how old this post is, but it has not been in my inbox for very long, and certainly no longer than many of its companions so your assumption that all who comment herein are not interested in Africa is a bit premature. And just for the record, dead wrong in my case at least.
-
MA Rodger at 00:57 AM on 15 January 2014Global warming is being caused by humans, not the sun, and is highly sensitive to CO2, new research shows
Micawber @24.
I hate to pour cold water on you evident enthusiasm but do you think it is not premature to accept the work of Matthews & Matthews so readily? The paper you link to begins by stating "This is the second of two papers on..." but where is that first paper?
If I look for Matthews, J. B. and Matthews, J. B. R: (2013) 'Physics of the upper ocean', Physics Today, under review, I see no sign of it having been published by Physics Review. And with that first paper absent, the content of the second, that paper you link, that to smacks of being very much prelimenary work. Indeed, Matthew & Matthew 2014 say themselves "Our work needs confirmation by..." and I would humbly suggest the method of than confirmation may not best be achieved with the methods they describe.
-
cjnankervis at 00:29 AM on 15 January 2014New Study Suggests Future Global Warming at the Higher End of Estimates: 4°C Possible by 2100
The effect describes sounds like a climate system that is not in equilibrium i.e. the land surface and atmospheric temperatures warming through greenhouse gases at a faster rate than the sea surface temperatures can equilibrate to. In a steady state climate, either during brief periods of global temperature slow-down or upon curbing carbon dioxide, methane, CFCs and other greenhouse gases the sensitivity from this cloud effect may reverse.
It seems to me that the system described is a climate state where the specific water vapour concentration in the atmosphere is inefficiently distributed into the atmosphere - indicating also that there is a longer than anticipated lag-time for atmospheric moistening and also delayed upper tropospheric moistening. As water vapour is a greenhouse gas, this may reach a critial point in time limit at which the rate of warming is buckled before rising sporadically in a staged approach. Pushing the Earth's hydrological cycle into an imbalance can only cause more weather extremes and enhance internal climate variability further. -
chriskoz at 23:25 PM on 14 January 20142014 SkS Weekly Digest #2
Anyone can knows and the background of a fellow named Tom Switzer. He just wrote an opinion piece on smh, which reads like Marc Morano:
Game finally up for carboncrats (warning before you read: everything in this link is a lie and baselesss rhetoric; read some reader comments to learn that people, thankfully, are generally not deceived by this nonsense)
Interesting that smh, which boasts as "Independent, Always", allowed their space to such buffon as Switzer. In the name of "balance" in this "debate"? Sounds pathetic. Perhaps Mr Switzer represents some special interest that distorts his worldview so badly. That's the reasonI'm asking about his background. And sadly, we have another denier to debunk (unless shm withdraws this piece and appologises to the readers, which seams unlikely).
-
Micawber at 22:04 PM on 14 January 2014Global warming is being caused by humans, not the sun, and is highly sensitive to CO2, new research shows
The discussions here continue to focus on the relatively trivial 7% of AGW in the atmosphere.
A paper showing the top 2m of ocean controls the 93% AGW in the oceans was published 3 January. It suggests heat is transported in the oceans from the tropics polewards to basal melt Arctic ice.
It is based on century-long daily timeseries at Isle of Man that has both tropical and sub Arctic waters with seasonal variations. Earlier work measured evaporation in the tropics. It showed evaporation was temperature and salinity dependent. Buoyant water floats on an ocean heated from above. It is not convective like a kettle on a hob.
Sea surface temperatures taken for atmospheric purposes, needs to be 3000 times more accurate than air temperatures because of the higher heat capacity of water. In any case, salinity in the upper 2m has hardly ever been measured. Large temperature gradients in the top 3m were reported from the tropics
Three phases of warming are shown in the 20th century; warming, slight cooling and post 1986 rapid warming. The authors suggest it is greater than 1C in twenty years. They relate this to three phases of icemelt. First multi-year deep ice keels and tidewater glaciers to about 1939. Then a mid-century slight cooling while ice islands and multiyear ice melted. Finally the present period of annual ice melt.
They showed a mid-century hot cold cycle 1959/1963 coincided with the peak of the 400-year sunspot cycle. It only became apparent for the brief period when solar radiation was two standard deviations larger than long-term means.
Thus, the mid-century cooling was due to maximum icemelt. The declining annual ice suggests that the buffering of AGW has been largely removed. The authors suggest this could lead to more basal icemelt in tidewater glaciers of the Canadian Archipelago and Greenland. Moreover, the north Pacific water is trapped by equatorial divergence and the 50m Bering Strait. This leads to more intense tropical storms and strengthened sub-polar jet streams. Details of the Pacific evaporation and circulation are not yet online. However, they show eleven interconnected counter-rotating divergent/convergent Lagrangian wind-driven surface gyres transport surface water. Buoyant surface water forms a global nutrient circulation system.
These papers suggest that we need to study the upper 2m of oceans to understand the 93% of AGW. Far too much emphasis has been put into land-air based purely on models and unverified statistics. This is likely to give deniers a great weapon.
The Economist has already highlighted the issue: “A simple idea underpins science: ‘trust, but verify’. Results should always be subject to challenge from experiment”, “Modern scientists are doing too much trusting and not enough verifying-to the detriment of the whole of science and of humanity” (Economist, 19 Oct. 2013 p11)
It is far too easy to sit in front of a computer screen and run models or blog on Skeptical Science. We need to ignore all projections and hypotheses until they have been tested by extensive field observations. The paper shows how the unverified SST assumptions missed ocean climate shifts. The mid-twentieth century problem has been discussed extensively on this website. These papers suggest a physical basis from data taken to oceanographic standards. No models were used though the authors have published research on this area.
The authors suggest the problem stemmed from confusing correlation with causation. Correlation coefficient would be better named the coincidence index. It is not a relation like the Navier Stokes equations or the Clasius Clapeyron relation with a physical basis. Coincidence is not causality. All this is in the paper cited.
Given the huge heat capacity of the oceans and verified physics it would be worth switching attention to the upper ocean to understand AGW. Online access is:
Citation: Matthews, J. B. and Matthews, J. B. R.: Possible signals of poleward surface ocean heat transport, of Arctic basal ice melt, and of the twentieth century solar maximum in the 1904–2012 Isle of Man daily timeseries, Ocean Sci. Discuss., 11, 47-122, doi:10.5194/osd-11-47-2014, 2014.
Printer Friendly Version:Moderator Response:[PS] Fixed link
-
barry1487 at 21:15 PM on 14 January 20142014 SkS Weekly News Roundup #2
Synapsid, I didn't look at the date. Thanks for the heads up.
-
Kevin C at 20:35 PM on 14 January 2014Global warming and energy – intertwined problems in Africa
If I'm reading the comments on this article correctly...
...then no-one is interested in Africa.
But 'Every single thing every one of us does affects everyone affects everybody, all over the world. It's one global ecosystem'.
Moderator Response:[PW] Eliminated unnecessary white space.
-
Poster9662 at 20:28 PM on 14 January 20142014 SkS Weekly News Roundup #2
Looking at posts 3-5 it is perhaps both relevant and appropriate to note that in today's SMH, hardly a bastion of the deniers, there is a piece by Tom Switzer that is quite severe on those considering anthropogenic global warming/climate change is the greatest moral challenge of our time. Pehaps, amongst many cogent comments, this one is worthy of note: "Last year's Lowy Institute survey said that only 40 per cent (down from nearly 70 per cent in 2006) think climate change is serious and requires action". The article can be found at http://tinyurl.com/lcaxa7o It certainly provides plenty to digeat and I wonder how it will impact on those who read it. In essence though, is Tom Switzer right or isn't he?
Moderator Response:[PS] Fixed link
-
denisaf at 20:24 PM on 14 January 20142014 SkS Weekly News Roundup #2
The comment about Australia's coal production conveys the false impression that Australia can make a significant contibution to tackling climate change. The stark reality is that irreversible rapid climate change has been initiated by past fossil fuel emissions around the globe with Australia making a trivial contribution. A marked reduction in the global rate of emissions can do no more than slow down global warming slightly.
-
mercpl at 18:53 PM on 14 January 2014The Weekly Standard's Lindzen puff piece exemplifies the conservative media's climate failures
@adrian smits,
I'm late to this argument, but I have to agree with you that the climate models are wrong. But that's because all models are wrong. I have a model sitting in front of me, its a model of the earth about 30 cms in diameter that spins on an axis tilted at 23 and a half degrees and its wrong! Everybody knows that the real Earth is about 13,000 klm in diameter and weighs about 5.97219 exp24 kg
But it's useful for teaching kids geography.
That's the point, all models are wrong somehow, but a good model is useful.
-
CollinMaessen at 15:40 PM on 14 January 20142014 SkS Weekly Digest #2
Clin? Really? ;)
Moderator Response:[JH] My apologies for taking so long to correct the typo.
-
wili at 14:49 PM on 14 January 20142014 SkS Weekly News Roundup #2
Australia's heatwave is spreading and deepening again.
http://www.bom.gov.au/announcements/media_releases/ho/20140113.shtml
This may be a test case for the theory that it takes a major, clearly-GW-related disaster to wake a nation up to the need to stop UNsequestering and burning fossil-death-fuels.
Australia's hottest-ever year is looking like it will be followed up by more of the same over the next 12-18 months, at least. Yet it has just become the number two coal producer in the world.
-
TonyW at 13:48 PM on 14 January 2014The Weekly Standard's Lindzen puff piece exemplifies the conservative media's climate failures
Dana, I note you say that there has been 0.8C temperature increase since the start of the last century. Isn't this understating it? The AR5 summary has 0.85C warming since 1880 (to 2012), though the draft AR5 full science document has 0.89C between 1901 and 2012. With the Cowtan and Way work, 0.89 might be closest to the truth. Many people seem to have used the 0.8C figure for a few years but if it's now almost at 0.9, shouldn't that be highlighted whenever possible? Hansen says above 1C is almost certainly dangerous and we are almost there, with what it built in already definitely destined to take us past 1C. -
scaddenp at 12:02 PM on 14 January 2014Climate's changed before
You also cite "some current rump climatology research". This is a curious term. Could you perhaps give some cites for this "rump" research?
-
scaddenp at 11:25 AM on 14 January 2014Climate's changed before
Actually for a good look at current understanding of carbon cycle and its evolution, look at Chp6 (esp 6.4) in the just released IPCC AR5.
-
scaddenp at 11:17 AM on 14 January 2014Climate's changed before
" The current working assumption, in most climatology models, is that the Earth reabsorbs around 50% of the Co2 emitted and that the remainder is added to the heap, as it were, thus causing an ever increasing ppmv."
This is an extremely simplistic and short term view of carbon cycle modelling, and only true for very short term (around 100 years). Both modelling and paleoclimate studies point to significant positive carbon cycle feedbacks as sinks are saturated. You might like to look at:
Le Quere, C., C. Rodenbeck, E.T. Buitenhuis, T.J. Conway, R. Langenfelds, A. Gomez, C. Labuschagne, M. Ramonet, T. Nakazawa, N. Metzl, N. Gillett, and M. Heimann, Saturation of the Southern Ocean CO2 sink due to recent climate change, Science, 316 (5832), 1735-1738, 2007.
Schuster, U., and A.J. Watson, A variable and decreasing sink for atmospheric CO2 in the North Atlantic, J. Geophysical Res., 2007.
Ultimately, as the oceans warm, they outgas CO2.
-
Real Skepticism About the New Marcott 'Hockey Stick'
Tom Curtis - As I understand your argument, you feel that the first randomization of the proxies, that of errors in actual age, is added to the filtering performed by the Marcot et al analysis. A reasonable point (if I am interpreting it correctly), which would argue that the impact of a 'unicorn spike' would be smoothed twice by those date/temperature errors - the sampling, time jittering, and temperature uncertainties reducing such a spike prior to the Marcott processing.
Let's test it, with the math. Here is the result of a spike Fourier filtered with the Marcott et al gain function both once and twice:
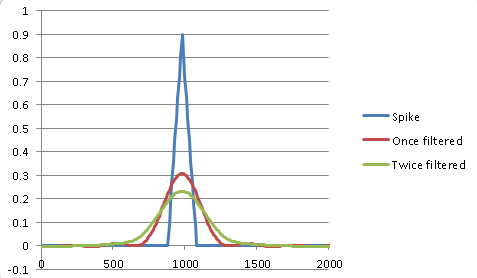
Once and twice Marcott filtered spike
The original spike has a height of 0.9C, with a full-width half max (FWHM) of 100 years. That spike filtered by the Marcott et al analysis has a height of 0.3C, with a FWHM of 280 years. Filtering twice, however, the effect of randomizing time and temperature uncertainties both on acquisition and on Monte Carlo, results in a remaining peak of height 0.23C, with a FWHM of 360 years - significantly less change. Once the highest frequencies have been reduced, repeating the filtering with the Marcott gain function has less of an effect on the remainder. This is a 0.23C peak in the mean line, not in individual realizations, mind you, and no such spike appears in the Marcott data.
I feel that we do indeed have sufficient information from Marcott to show that such 'unicorns' with very high certainty do not exist. This is why I like to do the math, run the numbers, to see if intuition matches the data.
[Note: I find your statement "I consider his insistence on seeing the math as bluster" both insulting and nonsense. I gave what I consider a clear explanation of my calculations and the results. From the discussion those are quite clearly non-intuitive; hence my insistence on math rather than intuition to test said results. "Bluster" and incredulity are the province of spoken/written language, not of computation.]
Moderator Response:[PS] This is as interesting discussion and is likely to stay that way if all participants can please focus on understanding each others arguments, dealing with the substantive, and especially by avoiding provocative language. Please.
[DB] Fixed broken image and link.
-
Synapsid at 09:48 AM on 14 January 20142014 SkS Weekly News Roundup #2
Barry @ 3,
Those reports are a year old. As of four weeks ago there have been no commercial discovery, no identified reserves and no "unidentified resources." I haven't seen any investor interest yet, but I haven't looked much.
There are no new technologies employed in spite of what the article says. What spurs this exploration is a global-benchmark oil price of $100 a barrel over a couple of years, not technological improvements. Horizontal drilling accompanied by fracking has one big demand that can't be met at Coober Pedy: great volumes of water. That's desert country out there.
South Australia has faced water constraints for a good long time, and they're getting tighter what with drought from blazing summers. I'd be surprised to see much happen with the Arckaringa anytime soon.
-
wpsokeland at 04:02 AM on 14 January 2014CO2 Currently Rising Faster Than The PETM Extinction Event
The great Carbon influx into the atmosphere at the PTEM has been resolved. The eruption of the Northern Atlantic and High Arctic flood basalts at the time caused the largest insertion of greenhouse gases in earth's atmosphere in the last 290 million years. wpsokeland@yahoo.com
Moderator Response:[PS] An email address is not a substitute for a reference to a published paper. Such a paper would be interesting but at first glance, such an explanation fails to explain the observed carbon isotope signature.
-
ron ogle at 03:09 AM on 14 January 2014Climate's changed before
Is anything in this link useful information? Thanks. http://www.timelinetothefuture.com/index.php/en/prepare/possible-earth-events/sun-a-heat
Moderator Response:[TD] No, not a single thing. Really. For each of the arguments that page makes, you can find the actual scientific evidence summarized in a Skeptical Science post. EIther use the Search field at the top left of any Skeptical Science page, or click the View All Arguments link next to the thermometer below that, or click the Arguments link in the blue horizontal bar at the top of any Skeptical Science page. Note that most posts have different levels of detail in different tabbed panes--Basic, Intermediate, and Advanced. Here are just a few examples: "It's the Sun," "It's Cosmic Rays," "We're Heading Into an Ice Age," "We're Coming Out of the Little Ice Age." (Okay, Skeptical Science does not have rebuttals for all the contentions made in that page; we don't have a rebuttal to the contention that the Earth will stop rotating and then start rotating in the opposite direction. Here's an answer to that one: That would happen only if a planet-sized body smashed into the Earth, offset from the center, and in the direction opposite the Earth's spin. But if that happens, I'm perfectly willing to stop worrying about CO2 levels. Because I'll be dead. Along with everything else.)
-
Tom Curtis at 23:23 PM on 13 January 2014Real Skepticism About the New Marcott 'Hockey Stick'
Michael Sweet @95, it is likely that the realization with that single spike I drew attention to lies near the mean either shortly before or after the spike, giving it an amplitude of 0.7 C, large enough to be a candidate "unicorn spike". Potentially it is even larger. Of course, we do not know that that is the case. But nor do we know that the realization in question had values above the mean for several centuries before or after the visible spike.
With respect to your MWP analogy, here are two of the Marcott proxies and their mean over the period 7950-8990 BP:

Clearly both show temperature fluctuations significantly greater than 1 C over periods of a centurly or less. GISP2 likewise shows very large short term temperature fluctuations, although it was not used by Marcot.
However, your assumption of the existence of proxies which show excursions higher than the actual signal is not warranted. Most of Marcott et al's proxies have a low resolution. So much so that the mean resolution of all 73 proxies is 160 years, despite the existence of several annually resolved proxies. Marcott et al made the reconstruction by taking the existing values of the proxies, and linearly interpolating them into 20 year bins. Such linearly interpolated will not show the full spike. Using the mean resolution, even if by chance (1 in 10) one data point happens to coincide with the peak of a "unicorn spike", the proxy will show a peak of the same magnitude, but with a 320 year period rather than a 200 year period. Most proxies will show much smaller peaks, with half showing peak magnitudes 50% or less of the "unicorn spike" magnitude. This graph gives an idea of the effect:
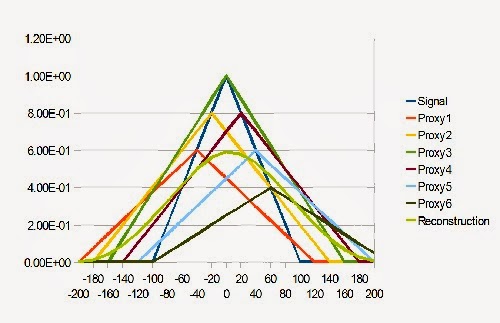
Note, I have used a small number of proxies, all but one of which show 50% or greater magnitude the "unicorn spike". Consequently the "reconstruction" shows a much greater magnitude (less smoothing) then a full array of 73 proxies would show. Further the initial random temporal displacement due to dating error, plus the temporal displacement from the monte carlo reconstruction will further reduce the magnitude of the reconstruction.
The important point here, however, is that the areas of above average temperatures during a "unicorn spike" need not coincide with regions that provided high resolution proxies; so a "unicorn spike" can exist and have no proxies showing temperatures greater than the peak temperature of the spike.
Finally, I do not claim that high local spikes in fact exist. I suspect, in fact, that they do not. What I claim is that nobody has shown we have sufficient information from Marcott et al to show they do not exist. Given that Marcott et al certainly do not claim they have shown they do not exist, and caution against claiming that they do not exist; anybody wanting to claim otherwise requires a very rigorous proof. Both Tamino and KR have neglected an essential aspect of that proof (using their respective methods), which is a shame because in other respects their approaches are both interesting and informative.
-
michael sweet at 21:06 PM on 13 January 2014Real Skepticism About the New Marcott 'Hockey Stick'
Tom,
The single realization you point to is smaller than the 0.9C spike you suggest so it does not seem to me to be an appropriate example.
When we look at the MWP it is easy to find single proxy records that show an increase in temperature much greater than the average across the globe. If your hyothesized spike in temperature existed, there should be many individual proxies that are higher i.e. 1-2C higher for 200 years. Can any such proxies be found? How can the hypothesis that a global spike of 0.9C might have happened when no local spikes have been identified be supported? Almost by defination, if there was a global spike, local spikes must have been higher.
I see your claim as that high local spikes exist and have been poorly dated so that they cancel out. Can you provide examples of these local spikes ( I have not seen examples in the past)? If the local spikes do not exist, it is a moot point wether they were properly dated. If they exist we can look at the individual data to see how reliable the dating is for those proxies.
-
barry1487 at 20:54 PM on 13 January 20142013 was Australia's Hottest Year, Warm for Much of the World
DMarshall, I'm guessing the BOM use the same baseline period as HadCRUt due to their collaboration over the years. HadCRUt reason for using this baseline is here.
-
barry1487 at 20:06 PM on 13 January 20142014 SkS Weekly News Roundup #2
Great news for the Australian economy, bad news for environmentalism.
$20 trillion shale oil find surrounding Coober Pedy 'can fuel Australia'
Brisbane company Linc Energy yesterday released two reports, based on drilling and seismic exploration, estimating the amount of oil in the as yet untapped Arckaringa Basin surrounding Coober Pedy ranging from 3.5 billion to 233 billion barrels of oil.
At the higher end, this would be "several times bigger than all of the oil in Australia", Linc managing director Peter Bond said.
-
Dikran Marsupial at 19:36 PM on 13 January 201416 ^ more years of global warming
Earthling, by talking of the "faithfull" you give the impression of being a troll, here only to provoke an intemperate response, without being interested in the scientific response to the point you have raised. If that is not your intention, I suggest that you avoid such inflamatory terms in future posts. If it it your intention, I suggest you find another blog where such behaviour is appreciated.
The point of controlling for the effects of volcanic eruptions, solar activity and ENSO is to undestand what has cause changes in GMST in the past, not to be able to predict it in the future. The point is to discover what part of the observed changes cannot be explained by volcanic eruptions, solar activity and ENSO.
We know that there will be short term warming and cooling influences in the future, but if they do not have a long term secular trend, they will not be the cause of a long term trend in GMSTs, which is what climatologists are primarily interested in.
-
pheidius at 16:48 PM on 13 January 2014Climate's changed before
Hi,
Sorry about the delay but, yes, the papers are available. I would have included them at the onset but I was confused by the insert and source tabs. The Mclean paper is available on this page http://filebox.vt.edu/artsci/geology/mclean/Dinosaur_Volcano_Extinction/pages/studentv.html as a pdf on a link called McLean (1994)The second paper I referenced is here
I have mulled over the discrepancy because its magnitude is glaring. The pertinent facts, as I see them, are that while both camps seem to agree that a ppmv of 2000-2300 marked the bitter (acidic) end of the line at the KT boundary E.G. dead oceans, they clearly disagree on the ppmv preceding the heat sink's 10, 000 year collapse. Mclean's numbers would indicate a millennium long sharply punctuated yet steady uptick where the second author(s) see a steady 350-500 ppmv for the Ma and only then see a massive jump in the final 10,000 years.
I think I see a possible way to explain this difference. In doing further research, I am seeing some current rump climatology research, which undermines a critical assumption that Mclean may have used. The current working assumption, in most climatology models, is that the Earth reabsorbs around 50% of the Co2 emitted and that the remainder is added to the heap, as it were, thus causing an ever increasing ppmv. This may be a key assumption that Mclean did not question and used in the exposition of his model. The other authors used a more direct measurement of ppmv for the Ma(the size of leaf stomata). This would support the rump research, which postulates that the Earth’s sinks absorbs Co2 regardless of the amount emitted, keeping the ppmv in the 300-500 ranges.
I am trying to ground my take on this on the older and longer data sets. In comparing the two sides, one used an assumption to approximate ppmv for the Ma in question while the other used a form of indirect measurement that has wide acceptance in the field of geology. This brings me back to the salient question with which I began. The Ma preceding the KT boundary extinction event saw 10-25 % higher co2 levels annually yet the ppmv fluctuated between 350-500. I understand the risks involved in a 90 percent annual increase yet I am struck by the fact that the second set of author(s) paper required the instantaneous release of 4600 Gt on top of 1,000,000 years of a 25 % increase before the sinks failed catastrophically over a period of 10, 000 additional years. In terms of percentages, the 90 Gt number which you described, as a 90 % increase over baseline constitutes only a .019 % annual increase relative to the near instantaneous increase wrought by 4600 gt.(not to mention the other colossal atmospheric effects of a bolide collision).
I am, by no means, taking a hard and fast position here. I do see another unquestioned assumption as well as other implied and, as of yet, unexamined data sets and models in the position taken by the second paper for the need for an additional 4600 Gt to precipitate disaster. I will have to reread this paper carefully and look closely for the source(s) of this modeling.
-
Tom Curtis at 11:14 AM on 13 January 2014Real Skepticism About the New Marcott 'Hockey Stick'
Michael Sweet @91, here are Marcott's reconstruction plus all thousand "realizations" created by perturbing the proxies:

If you look at about 5.8 kyr BP, you will see a purple spike that rises about 0.2 C above the mass of realizations, and about 0.7 C above the mean. It is certainly possible that this is a "unicorn spike" similar to, of slightly smaller in magnitude to those of which KR speaks. It is impossible to tell for sure, as once the realization falls back into the mass, it is impossible to track. All that spike, and similar spikes above and below the mass, show is that very rapid changes in global temperature are possible given the Marcott data. It does not show the potential magnitude of such changes, nor their potential duration, other than that the magnitude cannot be greater than about 1.2 C (the width of the mass of realizations).
One thing the individual spikes do not show is that their is a reasonable probability of such spikes above the mass. Given that there are 1000 realizations, over circa 10,000 years of relatively stable temperatures, those few visible spikes are significantly less than 5% of occurences. Whether or not there are high magnitude spikes, we can be reasonably certain global temperatures over the last 12 thousand years are constrained within the mass of realizations except on the shortest of time scales.
The one thing that is required to close the argument is an analysis of all 100 year trends within all one thousand realizations to determine what percentage have a 100 year trend close to 0.1 C per decade. I in fact requested the data on his realizations from Marcott at the original time of those discussions, but he replied that he was too busy at the time, and I have not renewed the request.
Finally, with regard to KR's response to you @92, clearly we disagree about what is at issue (100 year trends, vs unicorn spikes). I also disagree with his characterization of my position. I am not arguing that such high 100 year trends are possible, given Marcott; but only that it has not yet been shown that they are not possible given Marcott. Finally, I consider his insistence on seeing the math as bluster. My argument is that he has not shown me the relevant math to support his position. The relevance of the maths he has shown can be shown without bringing in more maths.
-
Tom Curtis at 10:27 AM on 13 January 2014Real Skepticism About the New Marcott 'Hockey Stick'
KR @90, I believe that you have misinterpreted the quoted passage. Following the passage through in detail, we see that:
1) They generate 73 identical pseudo proxies;
2) Each proxy is perturbed 100 times to generate 100 pseudo-proxy stacks;
3) The power spectra of the stacks is examined, and compared to the power spectra of the white noise proxies to determine the resolution of the technique.
Now, by your interpretation, the generation of the 100 pseudo-proxies for each proxy perturbation of the signal by error in the proxies. In that case, however, there is no additional step corresponding to the monte carlo method using 1000 pseudo-proxy stacks generated by perturbing the actual proxies. On that interpretation, it follows that Marcott et al never got around to testing the resolution of their procedure.
Alternatively, the 100 perturbations are the analog of the perturbations of the proxies in the full Marcott proceedure. On that interpretation, however, the test of resolution starts with 73 identical proxies. That differs from the real life situation where regional proxies will vary due to regional differences (the result of which being that limited proxy numbers can enhance variability in the record); and in which proxies records contain noise, both with regard to dating and signal strength, both of which tend to smooth the record.
That is, either my criticism is valid (on my interpretation of the quote), or the test does not even test the effect of Marcott's proceedure on resolution (on yours).
While discussing your method, I will further note that the original issue was whether or not, consistent with Marcott's reconstruction, there could have been periods of 100 years or more with global temperature trends equivalent to those over the twentieth century (0.1 C per decade). There is no basis to assume that such trends would be part of a single spike. They could have been part of a rise to a plateau, or a short sine pulse (ie, a spike followed by a trough of similar magnitude and duration). Therefore your test, although based on Marcott's estimate of resolution, does not properly test the original hypothesis, but only a subset of instances of that hypothesis.
I have more to add in direct response to Michael Sweet, but that response may be delayed untill this afternoon (about 5 hours).
-
Real Skepticism About the New Marcott 'Hockey Stick'
michael sweet - As the Marcott et al authors themselves stated, their Monte Carlo method, including perturbation of proxy dating and temperature value, will blur high frequency (fast) changes. With a cut-off around 300 years, a signal that varied at <300 years won't come through at all.
However, a single unphysical 0.9Cx200yr 'unicorn' spike such as hypothesized by skeptics is a complex signal, from the 0.9x100yr addition to the average, to the very fast changes at the inflection points of the spike - and much of the <300yr signal survives the Marcott processing leaving a diminished but noticeable 600yr peak. Tom Curtis and I disagree on the possibility of Marcott style processing being able to detect such a short spike - but the frequency space math I've run, as well as Tamino's Monte Carlo tests, indicate that it shows clearly. A point that I will insist upon until I see math indicating otherwise.
-
michael sweet at 09:52 AM on 13 January 2014Real Skepticism About the New Marcott 'Hockey Stick'
Tom
It seems to me that your proposal is that there might be a short, 0.9C spike in the indiviudal records but they cancel out because of dating errors. Can you provide two proxies that show such a spike? If none of the individual proxies show such a spike, it follows that the sum of the proxies cannot have an undetected spike in it.
-
Hockey sticks to huge methane burps: Five papers that shaped climate science in 2013
Tom Curtis - I strongly disagree, and have responded in detail on the appropriate thread.
-
Real Skepticism About the New Marcott 'Hockey Stick'
Tom Curtis - "...neither Tamino nor your tests allow for the innate smoothing implicit in any reconstruction from the fact that the measured age of each proxy will differ from the actual age of the proxy by some random amount"
I would wholly disagree, as they tested that effect as well. From the Marcott et al supplemental:
We modeled each of the 73 proxy records as an identical annually-resolved white noise time series spanning the Holocene (i.e., the true signal), and then subsampled each synthetic record at 120-year resolution (the median of the proxy records) and perturbed it according to the temperature and age model uncertainties of the proxy record it represents in 100 Monte Carlo simulations. (emphasis added)
As they stated, their 'white-noise' test explicitly includes the random uncertainties in proxy age you are concerned with. As per the prior discussion on this thread, I feel that their frequency response fully characterizes the effects of their analysis, and that correspondingly a 200-year duration 0.9C spike would be reduced and blurred by a factor of roughly three - leaving a signal that would be clearly visible in the Marcott reconstruction. Tamino found results consistent with mine by performing the Monte Carlo analysis himself, which again indicates that a 'spike' of that nature would be visible in the Marcott analysis - evidence that such a spike did not in fact occur.
For such a signal to be missed, for the frequency response to have far less of a high frequency response, would require that Marcott et al significantly underestimated proxy age uncertainties - that they mischaracterized their proxies. I believe the burden of proof for such a claim would rest with the claimant.
As to my characterization of such spikes, I consider them fantastical unicorns because there has been _no_ postulation of _any_ physically plausible mechanism for such a short-lived global temperature excursion. It is my personal opinion that at least some of the emphasis on 'spikes' (such as the many many posts on the subject at WUWT, ClimateAudit, and the like) has been for the purpose of rhetorically downplaying the Marcott et al paper and its evidence of the unusual nature of current climate change, an extended claim of it's not us. I would take the entire matter far more seriously if there was _any_ physical possibility involved.
-
scaddenp at 08:12 AM on 13 January 2014Newcomers, Start Here
The accusation probably tells you more about the mind-set of the accuser than climate scientists. Presumably they would happily do biased research for the money.
There are several erroneous assumptions involved. 1/ some think that grant money goes to the scientist - a gravy train for them - whereas reality is that funding usually goes to employer and they draw their salary. 2/ The commonest assumption is the belief than funding is tied to AGW. A look at, say, NSF grants would show funding goes to find out things that arent already known and funder doesnt care which way the results fall. 3/ It is also often thought that if AGW was shown to be false/irrelevant, then all these people would lose jobs. In practise, scientists move the next interesting problem.
You might ask, if climate science is biased, why FF companies spend money on misinformation rather than using their considerable research infrastructure to show alternative results. Answer would be that their own scientists would tell them its more effective to use PR because on the whole they find the science of AGW convincing. (I work in petroleum research).
-
Mal Adapted at 07:46 AM on 13 January 2014Newcomers, Start Here
ZincKidd, I've wished for a more effective counter to the "funding bias" arguments of the deniers myself. Pithy retorts along the lines of "If scientists were in it for the gold, they'd be working for the fossil fuel corporations" only carry so much weight. Try this SkS discussion from a while back for some ideas.
A response from a scientist who depends on grant money is Scott Mandia's "Taking the Money for Grant(ed)".
More recently, there have been some damning studies of where deniers get their funding. It might help convince your "friend" that the accusations of funding bias are coming from people who are paid to make them.You should keep in mind that it takes money to make money. The people who stand to lose the most if fossil fuel use is curtailed are willing to pay top dollar for skillful propaganda, to convince the public that AGW is all a hoax. Scientists, however, are ethically (and financially) constrained from adopting that strategy. It's kind of a lop-sided struggle.
-
DSL at 07:33 AM on 13 January 2014Newcomers, Start Here
ZincKidd, your friend has a basic misunderstanding about climate science. This is probably due to not having read any of it. Have him show you work that undermines the basic physics involved.
Still, it's one of the silliest arguments there is. The basic claim is that scientists are fudging studies in order to toe the line. In other words, climate science is a hoax. Since the basic theory is well over 100 years old, that means that at least five generations of scientists working in climate-related areas are part of the hoax. It also means that decades' worth of graduate students in atmospheric science and physics are also part of the hoax. And all the editors of all the journals. All of these people have been publishing fictions. That takes talent. Think about it. A working scientist must get together with his team and design a study that undetectably perpetuates the fiction. Since climate science is progressive and interdisciplinary, it's like a giant house of cards. Every study published is a potential weak link in the house.
Yet no one has been able to locate the hoax. Upwards of a million people involved (all living and dying with the secret), and no one has ever figured out the fictional element of physics upon which the entire house is based.
Heck, even the Earth is involved in the hoax. Arctic sea ice volume at summer minimum is at roughly 20-25% of its 1979 minimum. Have your friend do the math to figure out how many joules it has taken to manage that. I guess all of the polar scientists and engineers (and Inuit!) could be in on the hoax as well.
That's what your friend wants you to believe. That's what he thinks is reality. Weigh the probability of that reality against the probability that, in fact, the science is actually describing physical reality. Show me where the lie is. That's what I'd ask. It's one thing to claim that scientists are motivated to lie for money; it's another thing to actually show evidence of a lie. Invite your friend to SkS to present his case. If there's solid evidence, I'll change my mind.
I've often found that that type of "skepticism" comes from people who haven't actually sat down and read a published paper or talked one-on-one with a scientist. They're more than happy to make broad claims about "libtard scientists" as long as they're never forced to humanize those scientists by looking them in the eye.
-
grindupBaker at 07:19 AM on 13 January 20142014 SkS Weekly News Roundup #2
Climate scientist Arctic & Antarctic specialist Dr. Dan Lubin has a lecture on video on the web "Global Warming and the Polar Regions: Signs of Human Impact" at University of California Television discussing the Polar Night Jet and some changes of last few decades. I forget whether it has close relevance to this "Polar Vortex" but likely yes.
-
martin3818 at 04:24 AM on 13 January 2014New Study Suggests Future Global Warming at the Higher End of Estimates: 4°C Possible by 2100
@12 Tom Curtis
Thanks Tom for your explanation. I’m certainly less confused now, although I will probably still have to draw what you said as I’m more visually oriented.
-
citizenschallenge at 01:55 AM on 13 January 2014Richard Alley's Air Force Ostrich
Excuse the dog piling but it's January 2014
Justin has had plenty of time to think about and list his "cogent arguments."
But, he has posted nothing.
I would suggest that indicates that after some serious thought he realized he had no argument and rather than admitting to it, he silently exits the discussion. Typical of the behavior of your committed climate science denialist type.
Prev 779 780 781 782 783 784 785 786 787 788 789 790 791 792 793 794 Next


