


 Arguments


Deciphering the rise and fall of Antarctic sea ice extent
Posted on 6 July 2021 by Guest Author
This is a re-post from Carbon Brief by Dr Clare Eayrs and Prof David Holland
The sharp decline in Arctic sea ice over recent decades has become one of the most enduring images of the Earth’s warming climate. Yet, at the same time, the sea ice changes at the Earth’s south pole have been much less clear-cut.
Antarctic sea ice extent increased gradually over much of the satellite record (1979 to present), reaching successive record highs in 2012-14. Yet, 2016 saw the beginning of the most pronounced fall in sea ice cover ever observed. Over the three years that followed, the precipitous drop in Antarctic sea ice was equivalent to 30 years of sea ice loss in the Arctic.
These fluctuations led the Intergovernmental Panel on Climate Change (IPCC) to conclude in its 2019 special report on the ocean and cryosphere that Antarctic sea ice extent “overall has had no statistically significant trend” due to “contrasting regional signals and large interannual variability”.
Our perspective paper, published in Nature Geoscience, draws on recent research to examine what the recent dramatic loss in Antarctic sea ice cover reveals about the processes that control sea ice in the region.
We find that the swift and unexpected sea ice decline was mostly caused by an exceptional weakening of the westerly winds that encircle the continent of Antarctica.
While the sea ice seems to be bouncing back, coverage is still well below the 2014 record high. Sea ice cover in this region is clearly vulnerable to rapid change. However, if we are to project future change accurately, we need to pinpoint the processes both near and far that influence the winds around Antarctica.
Sea ice variability
The annual fluctuation in Antarctic sea ice is one of the largest seasonal changes in surface cover on the planet. It has huge knock-on effects for the global climate and marine ecosystems.
In winter, Antarctica effectively doubles in size as 15m square kilometres (km2) of the ocean freezes. While the Arctic is hemmed in by continents that limit seasonal sea ice growth, the Antarctic is surrounded by mile-after-mile of water where sea ice can form.
However, because sea ice in Antarctica spreads to lower, warmer latitudes, less will then survive in the summer as temperatures rise. On average, only around 15% of Antarctic sea ice lasts from one year to the next, unlike around 40% for the Arctic. You can see this in the maps below, which show Antarctic sea ice extent at the 2020 winter maximum (left) and the 2021 summer minimum (right).
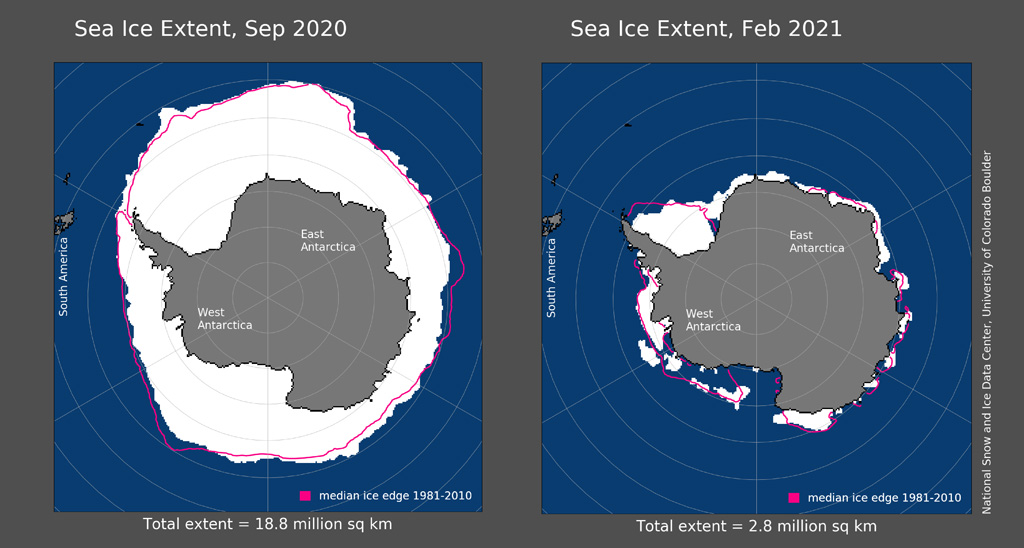
Maps of Antarctic sea ice extent at the most recent winter maximum on 28 September 2020 (left) and summer minimum on 21 February 2021 (right). The pink lines show the 1981-2010 average extent for that month. Credit: NSIDC.
This year-to-year variability means that Antarctica has less thick sea ice that lasts for multiple years. It also means that sea ice extent is more likely to vary substantially from one decade to the next.
The chart below shows how annual average Antarctic sea ice extent has fluctuated through the satellite record.
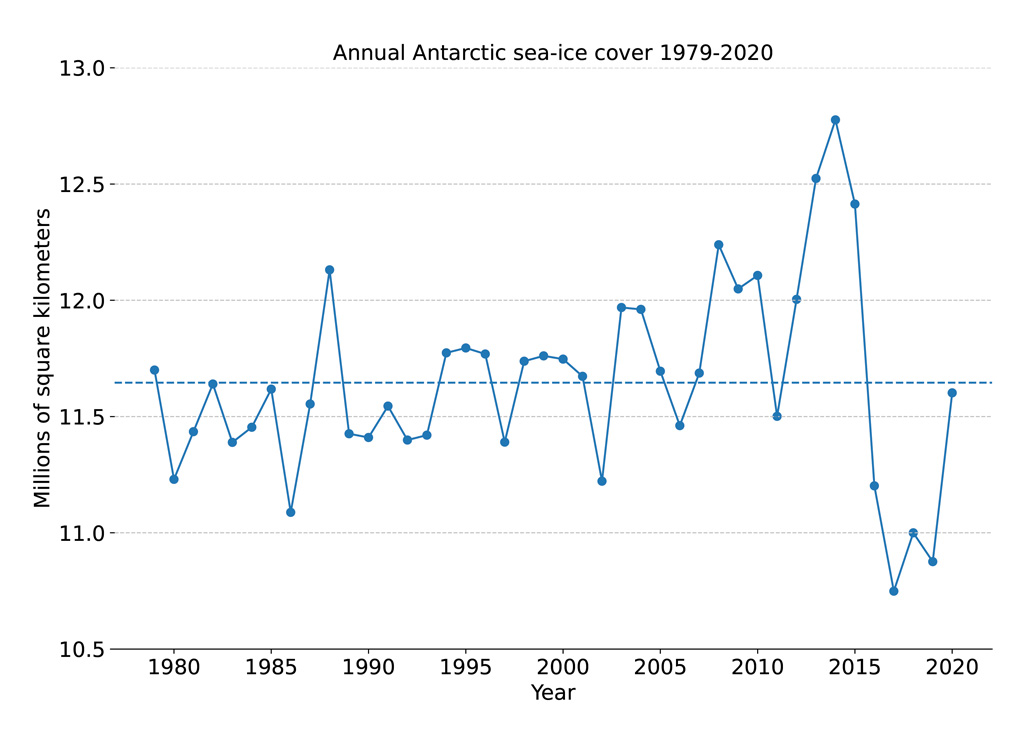
Annual Antarctic sea ice extent from 1979 through to 2020 (average for the period is shown by dotted blue line), based on data from the National Snow and Ice Data Center (NSIDC). Based on satellite data, sea ice extent is the total area where the ice concentration is 15% or higher. The total trend masks major and contrasting regional changes. Credit: Clare Eayrs.
Processes near and far shape the ice
Sea ice forms at the interface between the atmosphere and the ocean. How much it grows or melts depends on the interactions between them. The surface winds that can blow sea ice around and bring warm or cold air to the region are controlled by a large-scale atmospheric circulation. At the same time, the upper ocean transfers heat between the deep ocean and the atmosphere.
The figure below highlights the different forces at play around Antarctica. Known as the “roaring 40s”, “furious 50s”, or “screaming 60s” – depending on their latitude – the westerly winds that encircle Antarctica (shown by the black arrows) periodically strengthen or weaken via a circulation pattern known as the Southern Annual Mode (SAM).
Strengthened westerlies have a “two-timescale” effect on the sea ice cover. Stronger winds initially drive sea ice expansion by pushing sea ice away from the Antarctic continent and bringing cold, surface waters northwards, which then freeze. But, over decades, this increased northward transport brings warm, deep ocean waters to the surface that melts sea ice, resulting in a reduced cover in the long-term (small red arrow).
The circumpolar flow of the westerlies is interrupted by a zonal-wave-number three pattern. As the name suggests, this is a pattern of three high-pressure ridges interspersed with three low-pressure troughs. The deepest of these low-pressure troughs is the Amundsen Sea Low (ASL) – shown by the blue shaded area and named after the sea off West Antarctica it typically sits above. Winds move clockwise around such low-pressure systems in the southern hemisphere, blowing cold air and sea ice northwards on the western flank. Warm air blows southwards on the eastern flank and can push sea ice back towards the coast. These winds are shown by the green arrows.
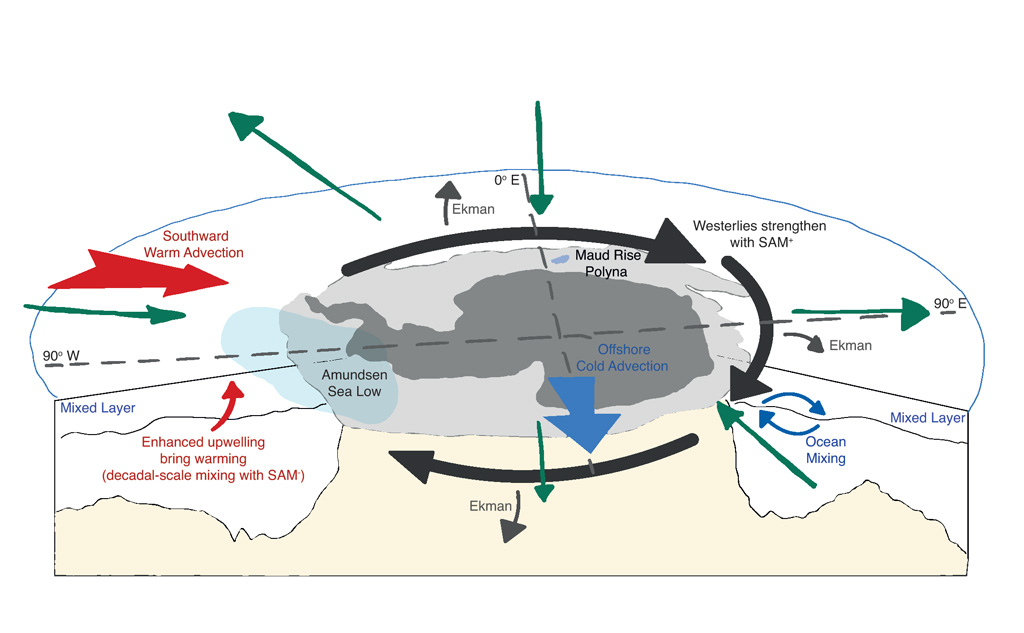
Stronger westerlies (black arrows) push cold, surface water and sea ice northwards. The zonal-wave-number-three pattern can bring warm air southward and blow cold air northwards (green arrows). On decadal timescales, strengthened westerlies upwell warm, deep waters to the surface (small red arrow) leading to decreased sea ice cover. Credit: Clare Eayrs, adapted from Eayrs et al. (2021).
In addition, a perhaps surprising influence on Antarctic sea ice comes from the tropical oceans. When the ocean surface warms, heat and moisture rise vertically in the atmosphere. The atmosphere attempts to stay in balance and a giant meandering wind called a planetary wave, or Rossby wave, transfers this heat towards the poles.
Two important climate cycles affect Antarctic atmospheric circulation in this way. The Interdecadal Pacific Oscillation (IPO) describes how sea surface temperatures in the western Pacific swing between warm (IPO+) and cool (IPO-) phases. Similarly, the Atlantic Multidecadal Oscillation (AMO) represents warm (AMO+) versus cool (AMO-) sea surface temperatures in the North Atlantic Ocean.
The IPO and the AMO act on different timescales and influence the Antarctic atmosphere in different ways. IPO- and AMO+ lead to a deeper Amundsen Sea Low and stronger westerly winds, as shown in the table below.
| IPO+ | IPO- | AMO+ | >AMO- | |
|---|---|---|---|---|
| Westerlies | weaker | stronger | stronger | weaker |
| Amundsen Sea Low | shallower | deeper | deeper | shallower |
Sea surface temperatures in the tropical oceans can influence the strength of the Antarctic westerly winds and the character of the Amundsen Sea Low in different ways.
Less wind (+ a warmer ocean) = less ice
The 2016 decline was mostly due to coincidental, but naturally occurring variability.
There is still some debate on whether deep ocean heat played a role in rapidly melting the sea ice, but we know that, during the decade before, IPO- strengthened the westerlies and set up the conditions to bring warm water to the subsurface of the ocean.
First, a strong zonal-wave-number-three pattern in the autumn of 2016 resulted in southward transfer of atmospheric heat. Then, an exceptional weakening of the winds circling the Antarctic continent pushed sea ice back towards Antarctica and caused the massive reduction in sea ice cover.
A change to the IPO+ and AMO- weakened the westerly winds, but many other explanations for the especially weakened westerlies have also been proposed.
The chart below shows the dramatic shift in Antarctic sea ice (blue line), before (orange solid line) and after (orange dashed line) August 2015.
There is still a lot of work to be done to understand the role of different drivers so that we can project how Antarctic sea ice might change in the future.
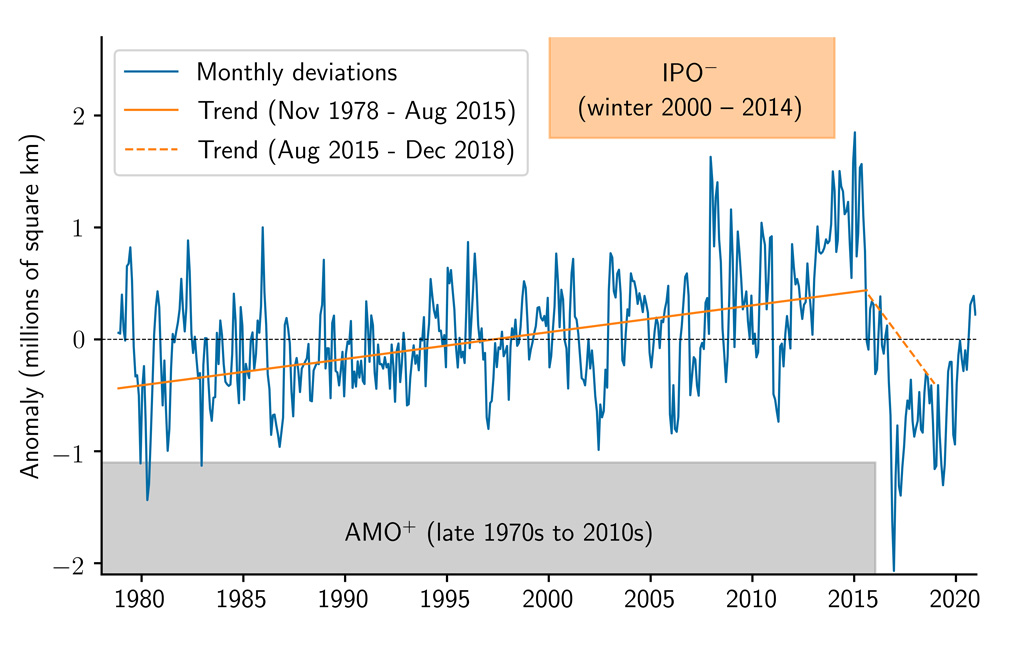
Monthly sea-ice extent anomalies since 1979 with respect to the 1979-2018 climatology (blue line), based on data from the NSIDC. Trend lines (orange) are calculated through the monthly anomalies. Orange shading indicates when the IPO was negative. Grey shading indicates when the AMO was positive. Credit: Clare Eayrs, adapted from Eayrs et al. (2021).
A blip in the record or a harbinger of future rapid decline?
Antarctic sea ice now seems to be returning to close to its average state over the satellite record – although it has a long way to go to get back to the record high coverage reached in 2014.
We know that the westerly winds are key to determining how much sea ice there is in a given year, but we still have a lot to learn about the processes that drive these winds.
However, it is clear that tropical variability has a role to play. Changes in Antarctic sea ice also have a profound effect on the tropics and these linkages warrant further investigation.
The westerlies are expected to intensify as the climate warms. The “two-timescale” theory described above suggests that this will lead to sea ice expansion in the short term but eventually the cover will decrease. Stronger westerly winds are also expected to lead to increased heat storage in the Southern Ocean, which also points to a future fall in sea ice extent.
What next?
Our understanding of the processes that control Antarctic sea ice cover is hampered by a lack of observations and, for now, we rely on the 40-year satellite record to monitor sea ice. One pressing concern is a potential two-to-five-year data gap between the expected decommissioning of ICESat-2 and CryoSat-2 – the only two satellites providing altimetry in polar regions – and the launch of the next polar altimeter, CRISTAL, in 2027.
Sea ice extent is only part of the story. For now, we only have reliable information on sea ice cover from satellites. Accurately measuring Antarctic sea ice thickness is an active area of research and is essential if we are to fully understand how the ice is changing.
It is clear that the processes that influence Antarctic sea ice act on a wide range of time and space scales. New techniques are urgently needed as we can no longer rely on linear techniques and zonally-averaged metrics to study sea ice variability.
Is there a human-caused influence? The recent rapid decline was caused by natural variability, but we cannot rule out the role of human activity. In particular, the role of anthropogenic forcing in driving changes from the tropics should be the focus of future research.
It is clear that, under certain conditions, Antarctic sea ice can be susceptible to rapid change. Sea ice plays a significant role in global climate and it is important that we narrow the knowledge gaps to be able to make future projections.
Eayrs, C. et al. (2021) Rapid decline in Antarctic sea ice in recent years hints at future change, Nature Geoscience, doi:10.1038/s41561-021-00768-3. The authors of this guest post would also like to acknowledge the contribution of their paper co-authors, Dr Xichen Li and Prof Marilyn Raphael.


As of now, 365 day trailing average of sea ice extent is now above the (meaningless) linear trend by 60k km2. You can see the image here...
Arctic Sea Ice Forum - Antarctic Sea Ice
[BL] Link edited per following comment.
Whoops - address is
https://forum.arctic-sea-ice.net/index.php/topic,1759.msg314913.html#msg314913
[BL] Link activated.
gerontocrat @1/2,
For clarity, I have snatched your 'graphic of JAXA's VISHOP Antarctic SIE 1980-to-date' from Neven's Forum and installed it below.
Global sea ice, showing both Arctic and Antarctic sea ice extent changes over time in the satellite observational record:
Arctic sea ice extent continues its multidecadal decline and Antarctic sea ice extent is currently at normal, average values.
Source: NSIDC