


 Arguments


Is this the most embarrassing error in the DOE Climate Working Group Report?
Posted on 8 October 2025 by Guest Author
This is a re-post from The Climate Brink by Andrew Dessler
In the last few weeks, I’ve often been asked, “What’s the most significant mistake in the DOE Climate Working Group Report?” While the report contains numerous issues, one in particular stands out for its far-reaching implications. I write about it in this post.
A recent report from the U.S. Department of Energy’s Climate Working Group (DOE CWG) attempts to analyze and critique the findings from the Intergovernmental Panel on Climate Change (IPCC). In doing so, the DOE CWG Report makes several fundamental errors due to a misunderstanding of the peer-reviewed literature.
One in particular stands out, as it leads the authors to incorrectly represent the established science on extreme weather.
Section 8.5 of the DOE CWG Report focuses on a single table in the IPCC report (Table 12.12 in the Sixth Assessment’s Working Group 1 Report) and, based on this table, concludes: “it is not currently possible to attribute changes in most extreme weather types to human influences.”
With this statement, the CWG demonstrates that they have no idea what they’re talking about.
Confusing “detection and attribution” with “emergence”
Table 12.12 isn’t about detecting whether humans are making extreme weather more extreme. That work — known as detection and attribution — is detailed extensively in other parts of the IPCC report, particularly Chapter 11.
For example, at the end of Section 11.4.4, when talking about extreme precipitation, they state:
In summary, most of the observed intensification of heavy precipitation over land regions is likely due to anthropogenic influence, for which greenhouse gas emissions are the main contributor.
You can also see attribution statements connecting humans to, for example, extreme heat and some types of drought.
Chapter 12 and Table 12.12 are about something different and much stricter: emergence.
To understand the difference, let me give you an example. Imagine you have a data set that is an index of some kind of extreme weather:
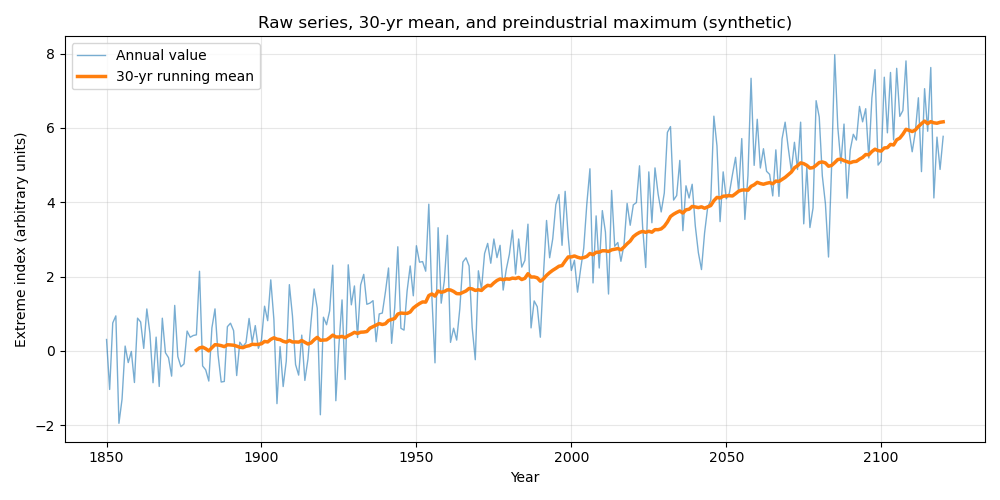
Detection and attribution identifies a statistically significant change in the parameter of interest. In this case, I determine the date of detection as the first year when there is a statistically significant difference between the 30-year running mean and the pre-industrial mean:
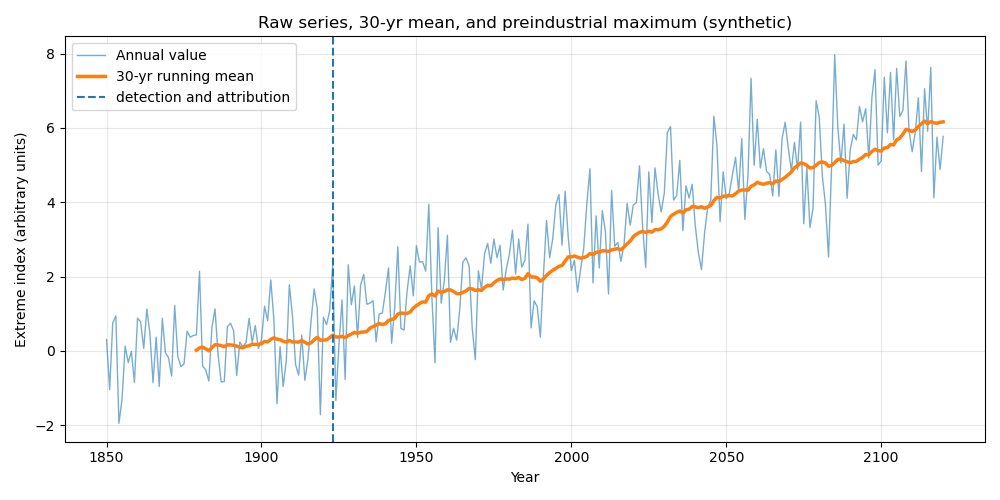
Note that detection and attribution says nothing about the size of the change. It only says that the climate has shifted. If you have really good data and a long time series, you can detect small changes in a parameter
Emergence is all about the size of the influence. It means that the climate has shifted so much that the average value of some parameter is larger than the largest value in a pre-industrial climate. In other words, you’ve emerged into a new climate.
Here is emergence in the example data set:
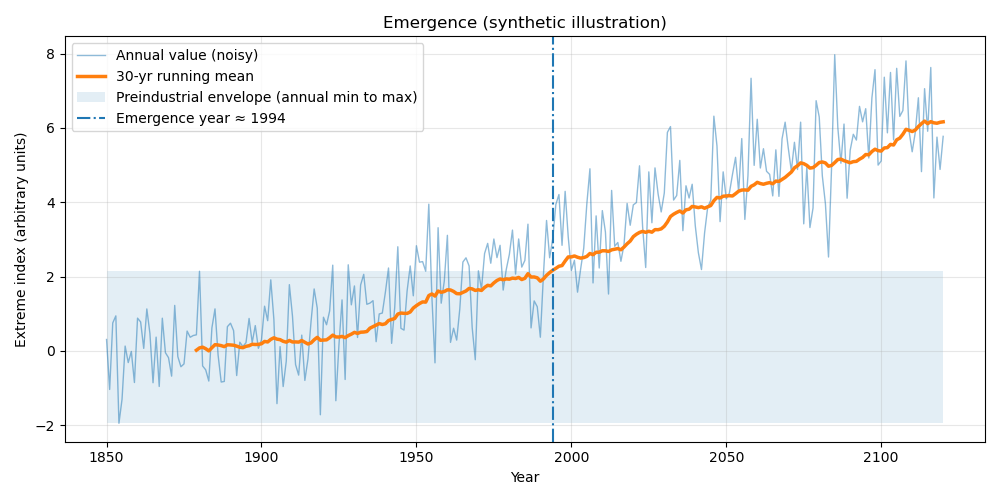
The plot shows that the 30-year running mean (orange line) exceeds the pre-industrial range (the shaded region) in the mid-1990s. That’s the time of emergence. [Update: I should have used standard deviation of pre-industrial values, not the full range. My bad.]
Because emergence requires a large shift, it’s a far rarer occurrence than simply detecting and attributing a trend in some weather parameter.
I should note that my simple example above really focuses on detection. Detection and attribution research uses sophisticated techniques to identify a trend and assign its cause to human influence through, e.g., the use of fingerprints (e.g., a cooling stratosphere).
For example, recent work by Santer et al. (2025) showed that, had humanity had the quality measurements we have today, they could have detected and attributed global average warming to humans by the late 1800s.
the central flaw in the DOE Report’s argument
Many parameters have trends that have been detected and attributed to human activities (Chapter 11) but have not yet changed so much that they have emerged (Chapter 12).
The entire argument in Section 8.5 rests on this single, critical misunderstanding of these distinct concepts. This leads the authors to arrive at a demonstrably incorrect conclusion: “it is not currently possible to attribute changes in most extreme weather types to human influences.”
In fact, the extensive attribution findings detailed in Chapter 11 of the IPCC report make it clear that humans are indeed influencing extreme weather.
The authors of the DOE CWG report appear to have noticed this discrepancy. On page 95, they write:
: Evidence of observed changes in extremes and their attribution to human influence (including greenhouse gas and aerosol emissions and land-use changes) has strengthened since AR5, in particular for extreme precipitation, droughts, tropical cyclones and compound extremes (including dry/hot events and fire weather). Some recent hot extreme events would have been extremely unlikely to occur without human influence on the climate system. By contrast, as noted in Section 8.5, Chapter 12 of WG1 (Table12.12) paints a different picture presumably, the expert judgment of different groups of authors for the two chapters came to different conclusions (Ranasinghe, 2021): • High confidence in an increase in extreme heat events in tropical regions where observations allow trend estimation and in most regions in the mid-latitudes, medium confidence elsewhere • Medium confidence in a decrease in extreme cold events in Australia, Africa and most of northern South America where observations allow trend estimation • No evidence of emergence in the historical period of a change in river floods, heavy precipitation, drought, fire weather, severe windstorms, and tropical cyclones")
Given this puzzling (to them) disconnect between Chapters 11 and 12, they could have spent some time digging into this to understand it. They could, for example, have actually read the IPCC reports and supporting literature. Or they could have emailed a few experts and asked why chapters 11 and 12 reached seemingly different conclusions.
But they didn’t. Instead, the authors expended zero effort to get the science right.
And, believe it or not, there are even more errors in this section. If you want to see the full list of mistakes, see the full comment on Section 8.5 beginning on p. 316 of the Climate Experts’ Review of the DOE CWG Report.
How to think about the DOE CWG Report
The errors in the DOE CWG Report are significant. The effect of these errors is to generate conclusions that cast unwarranted doubt on established climate science. As I’ve said before, the generation of unwarranted doubt is the same strategy that the tobacco industry used to delay regulation in the 1960s, 70s, and 80s.
It’s also worth noting that the errors in Section 8.5 also prove that the report never had any legitimate peer review. It only took me 30 seconds of reading this section to realize, “Oh, they f*cked this up.” Anyone familiar with climate science would quickly identify this error, so the fact that this was not caught means any “peer review” the report had before it was released was a fiction.
If the DOE is committed to a legitimate debate over climate science, the scientifically appropriate step would be to acknowledge and correct this and other identified errors. So far, that has not happened.
In fact, they’ve taken the opposite tact. For example, Steve Koonin wrote a Wall Street Journal op-ed in which he declared: “Though scientists supporting the so-called consensus on climate change have organized several serious critiques [of the DOE CWG Report], these at most add detail and nuance to our findings, without negating the report’s central points.”
To suggest the identification of this core error in Section 8.5 merely “adds detail and nuance,” as Steve Koonin did, is laughable. Our analysis of Section 8.5, along with our analysis of other sections, directly falsifies the report’s core assertions about climate change’s impact on extreme weather.
This serves as a litmus test for the report’s scientific credibility. A commitment to scientific integrity requires the authors to produce a point-by-point response to the expert comments, overseen by an independent review editor.
A refusal to do so would suggest that the report should be viewed as an advocacy piece rather than a scientific document, and its conclusions should be treated with caution.
While this post focuses on one section, the rest of the DOE CWG Report is not much better. The entire document contains a pattern of errors, including simple errors of understanding, misinterpretation of source material, cherry-picking of data and sources, and selective citation.
The public and policymakers deserve a more accurate and rigorous scientific assessment of climate science for decision-making. I suggest that the U.S. Government withdraw this report and instead establish a transparent assessment of climate science that follows best practices for credible assessments. They can call it the National Climate Assessment.


Thank you for putting this together and sharing this important document, a concise response to all of the information distortions and misinformation circulating. By putting it out here and in Climate Brink, folks will surely disseminate it far and wide.
My request is that even though public hearings have closed for responses to this deeply flawed document, composed by a "flash committee" that disappeared almost as quick as it was created, I hope that efforts will be made to place this in the hands of relevant Senate and House Committe members as well. Namely, members and staff of the House of Representatives Energy and Commerce Committee (Bret Guthrie chair), the Office of Congressional and Intergovernmental Affairs Committee and on the Senate side: members of the Senate Committee on Energy and Natural Resources.
Objections to this flawed rationale for gutting coordinated efforts to reduce carbon emissions, conserve energy, incentivize renewables while removing fossil fuel subsidies should continue to be challenged and protests and objections should be mounted at every step of the way. The current Administration's push to replace a sane energy strategy for the future with short sighted attacks on that strategy in the name of short term gains for the well positioned financial interests should be exposed for what it is at every turn. Trump's handlers need to know that ignoring physics and biology is like tearing up a parking ticket in a big city: the cost only goes up!
Good commentary, however I think it would have been helpful to include table 12.12 in your commentary, or at least a link to chapter 12. This is a link to chapter 12:
www.ipcc.ch/report/ar6/wg1/downloads/report/IPCC_AR6_WGI_Chapter12.pdf
Table 12.12 is on page 1856 in the link well down near the bottom.
In my opinion The DOE report is pure idiocy. Just venting my annoyance with it. Thankyou to the many people that have written good submissions rebutting it including the one above. While rebutalls are sometimes claimed to spread the lies / distortions I think its still important to rebut such reports as they can be superficially convincing to fence sitting decision makers.
An excellent description of proper use of statistics for data evaluation. I thank Dr. Dressler for the illustrative graphics.
My choice for most embarrassing would be something simpler because it is obvious once identified. Then it is revealed as an undergraduate level misrepresentation by irrelevant comparison. Here is an excerpt of my submitted comments.
On p. 13, Section 3.1.1 Historical radiative forcing
“Figure 3.1.1 shows that the anthropogenic forcing component was negligible before about 1900 and has increased steadily since, rising to almost 3 W/m2 today. However, this is still only about 1 percent of the unperturbed radiation flows, making it a challenge to isolate the effects of anthropogenic forcing; state-of-the-art satellite estimates of global radiative energy flows are only accurate to a few W/m2.”
Comparing 3 W/m2 to 240 W/m2 is misleading and diminishes the significance of 3 W/m2. It is an example of science denialism by distraction, obfuscation, and omission. Straightforward, fundamental physics including conservation of energy and radiant energy calculations combined with atmospheric properties allow the effects of anthropogenic forcing to be isolated by calculation. The calculated spectra of energy loss to space is verified by satellite measurements (Hanel, et al.,1972) (Brindley & Bantges, 2015). 3 W/m2 is sufficient to cause and continue observed global warming. The anthropogenic forcing is not determined by difference of two large, measured numbers and does not rely on just satellite estimates of radiative energy flows. There is very little uncertainty about the effects of increasing gas concentrations.
Even a relatively simple radiant energy model can isolate the effects of anthropogenic forcing that are used for changes in energy flux at the top of the atmosphere caused by changing conditions. Sophisticated climate models use the same approach for radiant energy calculations.
References:
Brindley & Bantges, “The Spectral Signature of Recent Climate Change,” Current Climate Change Reports, 2, July 2016. doi.org/10.1007/s40641-016-0039-5
Hanel, et al., “The Nimbus 4 infrared spectroscopy experiment: 1. Calibrated thermal emission spectra,” Journal of Geophysical Research, 77(15), May 1972.
Apologies for misspelling Dr. Dessler's name.
I have to use simple breathing techniques to read/listen to anything from this Trump regime! Enabled by a political party of grifters and cowards with little conscience and no mirrors in their many houses.
Generations of this countrys populous fed on years of media stereotyping dumbing most down and culminating in electing a malignant man not once but twice. A mob boss,whose arsehole has swapped places with his mouth.
Indeed, Wikipedia on their "false and misleading statements by Donald Trump" page, have trouble deciding whether to split the narrative into 2 pages! en.wikipedia.org/wiki/False_or_misleading_statements_by_Donald_Trump
I guess it is about people voting against their own best interests. Seeing the big picture without the baggage you have grown up with or picked up along lifes journey. It seems not becoming a fatalist is much harder now and giving in to such is a guarantee of a dismal future for those generations to come.
History suggests that the authors of the DOE report are largely incapable of being embarrassed. Their determination to spread their message, in spite of numerous criticisms and corrections, is quite remarkable.
Charlie Brown @ 4:
That is an interest take: that they argue 3 W/m2 is small compared to the total radiative flux. It seems that they are using the "it's a trace/small amount compared to [X]" template that has been used in a variety of poor contrarian arguments; vis a vis:
CO2 is a trace gas
Anthropogenic emissions are small compared to natural cycles
Are there any other arguments that fit this same template?
DenialDepot had a fun post (15 years ago!) on how to cook a graph by playing with the Y-axis. Of course, in its standard mocking of the contrarians, DenialDepot accuses Skeptical Science of cooking the graphs by not expanding the Y-axis to make the change look minuscule. (DD looked at sea ice.) DD shows the "proper" method should be to compare the lost sea ice area to the total area of the earth. In DD's words, "That's far more clear. Immediately I am having trouble seeing the sea ice. This is good. If you can't see it, it's not a problem."
It's like a defendant in court arguing "how can it be grand larceny? I only took $100,000. He has billions."