


 Arguments


Most of the world has recently set all-time heat records
Posted on 13 October 2025 by Zeke Hausfather
This is a re-post from The Climate Brink
We focus a lot on global average temperatures, but this tends to mask the real local impacts that climate change is having. The land – where all of us live – is warming about 40% faster than the global average, and high latitude regions are warming even faster.
One of the many ways to visualize this regional heat is to look at when all time high temperature records were set for each region of the world. Here I’m build upon a Carbon Brief analysis I published back in 2023 that looked at daily temperature data from ERA5 – a great resource, but one that unfortunately only extended back to 1950 at the time (and back to 1940 today).
We know of at least some regional heat events – the 1930s in the north-central US for example – that set records prior to 1950 that were missed in my earlier analysis.
The figure below shows a map of when the record for the warmest temperature of the year occurred for each 1x1 lat/lon degree grid cell on the planet, extending back to 1850 (when local data allows). By warmest temperature I mean the warmest average monthly temperature (TMax, in absolute terms). I’ve further restricted the analysis to only show grid cells with at least 90 years of data – e.g. extending back to at least 1934. This uses the Berkeley Earth monthly dataset; their daily dataset could also be used but the results would only change modestly and the daily file sizes are a bit too prohibitive for a quick analysis.
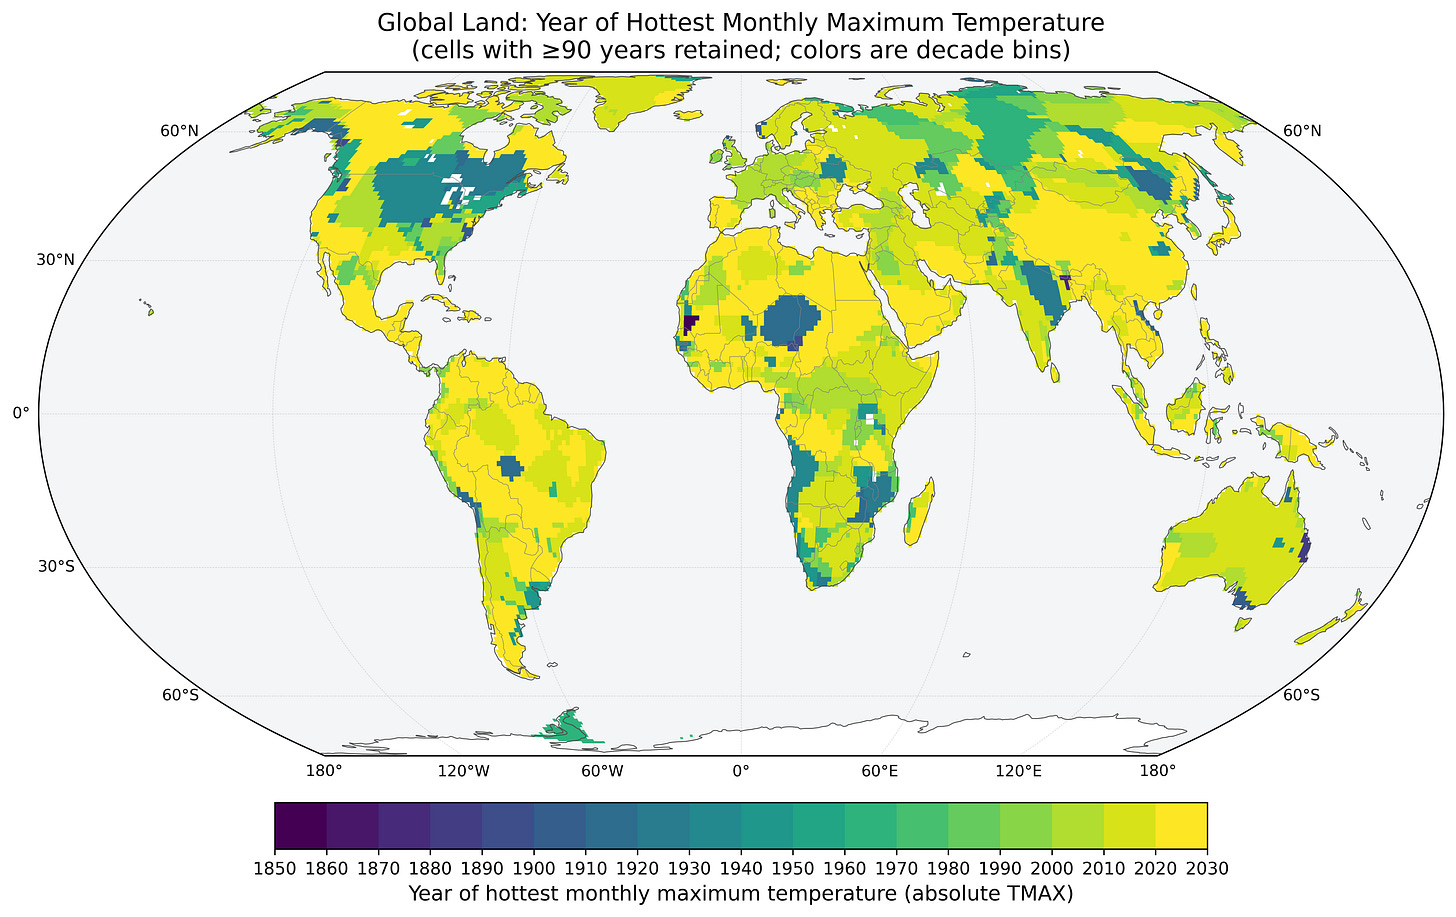
Here we see that much of the world set a maximum monthly TMax temperature in the 2000s, 2010s or 2020s. There are a few regions – central North America, central and southern Africa, western India, etc. – that saw records set earlier, but this is not unexpected due to regional temperature variability (e.g. weather).
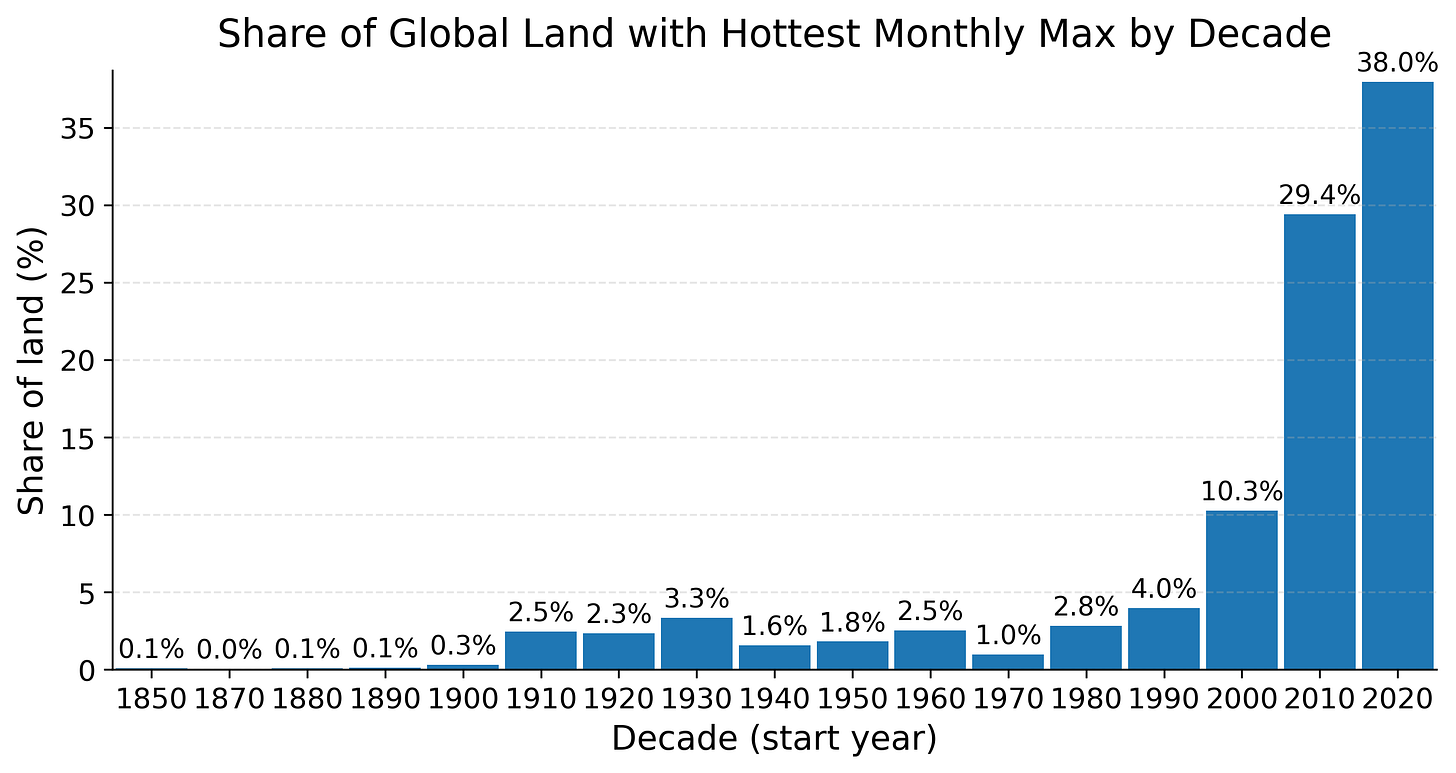
The figure below, which shows the percent of the world’s land that set a record in each decade, makes it clear that the vast majority of the Earth’s surface has seen a record set recently; indeed, 38% of the land surface has set a new record in the 2020s, despite the decade being incomplete. Overall, around 78% of the land surface area has seen a new all-time monthly high record set after the year 2000.
So the next time someone highlights a small region of the world to say that extreme heat has occurred before, suggest that they might be picking cherries rather than seeing the larger picture – a rapidly warming world on top of regional natural climate variability that is forcing more and more regions to set new all-time records each year.


Comments