


 Arguments


On Statistical Significance and Confidence
Posted on 11 August 2010 by Alden Griffith
Guest post by Alden Griffith from Fool Me Once
My previous post, “Has Global Warming Stopped?”, was followed by several (well-meaning) comments on the meaning of statistical significance and confidence. Specifically, there was concern about the way that I stated that we have 92% confidence that the HadCRU temperature trend from 1995 to 2009 is positive. The technical statistical interpretation of the 92% confidence interval is this: "if we could resample temperatures independently over and over, we would expect the confidence intervals to contain the true slope 92% of the time." Obviously, this is awkward to understand without a background in statistics, so I used a simpler phrasing. Please note that this does not change the conclusions of my previous post at all. However, in hindsight I see that this attempt at simplification led to some confusion about statistical significance, which I will try to clear up now.
So let’s think about the temperature data from 1995 to 2009 and what the statistical test associated with the linear regression really does (it's best to have already read my previous post). The procedure first fits a line through the data (the “linear model”) such that the deviations of the points from this line are minimized, i.e. the good old line of best fit. This line has two parameters that can be estimated, an intercept and a slope. The slope of the line is really what matters for our purposes here: does temperature vary with time in some manner (in this case the best fit is positive), or is there actually no relationship (i.e. the slope is zero)?
Figure 1: Example of the null hypothesis (blue) and the alternative hypothesis (red) for the 1995-2009 temperature trend.
Looking at Figure 1, we have two hypotheses regarding the relationship between temperature and time: 1) there is no relationship and the slope is zero (blue line), or 2) there is a relationship and the slope is not zero (red line). The first is known as the “null hypothesis” and the second is known as the “alternative hypothesis”. Classical statistics starts with the null hypothesis as being true and works from there. Based on the data, should we accept that the null hypothesis is indeed true or should we reject it in favor of the alternative hypothesis?
Thus the statistical test asks: what is the probability of observing the temperature data that we did, given that the null hypothesis is true?
In the case of the HadCRU temperatures from 1995 to 2009, the statistical test reveals a probability of 7.6%. Thus there’s a 7.6% probability that we should have observed the temperatures that we did if temperatures are not actually rising. Confusing, I know… This is why I had inverted 7.6% to 92.4% to make it fit more in line with Phil Jones’ use of “95% significance level”.
Essentially, the lower the probability, the more we are compelled to reject the null hypothesis (no temperature trend) in favor of the alternative hypothesis (yes temperature trend). By convention, “statistical significance” is usually set at 5% (I had inverted this to 95% in my post). Anything below is considered significant while anything above is considered nonsignificant. The problem that I was trying to point out is that this is not a magic number, and that it would be foolish to strongly conclude anything when the test yields a relatively low, but “nonsignificant” probability of 7.6%. And more importantly, that looking at the statistical significance of 15 years of temperature data is not the appropriate way to examine whether global warming has stopped (cyclical factors like El Niño are likely to dominate over this short time period).
Ok, so where do we go from here, and how do we take the “7.6% probability of observing the temperatures that we did if temperatures are not actually rising” and convert it into something that can be more readily understood? You might first think that perhaps we have the whole thing backwards and that really we should be asking: “what is the probability that the hypothesis is true given the data that we observed?” and not the other way around. Enter the Bayesians!
Bayesian statistics is a fundamentally different approach that certainly has one thing going for it: it’s not completely backwards from the way most people think! (There are many other touted benefits that Bayesians will gladly put forth as well.) When using Bayesian statistics to examine the slope of the 1995-2009 temperature trend line, we can actually get a more-or-less straightforward probability that the slope is positive. That probability? 92%1. So after all this, I believe that one can conclude (based on this analysis) that there is a 92% probability that the temperature trend for the last 15 years is positive.
While this whole discussion comes from one specific issue involving one specific dataset, I believe that it really stems from the larger issue of how to effectively communicate science to the public. Can we get around our jargon? Should we embrace it? Should we avoid it when it doesn’t matter? All thoughts are welcome…
1To be specific, 92% is the largest credible interval that does not contain zero. For those of you with a statistical background, we’re conservatively assuming a non-informative prior.


 0
0  0
0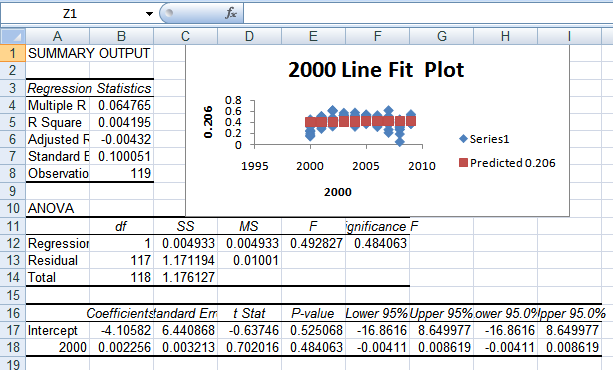
 So here we have completely random temperatures but we still sometimes see a positive trend. If we did this 1000 times like John Brookes did
the average random slope would be zero, but there would be plenty of positive and negative slopes as well.
So the statistical test is getting at: is the trend line that we actually saw unusual compared to all of the randomized slopes? In this case it's fairly unusual, but not extremely.
To get at your specific question - the red line definitely fits the data better (it's the best fit, really). But that still doesn't mean that it couldn't be a product of chance and that the TRUE relationship is flat.
[wow - talking about stats really involves a lot of double negatives... no wonder it's confusing!!!]
-Alden
So here we have completely random temperatures but we still sometimes see a positive trend. If we did this 1000 times like John Brookes did
the average random slope would be zero, but there would be plenty of positive and negative slopes as well.
So the statistical test is getting at: is the trend line that we actually saw unusual compared to all of the randomized slopes? In this case it's fairly unusual, but not extremely.
To get at your specific question - the red line definitely fits the data better (it's the best fit, really). But that still doesn't mean that it couldn't be a product of chance and that the TRUE relationship is flat.
[wow - talking about stats really involves a lot of double negatives... no wonder it's confusing!!!]
-Alden
 It is certainly reasonable to say 'the straight line is a 30 year trend of 0.15 dec/decade'. But this straight line is about as good a predictor as a stopped clock, which is correct twice a day. Superimposed on that trend are more rapid cooling and warming events, which are clearly biased towards warming.
 This is the distribution of monthly temperature anomalies in a 3×3° box containing South-East Nebraska and part of Kansas. There are 28 GHCN stations there which have a full record during the five years long period 1964-68.
42572455002 39.20 -96.58 MANHATTAN
42572458000 39.55 -97.65 CONCORDIA BLO
42572458001 39.13 -97.70 MINNEAPOLIS
42572551001 40.10 -96.15 PAWNEE CITY
42572551002 40.37 -96.22 TECUMSEH
42572551003 40.62 -96.95 CRETE
42572551004 40.67 -96.18 SYRACUSE
42572551005 40.90 -97.10 SEWARD
42572551006 40.90 -96.80 LINCOLN
42572551007 41.27 -97.12 DAVID CITY
42572552000 40.95 -98.32 GRAND ISLAND
42572552001 40.10 -98.97 FRANKLIN
42572552002 40.10 -98.52 RED CLOUD
42572552005 40.65 -98.38 HASTINGS 4N
42572552006 40.87 -97.60 YORK
42572552007 41.27 -98.47 SAINT PAUL
42572552008 41.28 -98.97 LOUP CITY
42572553002 41.77 -96.22 TEKAMAH
42572554003 40.87 -96.15 WEEPING WATER
42572556000 41.98 -97.43 NORFOLK KARL
42572556001 41.45 -97.77 GENOA 2W
42572556002 41.67 -97.98 ALBION
42572556003 41.83 -97.45 MADISON
42574440000 40.10 -97.33 FAIRBURY, NE.
42574440001 40.17 -97.58 HEBRON
42574440002 40.30 -96.75 BEATRICE 1N
42574440003 40.53 -97.60 GENEVA
42574440004 40.63 -97.58 FAIRMONT
It looks like this on the map (click on it for larger version):
This is the distribution of monthly temperature anomalies in a 3×3° box containing South-East Nebraska and part of Kansas. There are 28 GHCN stations there which have a full record during the five years long period 1964-68.
42572455002 39.20 -96.58 MANHATTAN
42572458000 39.55 -97.65 CONCORDIA BLO
42572458001 39.13 -97.70 MINNEAPOLIS
42572551001 40.10 -96.15 PAWNEE CITY
42572551002 40.37 -96.22 TECUMSEH
42572551003 40.62 -96.95 CRETE
42572551004 40.67 -96.18 SYRACUSE
42572551005 40.90 -97.10 SEWARD
42572551006 40.90 -96.80 LINCOLN
42572551007 41.27 -97.12 DAVID CITY
42572552000 40.95 -98.32 GRAND ISLAND
42572552001 40.10 -98.97 FRANKLIN
42572552002 40.10 -98.52 RED CLOUD
42572552005 40.65 -98.38 HASTINGS 4N
42572552006 40.87 -97.60 YORK
42572552007 41.27 -98.47 SAINT PAUL
42572552008 41.28 -98.97 LOUP CITY
42572553002 41.77 -96.22 TEKAMAH
42572554003 40.87 -96.15 WEEPING WATER
42572556000 41.98 -97.43 NORFOLK KARL
42572556001 41.45 -97.77 GENOA 2W
42572556002 41.67 -97.98 ALBION
42572556003 41.83 -97.45 MADISON
42574440000 40.10 -97.33 FAIRBURY, NE.
42574440001 40.17 -97.58 HEBRON
42574440002 40.30 -96.75 BEATRICE 1N
42574440003 40.53 -97.60 GENEVA
42574440004 40.63 -97.58 FAIRMONT
It looks like this on the map (click on it for larger version):

 Mean is essentially zero (0.00066°C), standard deviation is 1.88°C. I have put the probability density function of a normal distribution there with the same mean and standard deviation for comparison (red line).
We can see temperature anomalies have a distribution with a narrow peak and fat tail (compared to a Gaussian). This property has to be taken into account.
It means it's way harder to reject the null hypothesis ("no trend") for a restricted sample from the realizations of a variable with such a distribution than for a normally distributed one. Bayesian approach does not change this fact.
We can speculate why weather behaves this way. There is apparently something that prevents the central limit theorem to kick in. In this respect it resembles to the financial markets, linguistic statistics or occurrences of errors in complex systems (like computer networks, power plants or jet planes) potentially leading to disaster.
That is, weather is not the cumulative result of many independent influences, there must be self organizing processes at work in the background, perhaps.
The upshot of this is that extreme weather events are much more frequent than one would think based on a naive random model, even under perfect equilibrium conditions. This variability makes true regime shifts hard to identify.
Mean is essentially zero (0.00066°C), standard deviation is 1.88°C. I have put the probability density function of a normal distribution there with the same mean and standard deviation for comparison (red line).
We can see temperature anomalies have a distribution with a narrow peak and fat tail (compared to a Gaussian). This property has to be taken into account.
It means it's way harder to reject the null hypothesis ("no trend") for a restricted sample from the realizations of a variable with such a distribution than for a normally distributed one. Bayesian approach does not change this fact.
We can speculate why weather behaves this way. There is apparently something that prevents the central limit theorem to kick in. In this respect it resembles to the financial markets, linguistic statistics or occurrences of errors in complex systems (like computer networks, power plants or jet planes) potentially leading to disaster.
That is, weather is not the cumulative result of many independent influences, there must be self organizing processes at work in the background, perhaps.
The upshot of this is that extreme weather events are much more frequent than one would think based on a naive random model, even under perfect equilibrium conditions. This variability makes true regime shifts hard to identify.


Comments