


 Arguments


From the eMail Bag: Carbon Isotopes, Part 2: The Delta Notation
Posted on 28 December 2017 by David Kirtley
We occasionally receive excellent questions and/or comments by email or via our contact form and have then usually corresponded with the emailer directly. But, some of the questions and answers deserve a broader audience, so we decided to highlight some of them in a new series of blog posts.
In Part 1, we learned about carbon isotopes: how 14C forms in the atmosphere, how different isotopes move through the Carbon Cycle, and how isotopic measurements reveal clues about our changing climate. In this post we will look at how measurements of changing isotopic ratios are described.
Here, again, is the IPCC graph (Figure 1) illustrating the rise in atmospheric CO2 (panel a, black saw-toothed line) and the decreasing 13C:12C ratio in the same CO2 (panel b, red line).
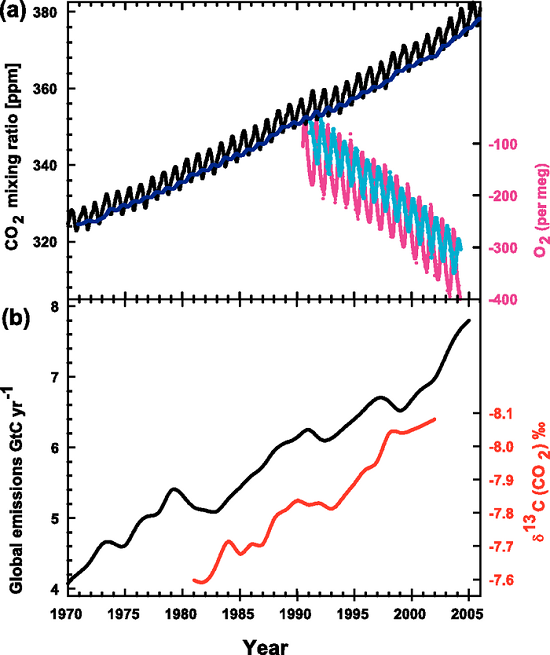
Figure 1. Recent CO2 concentrations and emissions. (a) CO2 concentrations over the period 1970 to 2005 from Mauna Loa, Hawaii (black) and Baring Head, New Zealand (blue). In the lower right of the panel, atmospheric oxygen (O2) measurements from flask samples are shown from Alert, Canada (pink) and Cape Grim, Australia (cyan). (b) Annual global CO2 emissions from fossil fuel burning and cement manufacture in GtC yr–1 (black) through 2005. Annual averages of the 13C/12C ratio measured in atmospheric CO2 at Mauna Loa from 1981 to 2002 (red) are also shown. The isotope data are expressed as δ13C(CO2) ‰ (per mil) deviation from a calibration standard. Note that this scale is inverted to improve clarity. (IPCC, AR4)
One of our readers was puzzled by this graph (which appears in our rebuttal "How do human CO2 emissions compare to natural CO2 emissions?") and emailed us these questions about it:
Can you help me interpret the red line? Does it indicate a decline (negative change) in the C13 isotope (i.e. -7.7 = -7.7 parts per thousands) or are the values showing a ratio of C13/C12 because of the delta symbol? If the red values do represent a ratio can you illustrate with a hypothetical example how a negative value was calculated; for instance how do you get a negative value by comparing C13 with C12 (I would have thought a ratio would produce a fraction of some sort)?
The concentration of atmospheric CO2 is most commonly measured in parts per million (ppm) as seen in the top (a) panel of the graph. The current value is about 405 ppm, which means that for every million molecules in a sample of air there are 405 CO2 molecules. This can be shown as a fraction or a ratio:
![]()
or as a decimal: 0.000405
We can also turn this into a percentage:
![]()
The carbon isotope ratios are measured in something quite different: the δ-value or notation: δ13C(CO2)‰, or "delta 13C (of CO2) per mil". The "per mil" (symbol: ‰) might lead you to think that this too is a measure of concentration, except, instead of a percentage ("per cent" or "per 100") the carbon isotopes might be a measure of "per mil" or "per 1000". But this is not the case. (Or try this link if that last one doesn’t work.)
Here is the equation used to calculate the δ-value:
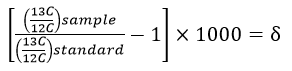
Notice that this equation contains a multiplication by 1000, which is where the "per mil" comes from. The values are multiplied by 1000 because they are very small numbers and this multiplication trick makes the values more "user-friendly". Look again at the IPCC graph which gives the δ-value in 1981 as -7.6‰, the "per mil" symbol tells us that the original value was multiplied by 1000, thus the original value was -0.0076.
But what does -0.0076 mean? Has the 13C decreased by 0.0076...somethings?
Look again at the δ-value equation. You can see that the top part of the fraction within the bracket is the ratio of 13C:12C from some sample containing carbon. The bottom part of the fraction is another 13C:12C ratio from a standard sample which has a known, unchanging ratio of 13C:12C. For carbon isotopes, the standard used is a limestone formation from South Carolina called the Pee Dee Belemnite (or PDB)1, which has an unusually high amount of 13C.
The δ-value is basically a ratio of ratios and can be thought of as a scale to compare different isotope ratios (Figure 2). The standard sample is the zero point of this scale. If there is more 13C in our sample than in the standard, then the δ-value will be positive; if there is less 13C in our sample than in the standard, then the δ-value will be negative. The δ-value doesn't give us a specific number about our sample, as in x ppm of 13C, rather it tells us the relative difference between the sample and the standard.
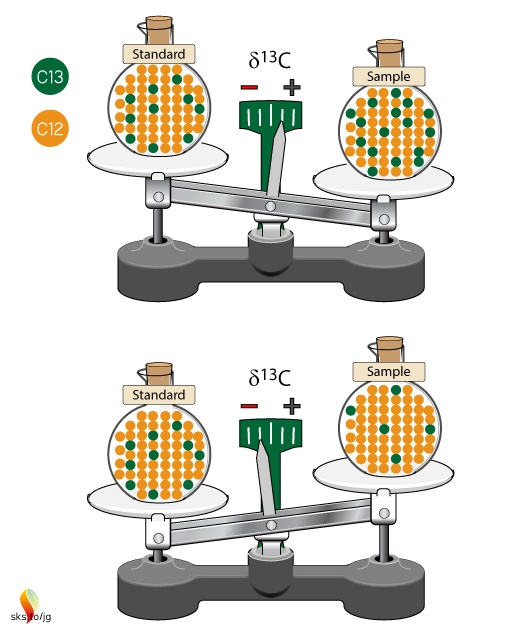
Figure 2. Isotopic ratios of samples are compared to an unchanging isotopic ratio of a standard. The standard defines the zero point of the scale. Samples with more 13C than the standard will have positive δ13C values, while samples with less 13C than the standard will have negative δ13C values.
Why not just give us the specific numbers of carbon isotopes? (Show me the data!) Isotope ratios are measured by mass spectrometers but it is impossible for these devices to perfectly measure the 13C to 12C ratio in a sample. Lauren Shoemaker, in her in-depth NOAA website on isotopes, explains:
Isotope ratio mass spectrometers measure relative isotopic ratios much better than actual ratios. By comparing to a standard, the precision of the data values are much, much better since all values are relative to a given standard.
She also points out that δ-values make it "easier to compare results both among isotope laboratories and within a single laboratory over a long time period".
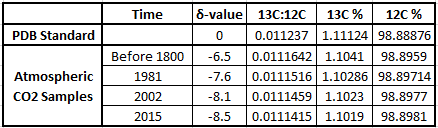
Delta-values also make the numbers associated with isotopic ratios much more "user-friendly". To see this let's work through some examples using the δ-value formula. The IPCC graph shows that in 1981 the δ-value for atmospheric CO2 was -7.6‰. The PDB standard ratio is 0.011237. With these two numbers we have enough information to calculate what the 13C:12C ratio was in 1981:
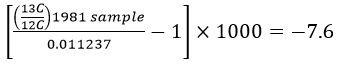
This works out to a ratio of 0.0111516 for the 1981 sample. For 2002 the δ-value was -8.1‰, which gives a ratio of 0.0111459.
Let’s broaden our view out a bit further than that twenty year time span. This graph in Figure 3 (from CSIRO, the Australian agency for scientific research) shows that before the Industrial Revolution the δ-value was -6.5‰. In today's atmosphere, the 13C:12C ratios give a δ-value of -8.5‰.
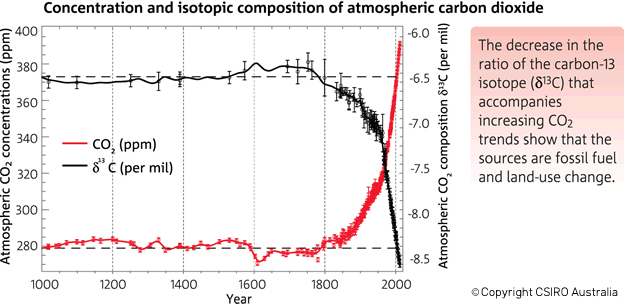
Figure 3. There has been an increase in the atmospheric concentration of CO2 (in red), as identified by the trend in the ratio of different types (isotopes) of carbon in atmospheric CO2 (in black, from the year 1000). CO2 and the carbon-13 isotope ratio in CO2 (δ13C) are measured from air in Antarctic ice and firn (compacted snow) samples from the Australian Antarctic Science Program, and at Cape Grim (northwest Tasmania). (Copyright CSIRO Australia).
The table below shows the δ-values for various times along with the corresponding isotopic ratios, expressed both as decimals and as percentages of 13C and 12C in the atmospheric samples. You can see why scientists use δ-values rather than the actual 13C:12C ratio numbers, which only show changes far to the right of the decimal points! These ratios change by very small amounts over time, but they clearly illustrate big changes in the atmosphere's composition of 13C and 12C, pointing to the fossil fuel origins of more and more of the atmosphere's CO2.
Here is one final comparison to help make the δ-values more understandable. Annual global average temperatures are usually presented as anomalies with reference to some "base period". Figure 4 is a familiar graph of this from NASA-GISS with data from 1880 to 2016. The "base period" for this graph is 1951-19802, the annual temperatures for these thirty years are averaged together and this is set as the zero point of the anomaly scale. So, the base period is like the standard sample used as the zero point in the δ-notation scale. Then, each individual year's data point is compared to that zero point. If a year's temperature was warmer than the base period, then the anomaly for that year is positive, such as 2016's record high anomaly of 0.99°C. This is comparable to positive δ-values. Years with colder values than the base period would be negative, like 1904's record low value of -0.5°C. This is similar to the negative δ-values described above.
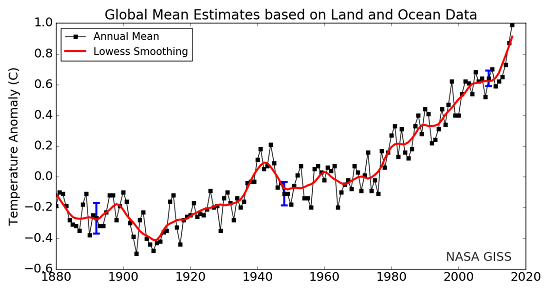
Figure 4. Land-ocean temperature index, 1880 to present, with base period 1951-1980. The solid black line is the global annual mean and the solid red line is the five-year lowess smooth. The blue uncertainty bars (95% confidence limit) account only for incomplete spatial sampling. (NASA-GISS).
In both instances, δ-values and temperature anomalies, cumbersome numbers are converted into more meaningful and useful values. In the case of δ-values, very very small changes in isotopic ratios in the natural environment are more easily described, and we can see more clearly how the Earth's climate system works and changes over time.
1. "The original PDB sample was a sample of fossilized shells of an extinct organism called a belemnite (something like a shelled squid) collected decades ago from the banks of the Pee Dee River in South Carolina. The original sample was used up long ago, but other reference standards were calibrated to that original sample. We still report carbon isotope values relative to PDB but now use the term "VPDB" ["Vienna Pee Dee Belemnite"] to indicate that the data are normalized to the values of that standard." (USGS).
2. Any time period, and any length of time, may be used. A thirty year period is often used because thirty years is a long enough time to describe "average" climate variables.


David, I can't help thinking that "some people" will dismiss such small changes in delta-values as irrelevant. Is there some way to demonstrate that, on the contrary, the effects are significant?
Digby@1 Yes, "some people" might say that such small changes can't tell us anything. It is the same kind of thinking that argues that the amount of CO2 in the atmosphere, and the small increase of that due to human emissions, is too small to matter. Here is the SkS rebuttal dealing with that: How substances in trace amounts can cause large effects.
The examples shown in that rebuttal show that small changes can have large consequences. In our everyday lives, most people can't notice such small changes. But scientists know the importance of these changes and so have devised ways to measure them.
Beyond telling "some people" these facts and examples, I'm not sure what else can be said. For "some people" their gut feelings about things trump the evidence shining before their eyes.
For me, the evidence shown in the CSIRO graph (figure 3) is compelling proof that something is different with the atmosphere's CO2. For most of the last millennium, the delta value was constant at -6.5‰; only in the last ~200 years have we seen a change with those values growing more and more negative. Yes, these are very small changes over time. But these changes are like fingerprints and blood drops at a crime scene: if you know what to look for they contain a wealth of information.
Surely there is a more direct response to this question, arising from two facts: 1) Although the delta-C13 number for carbon fuels is different from that of atmospherica CO2, but not very different. 2) There is a lot of CO2 in the atmosphere, so adding more carbon from fuel combustion can only make a small change. Presumably, someone has compared the actual change over the last 200 years (from the ice core) with the amount of fuel burned so far and the delta-C13 of that fuel (although this may not be possible as long as we don't know how much of each isotope goes into the ocean and how fast the limestone is weathering etc.).
Finally, the fact that the Ozzie plot seems to be relativley free from "noise" should make anyone more confident that it actually measures something important.
Am I correct in thinking that the change in delta value is caused by the burning of fossil fuels? If so, how do you compute the contribution of the latter, given the former?
Digby Scorgie@4,
As jbpawley noted above, it's not easy to compute the balance of FF carbon in atmosphere from δ-value if you don't know the isotopic preference of carbon sinks such as ocean & biosphere. As we can see from e.g. annual cycles of keeling curve, about 4-5 times more carbon is exchanged between biosphere and atmosphere, comapared to what is added to the system from FF. CISRO graph in the article is a measure of a strong correlation (pretty amazing BTW) rather than the carbon balance.
There are other methods for measuring the amount of FF carbon in the atmosphere. For example by checking Declining oxygen concentration because adding 1 mole of C into atmosphere by burning FF must take 1 mole of oxygen (O2) from it. Other processes involving O fluxes (photosynthesis vs. respiration) are in balance. So you can calculate from the graph therein how much C (that burnes to Co2) and H (that burns to H2O) have been burned. 100% of H2O was taken by ocean, while only some 50% was taken by ocean & biosphere. Knowing all of that, and if you know the proportion of C & H in FF we burned (we do), then you can confirm quantitatively how much CO2 increase to expect from a given O2 decline.
Digby @4 "Am I correct in thinking that the change in delta value is caused by the burning of fossil fuels? "
Yes. Think of the pre-industrial atmosphere which had a δ13C of -6.5‰, now start burning coal, oil and gas, which has a δ13C of about -25‰. Over time we are adding more and more carbon which is "lighter", i.e. has less and less 13C as compared to 12C. Hence, the δ13C of atmospheric CO2 has shifted lower to about -8.5‰ currently.
"how do you compute the contribution of the latter, given the former?"
I'm not sure if you can make this computaion. (At least I don't know how to do it!) I don't know if there is a way to say, okay, a decrease in delta values from -6.5 to -8.5 over 200 years = x amount of CO2 emissions from fossil fuels.
The reasoning is more along these lines: knowing that the delta values are decreasing, when normally they are stable at -6.5‰, tells us that more of the carbon in atmospheric CO2 is coming from a "lighter" source. We know that the biosphere contains lighter carbon. (See Part 1 where I go over this.) And fossil fuels are also lighter because they ultimately come from plant material. The biosphere is constantly exchanging carbon with the atmosphere, as plants live, grow, die and decay, but we don't see any major changes which would account for the drop in delta values. However, we have been consistently digging up and burning fossil fuels for the past ~200 years. Perhaps that's it. ;)
Check out this NOAA link for more. And if you have more time check out the entire series on isotopes. I can't recommend it enough!
Skeptical Science asks that you review the comments policy. Thank you.
How to demonstrate to a denier the power of small amounts of stuff. Ask them if they will take .4g g of cyanide. that is to body weight what CO2 is to the atmosphere, or 4 parts in 10,000.
Every year, literally tens of thousands of workers in various industries have exposure to and ingest cyanide, most commonly KCN and NaCN. They do not die because the body can deal with and process it. But to much in a short period of time will kill you.
You can even purchase certain vegetables in the grocery which if not prepared properly or consumed in to large a quantity will kill you. https://en.wikipedia.org/wiki/Cassava.
So natural, abailable, and to much can damage you. Just like to much CO2 can damage the current ecosystem which include us. So, the next time an AGW denier goes on and on about how harmless small amounts of anything are, just offer him some cyanide.
https://www.snopes.com/food/warnings/apples.asp
chriskoz @5, David @6
Thanks for the help. So the idea is simple, but the computation is difficult. Science is not easy!
factotum @7
Please don't confuse us. It's "too much", not "to much".
In this post there is a graphic of co2 concentrations and delta carbon 13 that "proves" human emissions cause co2 increases, it seems disingenuous taking into account that prior to 1800 human emissions were null or insignificant yet the value in delta carbon 13 changes, following co2 concentrations not emissions.
Rabelt,
I don't see your point. The graph of delta CO2 clearly shows that around 1800, the start of increasing fossil fuel use, the amount of C13 in the atmosphere changes dramatically. Before 1800 there are small shifts in the ratio. These shifts seem to correlate with small changes in total CO2. After 1800 the delta C13 goes way down; much, much more than anything before 1800. Are you comparing the small changes before 1800 to the very large changes after 1800 and saying that the small changes indicate the very large changes are natural? The changes are so different in magnitude that you need to provide an explaination why they are so different. The scientific explaination is they are different because of fossil fuel use.
michael sweet,
You don't see how delta c13 changes with the co2 concentrations, from 1000-1800? During this 800 years there is no emissions or they are negligible, in terms of yearly emissions and cumulative.
Ignoring that problem with the theory of changes in delta = emissions, we have the problem of a steady decrease, in delta, from the 1960s to the 2010s, which do not match the increase in emissions, nor the accelerating growth of co2 concentrations.
Rabelt... I don't think it's the correlation alone that makes the basis of this piece of evidence. It's the basic physics in conjunction with the correlation. Say, the cause of warming was something other than burning FF's. In that case you'd expect to not see such a correlation.
Rob Honeycutt,
I am no saying that FF had/has no effect, just saying that our ability to give a good estimate in the human part of this effect is laking at best, when we cant explain with any consistency the behaviour of the data.
Rob Honeycutt,
If FF was the only/main reason for the changes in Delta, why is the period 1750-1850 visible? If the cumulative co2 was just 5Gt, thats not even a full point increase in the co2 ppm, the reduction in Delta should be insignificant; for reference the drop from 1850-1900 is smaller but the cumulative co2 is 45Gt, 9 times greater
Rabelt @ 9, 11, 13, and 14:
You are really missing the big picture on carbon isotope ratios. The C13 levels alone are not "proof" that the fossil fuels are causing the atmospheric rise in CO2 - they are one line of evidence that rules out other sources. You are over-interpreting what you are reading here (or elsewhere).
This post is titled "Part 2". I suggest that you also read Part 1. It gives essential background about how isotope ratios differ across C12, C13, and C14, depending on the source.
You should also read Climate Change Cluedo. Steps 4 and 5 note the significance of changing C14 and C13 levels. To quote,
Isotope ratios are also discussed on How we know human CO2 emissions have disrupted the carbon cycle, and on What is causing the increase in atmospheric CO2.
The caption on figure 3, which states that declining C13 ratios tell us it is fossil fuel combustion should really be interpreted as "the declining C13 ratio tells us that it is not volcanic. Since volcanoes are the only other possible source of C14-depleted carbon, the only remaining explanation is fossil fuels".
And none of those explanations require that C13 ratios be solely dependent on fossil fuel combustion. Figure 3 shows that for 800 years, C13 ratios were only slightly variable, and have now changed significantly once fossil fuel combustion began.
Your argument that "it changed before, so it can't be fossil fuels now" is just a peculiar flavour of the general "climate's changed before" myth that is number one on the hit parade listed on the upper left of every SkS page.
Just because you don't know of or understand an explanation does not mean that there isn't one.
Bob Loblaw,
I would appreciate if people started to read the comments they are responding to, because I already answered your "response", plus I treated more than 1 period (1000-1800). In fact I used the 1000-1800, 1750-1850, 1850-1900 and the 1960s-2010s periods.
There is not a single thing from part 1 that is relevant to this part 2, and all the relevant points are adressed again in this part.
Please next time refer to my comments not to a fantasy you decided to dismantle, thank you.
Bob Loblaw,
Delta C13 is the fingerprint left by FF, if the fingerprint doesnt match then one of the assumptions is wrong: that Delta C13 is a precise indicator of FF usage or that FF dont have an effect on Delta C13, we know the latter true, so it has to be the former. The proof to this is that even using the cumulative co2 gives you a too small amount to affect Delta C13 in any meaningful way, the period specifically is 1750-1850, physically impossible in fact.
I have never said that because there was change before any other change is normal/justified in nature, I said Delta changes previous to human emissions following co2 concentration not FF emissions as there were none, and the ones that existed were accountable for insignificant amounts of co2.
"or that FF dont have an effect on Delta C13" Sorry, I meant: "or that FF does have an effect on Delta C13"
Frankly, Rabelt, you are not making any sense. You are throwing out vague assertions, and you are not providing any logical argument for those assertions.
Carbon cycles are not interpreted solely on the basis of correlations, which is essentially all that you have referred to.
You state "..that Delta C13 is a precise indicator of FF usage...", which clearly shows that you do not understand what C13 ratios tell us. As I explained, it is one small piece of the puzzle, and it is combined with additional information to draw conclusions. You seem to expect a perfect correlation - but if you understood why C13 ratios change (different sources and sinks over time), then you would realize how the specific C isotope characteristics of different sources can help us identify which sources are active.
I have provided additional links to places that will explain it to you, and all you can say is that you think part 1 is irrelevant. I see no evidence that you have understood anything in part 1, or any indication that you have bothered to read any of the other links I provided.
You also state "I have never said that because there was change before any other change is normal/justified in nature", but that is essentially the logical consequence of what you say. Read Michael Sweet's comment at 10. You are assuming that behaviour patterns of C13 ratios and CO2 concentrations prior to 1800 must follow the same variations that occur once fossil fuel sources are added to the mix. Any argument that you make includes the logical consequences of what you state, whether you state it explicitly or not.
You finish with "I said Delta changes previous to human emissions following co2 concentration not FF emissions as there were none, and the ones that existed were accountable for insignificant amounts of co2." The way you have worded this suggests that you think that either CO2 concentration changes cause C13 changes ("delta changes ... following CO2 concentration"), or that C13 changes cause CO2 concentration changes ("delta ... accountable for ... CO2"). This is not even wrong. Both CO2 changes and C13 ratios are the result of other factors in the global carbon cycle. As long as you persist in ignoring the carbon cycle overall, you will be doomed to drawing erroneous conclusions.
Rabelt... "If FF was the only/main reason for the changes in Delta, why is the period 1750-1850 visible?"
Why is it visible? Can you explain more clearly what you're thinking here?
Rabelt... Maybe think of it this way: If burning fossil fuels was primarily responsible for the observed changes in atmospheric CO2 concentrations, based on physics, the prediction would be that there should be an inverse relationship with C13 levels.
The period prior to 1800 is merely the background state prior to the industrial revolution.
Bob Loblaw,
You dont have any authority to say what the main narrative says, so I will continue using the main narrative (IPCC, NASA, CSIRO, etc) as the argument I am debating, not your fantasy.
Delta C13 is a measure that follows the emissions spectrum from human activities, there is no exact correlation indeed, that is what I am arguing, that it doesnt even follow a trend, it follows the co2 concentrations, If we look at the period 1000-1750 (pre-industrial), we can see variations in co2 concentrations are followed by Delta changes, when we look at the other periods, that you are incapable of addressing, we see the same behaviour, Delta follows co2 concentrations not emissions; the narrative from IPCC and similar say that Delta should follow the trends in co2 emissions.
You continue to mention sources that respond and address nothing I say, they dont explain the difference in trends from Delta and co2 emissions, they are explaining the same things as this post (part 1 and 2); Part 1 is irrelevant to the trends in Delta and co2 emissions as it is a physics class, nothing else, maybe read the post and then comment, it would help.
Your interpretation of my statements is irrelevant to what was written in them; I never said the period 1000-1800 is related to post 1800 periods, I exclusively talked about the relation in co2 concentrations and Delta trends in that 800 years period, that you cant read or comprehend is not my problem. Quote the specific part where I said what you accuse me of saying.
The Carbon cycle can affect co2 concentrations and Delta C13, yet your narrative dismiss this and exclusively accuses the change to FF, from 1750-1860 the cumulative CO2 emissions are 8 GT, or the equivalent to 1 ppm, while the change in co2 concentrations was 9 ppm, that presents a mechanism that is not human action that can, and does, change the values and trends from Delta C13 and co2 concentrations.
Rob Honeycutt,
During the period 1750-1850, more specifically 1750-1860, there is the start of the industrial revolution as the IPCC says (1750) to 1860, an arbitrary point of time that I am using because the cumulative co2 emissions reach the 7.8 GT of co2 necessary to increase the co2 concentrations 1 ppm, also because its 100 years roughly; during this period there is a downward trend, yet the annual and cumulative emissions are too small to create any perceptible change, so it seems strange that we can see that trend and we can see that following periods, such as 1850-1900 and 1900-1950, show a very similar trend yet the annual and cumulative emissions are tens to hundreds of times bigger; I would expect a faster trend the bigger the emissions, not a 1 to 1, but there is no big change that correlates them.
Rabelt - The mantle typically has a δ13C of about −5‰, so volcanogenic CO2 emissions can be expected to carry a similar fingerprint. Biosphere carbon is much lighter e.g. in coals, Suto & Kawashima (2016) found −27.4‰ to −23.7‰ (from a sample population of 95 coals from 10 countries). So widespread burning of either vegetation or fossil fuel can be expected to cause a light carbon 'excursion' in the isotope record - and that's what we see. Fig. 3 explains.
Ref:
Suto, N., & Kawashima, H. (2016). Global mapping of carbon isotope ratios in coal. Journal of Geochemical Exploration, 167, 12-19.
John Mason,
Can you guys stop fantasizing what I am saying and inventing what I believe? I am not saying that I have a theory on how the changes in Delta C13 are happening, I am criticizing that the main narrative is giving an absolute as if they have a perfect theory when it can not explain its own proxy.
NEVER SAID ANY REASON AS TO WHY IS HAPPENING, STOP PUTTING WORDS IN MY MOUTH, NO VOLCANOES, NO OCEAN, NO NOTHING, RESPOND TO MY COMMENTS EXCLUSIVELY.
Rabelt,
If we decide to not consider most of what scientists know about the carbon cycle, for example by not considering fossil fuels, volcanoes, the ocean and terrestrial plants, than it is difficult to explain why the carbon 13 is changing. When we consider all that is already known, the explaination for the change in C-13 is that it comes from burning fossil fuels. There is no reason to only consider a fraction of scientific knowledge in our discussion.
Looking at the graph in the OP, I see that before 1800 the concentration of C-13 is flat. You are imagining that you see strong correlations between the carbon concentration and the delta C-13. After 1800 the C-13 dramatically changes. I do not underestand why you think this conplete change from the previous flat line is not significant. The change in C-13 content cannot be from volcanoes or outgassing from the ocean. The only option left is that the C-13 comes from fossil fuels.
Keep in mind that scientists have measured the C-13 content of the air going back much further in time, a couple of hundred thousand years. The only time in the past 400,000 years when there is a dramatic change in the C-13 content of the air in is the last 200 years.
The graph shows that the concentration of C-13 in the atmosphere changed dramatically around 1800. That is when widespread use of fossil fuels started. The C-13 change excludes a volcanic source of the CO2 and also excludes ocean outgassing.
Rabelt:
Again, you are saying "I never said..", and avoiding the logical consequences of what you are saying.
The conversation has all the hallmarks of the following sequence:
A person says:
Someone else says "So, you are claiming that C = 11?
And the first person says "I never said that C = 11. Stop putting words in my mouth."
You keep referring to "the main narrative". Unfortunately, what you have written here tells me that your idea of "the main narrative" is pretty much a strawman. I don't think you have any clue how the carbon cycle works, how different carbon isotopes fit into that cycle and why they would change over time.
Your comment at 23 illustrates this very well. You see a correlation over the period 1750-1860, and then expect to see the exact same response at later times. You seem incapable of realizing the following:
You are hitting two of the five main components of FLICC - the 5 technicques of science denial:
FYI, yes I have some authority with respect to carbon cycles, having been involved in analysis of forest carbon cycles and storage, and having my name on several publications related to that. You can read more about my background on the SkS Team page.
Michael Sweet,
Again for the 50th time, I have never said that the carbon cycle is irrelevant, inexistent or not worth being mentioned, on the contrary, yet for some reason 3 of you have repeated the same dumb statements like it addresses anything I said; quote which part I said anything dismissive about the carbon cycle.
I worry about your ability to see, if you are saying the 1000-1800 period is flat, there is multiple trends that vary from increase to decrease, those trends fit Delta C13 with co2 concentrations, not emissions; for industrial periods (1750-2015) we can see 3 main trends, 1750-1900, 1900-1960 and 1960-2015, this 3 trends periods encompass multiple different trends in co2 emissions
Bob Loblaw,
I love how the guy putting words in my mouth is acussing me of strawmaning his arguments, 10/10.
Quote my comments and explain why they follow your supposed "logical consequences", just saying it again, as you dont show the ability to read the comments I am posting.
"You see a correlation over the period 1750-1860, and then expect to see the exact same response at later times" During this entire period is a stable trend downwards, yet emissions during this period are incapable of generating such a trend. This is only one of the multiple periods I talked.
Again, never said co2 concentrations cause changes in Delta C13, I even said that there had to be other natural mechanism capable of producing this effect. What a great ability to read.
Differences in the carbon cycle are expected, yet only are accepted if they dont contradict the main narrative, unless you wanna say that the decrease during the beginning of the industrial revolution was natural, which I completely agree.
Again another fantasy about what I belive or think, saying I am trying to invalidate climate science, I only talked about 1 specific thing but the entire field will crumble to the ground for just this specific inconsistency, what a joke of an argument.
Sorry to say that your ability to read degrades quite quickly, I never said you didnt have knowledge on the carbon cycle, I said you didnt have any authority to say what the main narrative states, and I was right, as you are just another of the thousands of people that provide research and not a spokesman or director of the main organizations.
Rabelt... "...yet the annual and cumulative emissions are too small to create any perceptible change..."
By what method are you making this determination? When I look at the graph I see a clear and proportional correlation between the two.
Rob Honeycutt,
I am talking about emissions not co2 concentrations.
Rabelt @ 28: "quote which part I said anything dismissive about the carbon cycle."
The fact that you say virtually nothing coherent at all about it - when it is essential to understanding the graph/data you criticize - is all the evidence that is needed.
@ 29: "I love how the guy putting words in my mouth is acussing me of strawmaning his arguments,"
I am not accusing you of strawmanning my arguments - you have strawmanned "the main narrative" (in the context of what climate science - e.g., the IPCC - has said). If you want to provide a counter-argument, you need to give a thorough explanation of "the main narrative" (including the carbon cycle). Until you provide actual evidence that you have at least a basic level of understanding the carbon cycle (not just an assertion), then you're just blowing smoke.
Also @ 29: "Quote my comments and explain why they follow your supposed "logical consequences"
I did quote you, in my comment 19.
You have not responded directly to that, to provide any sort of clarification or indicate what you really meant. Yet you come back with "Again, never said co2 concentrations cause changes in Delta C13..." From this view, it looks as if you are just dodging the question.
And now you are stating "Differences in the carbon cycle are expected, yet only are accepted if they dont contradict the main narrative,"
Congratulations. You have now scored a third point on FLICC - the 5 techniques of science denial. - Conspiracy theories.
Since you clearly are unable to actual specify what "the main narrative" is, your speculation about what contradicts it is not worth the electrons used to transmit it.
And finally, @ 30 "I am talking about emissions not co2 concentrations"
Yet the graph that you began this whole flood of nonsense over is a graph that shows two things as a function of time: CO2 concentrations, and C13 isotope ratios. There is no coherence or consistency to what you say. Buy a clue please: CO2 concentrations, CO2 emissions, CO2 uptake - all are part of the carbon cycle that you keep dismissing. Oh,, sorry - not "dismissing" but just "ignoring".
Bob Loblaw,
So you dont have an argument so you evade the topic, great.
Again no argument so you avoid responding to you putting words in my mouth and not responding to the strawmaning mentioning the "Carbon cycle" as if it was so kind of deity, I am sure you are of much help in the debate. If you are gonna accuse me of not understanding the effects of the Carbon Cycle in Delta C13 I would like to see a quote or a set of specific pages, not a extremely vague statement that mentions the entirety of the concept "Carbon Cycle".
So follow to you means caused, got it, it is my fault for expecting a minimum of comprehension; still I already said that there had to be a natural process that changed co2 concentrations and Delta C13, not sure why you continue to not read it.
Didnt adress any point just wanted to score another "debate bro" point using that joke called FLICC, debate the argument not your ego, please, and thank you. We even have a name for people like you, imagine how unoriginal your tactics of debate are.
"I am talking about emissions not co2 concentrations" It is not directed at you, but following (not causing) another line of debate with another person, but using your own fantasies now I am gonna start accusing the author of this post of believing that co2 concentrations causes changes in Delta C13, because mister Bob teached me how I am supposed to read others people words.
Bob Loblaw,
Let me explain your own field of expertise: Delta C13 starts decreasing around 1750 and continues to decrease ever since, the main narrative blames it on FF.
I see that the human emissions are too low for the mayority of this 270 years period, as we can see in the cumulative and yearly emissions.
I also see that even though the emissions multiply by tens and hundreds of times the speed of Delta C13 decreasing doesnt show any meaningful acceleration.
You use the wildcard "Carbon Cycle", as if that explains something; supposedly this wildcard is able to produce massive amount of co2 with a "deficit" in C13 to compensate the 1750-1850 yearly emissions, as the emission from this years are 0.048 GT of CO2 per year on average with a max of 0.2 GT in 1850, while also making the decline of Delta C13 steady from 1750-1950, even though the yearly emissions have multiplied from 0.01 GT of CO2 per year to 6 GT of CO2 per year.
This also happens during the 1960-2015 period in which the decrease of Delta C13 is quite steady even while the yearly emissions change from 9 GT of CO2 per year to 35 GT of CO2 per year.
Rabelt:
Where is your explanation of exactly what "the main narrative" is?
Until you actually provide a coherent argument, there is no counter-argument to present.
Rabelt @ 34:
Once again, you have nothing more than your eycrometer of patterns. You continue to ignore any sort of analysis that actually looks at the physics of the carbon cycle.
Bob Loblaw,
Start using arguments instead of relaying on big words you will reach futher, until then please behave like an adult
Bob Loblaw,
There has been not a single argument coming from you except the massively broad term "Carbon Cycle" and mentioning that you read followed as caused and supposedly it was my fault
Rabelt:
I'm waiting for your explanation of what you think "the main narrative" is...
Bob Loblaw,
Already said what the main narrative had to say about C13, comment 34.
If you want the entire narrative, you have the reports of the IPCC.
Bob Loblaw,
Now show me where does the IPCC address those changes in the trends, or where in this great library of knowledge there is an explanation fo them.
Rabelt @ 40., 41.
All I see is your narrative. It does not resemble any scientific narrative. In comment 22, when you introduced "main narrative", you said:
Since you want to use the IPCC as a source, please show the sections of the IPCC reports that illustrate this "main narrative".
Rabelt @31... "I am talking about emissions not co2 concentrations."
Well, therein may lay your problem since the graph is concentrations.
Rabelt... Assuming your "main narrative" is "[d]elta C13 starts decreasing around 1750 and continues to decrease ever since, the main narrative blames it on FF"... Your narrative is a basic misinterpretation of the science.
The C13 narrative (if you want to call it that) is merely the physics behind carbon isotopes for natural sources vs through burning hydrocarbons. That it. If you're saying this area of physics is wrong, you need to explain why.
The accepted understanding of this physics merely creates a prediction that can be tested. If the increasing concentrations of CO2 are primarily due to the buring of FF's, then we should see a corresponding relationship with C13. And that's all this is. It's just one piece of evidence that contributes to the scientific understanding that our uses of FF's is the source of increasing CO2 in the atmosphere.
Bob Loblaw,
I have no interest in losing time with people like you so I will imitate your infantile behaviour and just scream IPCC report, good luck with finding anything in those 2k pages reports
[BL} Alas, you have forced me to disconnect from the discussion, and switch to moderator role.
You raised the issue of the IPCC and "the main narrative" in comment 22, and clearly it was nothing more than bluster.. You obviously have nothing constructive to say. Please read the Comments Policy. This post is a clear violation of t he following portion of that policy:
No profanity or inflammatory tone. Again, constructive discussion is difficult when overheated rhetoric or profanity is flying around.
Unless your behaviour changes to a more constructive discussion, expect to see portions of comments - or entire comments - deleted according to the Comments Policy.
Rob Honeycutt,
This post claims emission from FF are responsible yet decides to use a completely different measurement, that changes the discourse from emissions to co2 concentrations, which as the other kid mentioned can not be the cause of changes in Delta C13; even accepting this change, which I dont, the problem still persist, 1750-1900 yearly and cumulative emissions are unable to explain the changes in co2 concentrations, they are too small, and the co2 concentrations show an acceleration during the 1950s-2010s periods that dont match with the steady decrease in Delta C13.
[BL] This simply repeats previous assertions without evidence. This violates the portion of the Comments Policy that states:
Comments should avoid excessive repetition. Discussions which circle back on themselves and involve endless repetition of points already discussed do not help clarify relevant points. They are merely tiresome to participants and a barrier to readers. If moderators believe you are being excessively repetitive, they will advise you as such, and any further repetition will be treated as being off topic.
I'm reluctant to engage with a commenter that peppers a comment thread at a rate of one every couple of hours for almost two full days without establishing some form of understanding as to their purpose. But here goes...
Rabelt @46,
The OP does not claim to show that "emission from FF are responsible" for changing levels of atmospheric CO2. It is providing an explanation of "how measurements of changing isotopic ratios are described" and this in regard to the atmospheric 13C:12C ratio.
This ratio is shown in the OP fig3 waggling over a whole millennium in a very similar way to the level of atmospheric CO2. CO2 levels go up/down and the 13C:12C ratio goes down/up. Such a remarkable correlation tells us (although this is beyond the message of the OP) that the source (and sink) responsible for the changing CO2 levels has a 13C:12C ratio far lower than the atmosphere. Thus that the oceans cannot be the source/sink of that extra carbon waggling the atmospheric CO2 levels.
The source of this rogue CO2 messing up the atmosphere is thus plants, either by their direct destruction or indirectly via fossil fuels which retain the low 13C:12C ratio.
(The middle section of your comment @46 mentions "this change" but does not make entirely plain whether you refer to the "changes in discourse" or the "changes in Delta C13". So, if it is in any way relevant, it is not clear which you don't accept.)
Your comment make two final assertions which I find a little odd. You suggest annual and cumulative CO2 emissions 1750-1900 do not explain the changing atmospheric CO2 levels, the latter being "too small". Further you suggest a mismatch in the AtmosCO2:Delta C13 ratio "the 1950s-2010s periods."
The Global Carbon Project is always a good go-to source for annual carbon emissions. Although their historic LUC data only runs back to 1850, it is plain from their various source-sink numbers that the Atmospheric Fraction does not show emissions that are "too small" prior to 1850. You may have sight of other numbers which show it different and if so you do need to explain such 'other numbers' properly. (I note @34 you put the CO2 emissions for 1850 = 0.2Gt(CO2). This is presumably ignoring the LUC emissions which would increase the full 1850 emissions to 2.6Gt(CO2) using the Global Carbon Project numbers.)
It is also not clear what you are considering with this 1950s-2010s mismatch which you perceive between accelerating CO2 levels and steadily decreasing Delta C13 levels. If it is the OP's Fig 3 (& I don't see a problem there), perhaps a sight of the original may help as it shows the data points without the assumed solid δ13C trace.
wow censorship, great job Bob, I suppose your inability to see that I am having a different conversation with other people and explaining in more detail to that other person because they are asking for clarification doesnt matter for a child that cares more about his ego than for science comunication; contrary to you Bob, I care, so I dont repeat the same term multiple times instead of explaining like the other people that partake in the discussion
[BL] From the Comments Policy you clearly are not willing to follow:
MA Rodger,
[snip]
Fearing the abuse of power some people here want to exert and the complete arbitrarity of censorship I will have to keep it short and pray that Mister Bob is not angry enough at me.
LUC is a measure that requieres immense amounts of precise knowledge about human activity and the specific happenings in the carbon cycle during that year, something we completely lack in both departments, so I would not give it much accuracy
[BL] More moderation complaints deleted.
Please note that posting comments here at SkS is a privilege, not a right. This privilege can and will be rescinded if the posting individual continues to treat adherence to the Comments Policy as optional, rather than the mandatory condition of participating in this online forum.
Moderating this site is a tiresome chore, particularly when commentators repeatedly submit offensive or off-topic posts. We really appreciate people's cooperation in abiding by the Comments Policy, which is largely responsible for the quality of this site.
Finally, please understand that moderation policies are not open for discussion. If you find yourself incapable of abiding by these common set of rules that everyone else observes, then a change of venues is in the offing.
Please take the time to review the policy and ensure future comments are in full compliance with it. Thanks for your understanding and compliance in this matter.
MA Rodger,
At least for the pre-satellite period