


 Arguments


Taking the Temperature: a dispatch from the UK
Posted on 22 July 2022 by John Mason
Well, it has happened. Forty degrees Celsius. It was bound to happen eventually, given the lack of determined action to halt our rising temperatures worldwide. Those who insisted such a temperature was impossible here in the UK have been left with egg on their faces. It was not a case of if, but when.
The synoptic pattern, high pressure to our east and a cut-off low to our far south-west (and approaching us) is common enough in UK summers. What is less common is that a more-or-less direct pathway was made available to advect hot air up from North Africa, across Europe and on to the UK. This was an unusually well-preserved hot airmass; for example over southern England on 19th July, 850 hPa temperatures were as high as 24C. That morning, to the lee of the Cambrian Mountains of Wales, a low-level temperature inversion mixed-out in a turbulent SE breeze and at some weather-stations, temperatures climbed by 7C in the hour between 0500 and 0600 BST.
By the time that such phenomena were being observed, records had already fallen. On July 18th, Wales kicked things off to a flying start: the old record high temperature (35.2C, 1990) got blown out of the water with a reading of 37.1C. An unpleasantly hot night followed, both in Wales and England; in both cases the overnight highest minimum temperature record was shattered at 24.5C and 25.8C respectively. July 19th brought things to a grand finale with the UK temperature record (38.7C, 2019) falling across an extensive area from London up to Lincolnshire. RAF Coningsby clinched top marks in the end, with 40.3C. Scotland also got in on the action with its highest recorded temperature of 35.1C* and its highest overnight minimum of 23.9C.
* although the Wales and England record temperatures were verified by the UK Met Office, the 35.1C Scotland record failed that test: the second highest of 34.8C is however good and is still a record. JM 02:08:22
Wildfire accompanied the dry heat: the Mayor of London, Sadiq Khan, described the situation faced by fire-crews in London as the “busiest since the Second World War”. Homes, gardens, woods and heathland alike were consumed by the flames: the final count, according to Khan, was 41 houses gone.
Something of a wake-up call, yes? Probably, but for the continued efforts of the right-wing media. It's a strange beast, that. We have covered one of its tentacles, the Daily Express, on here before. The Express is fond of scaring its readers with headlines like, “100 days of Heavy Snow” every autumn; in fact you don't really need a calendar any more. You know October has arrived if the Express is running those snow-apocalypse stories. On this occasion, however, its tone was somewhat different:
We've also covered the Daily Mail and its climate change denial over many years, here for example. Like the Express, the Mail employs people who appear not to understand the science, to opine upon it. In the early hours of July 19th, an editorial written by one Stephen Robinson presented a lengthy diatribe against the UK's Met Office (who in fact did an excellent job of forecasting the heatwave and the distribution of the highest temperatures). Here's an example of Robinson's tone:
“Taxpayers are footing the bill for the Met Office to peddle this fatuous health and safety advice. It doesn’t matter whether any of these bodies has the jurisdiction or expertise to opine on these matters. They are tolerated and bankrolled for as long as they parrot the predicable woke line.”
Less than 24 hours later, records had been shattered and London was burning.
I've had to conclude after much consideration that, “woke”, no longer means, “socially aware” (a good thing) but instead means, “anything that a right-wing free marketeer dislikes”. Covid restrictions? WOKE! Science? WOKE!! Climate science? DOUBLE WOKE!! We're supposed after all to get trained-up, work hard, consume as much as possible and then die, like items on a conveyor-belt. Anything else is therefore woke. Sorry, WOKE!!
Several days in advance, the Met Office had issued a Red warning for the heat, justifiably. A Red is the highest level warning in the UK system and means life-threatening conditions. 40C without some form of relief like air-conditioning is dangerous: UK infrastructure is not designed to cope with such temperatures because when much of it was built, 40C seemed highly improbable. Places that see heat like that on a regular basis tend to design both infrastructure and ways of life around it. We haven't.
Running highly implausible cold weather stories whilst downplaying dangerous heat are just two spanners in the science misinformer's toolbox. A hi-visibility meme placed on social media - and accelerated towards infinity by a complicit army of robotic sharers - attempted to downplay the 2022 heatwave by comparing it with the prolonged hot and dry UK summer of 1976. Expanding on the theme, the post included a complaint that old forecast graphics did not have all those scary shades of red on them – indicating high temperatures. Apparently, they looked like BLOOD! Therefore, creating FEAR! Never mind that similar colour-scales have been used for almost as long as I've been alive (almost 60 years) in various ways. I've always understood that blue colours mean cold, red ones hot, since the first time, as a young boy, that I jumped into the deep blue sea on the UK coast on a hot day but only in early summer. Eek!
But let's do that data thing. The maximum recorded temperature in 1976 was at Cheltenham on July 3rd, when it reached 35.9C. That figure can be found in moments. In contrast, July 19th 2022 was more than 4C warmer – widely. When that 4C difference takes things above the human body temperature (~37C), it becomes serious if many of the population are not used to that.
These days though, when denialists try it on, the meteorological/climate community are ready for them: in this case, they counter-shared this rather neat graphic, tweeted by Ed Hawkins on June 20th and simply waiting for its moment:
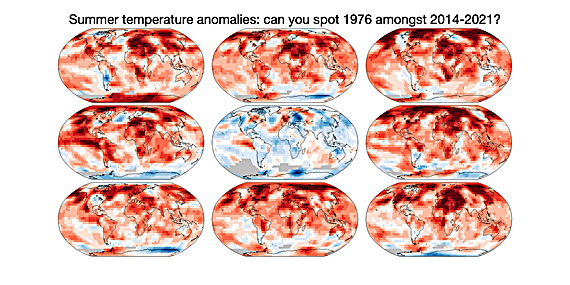
Data:HadCRUT5. Baseline 1961-1990. Graphic: Ed Hawkins.
Personally, I think the likes of the Mail and the Express should be ashamed of themselves and desist from publishing the anti-science nonsense. But that, they will argue, goes against freedom of speech. “Help! We are being CANCELLED by the WOKE!!!” Someone said on Twitter recently,
“Their readers do not care. They wait by the letterbox every day waiting to be told what to be angry about for the next 24 hours”.
That may be true to an extent, although it's probably unfair to the entire readership!
The thing is, in my view, with freedom there comes responsibility and feeding their readers with made-up nonsense definitely comes under irresponsible. Heat like that of the past two days IS dangerous, no ifs or buts. And we had better get used to it: thanks to those very same misinformers, the politicians and those who vote for them, who have together kicked the climate can down the road for too long. Further warming is now a given, even if we do reach net-zero by mid-Century. It needn't have been. But if anything counts as an incentive to act, the last two days here in the UK tick the box.


Fixitsan @42 (and other comments),
Thank you for accepting that averaging larger amounts of data provides a clearer indication of long-term trends like the impacts of increasing CO2 levels. That understanding leads to awareness that the surface temperature impact of increased CO2 in the atmosphere is best seen by the trend of the global 30-year moving average (the global version of the one for CET presented on the Wikipedia page I linked to @40). Also, the 30-year ‘global average’ is understandably the better indication of the trend than any regional 30-year average.
I have more to share regarding CO2 and temperatures. But the following will hopefully help explain the comments I will make.
We appear to agreed that many people appear to be uninterested in putting the effort into pursuing the most logical explanations for the ever increasing evidence of what is going on. Learning requires a willingness to change your mind based on ‘new information and evidence’. It can require giving up on developed (status quo) beliefs and actions (no matter how popular, profitable or enjoyable they are).
The following 6 minute BBC Reel item “The psychology behind conspiracy theories” is informative. Watch it. Think about it. Then watch it again. Then seriously consider the possibility that you are resisting learning for some reason(s).
When there is a lot of evidence, as there is regarding climate science (especially since the first IPCC Report in 1990), the understanding still improves as additional evidence is obtained. But the fundamental understanding developed by 1990 is very unlikely to change ‘statistically significantly’ due to new evidence. And the observations you make regarding CET are not ‘new evidence’ (btw, Why is your focus on anything other than what the CET 30-year average trend since 1990 indicates?)
Many other comments have been helpful (they really are), but I will only refer to a few of them.
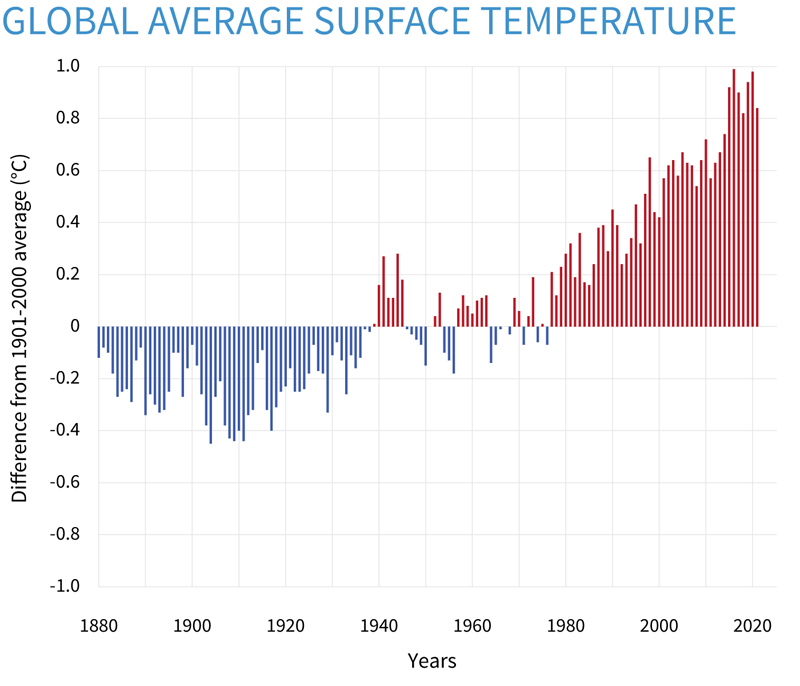
Bob Loblaw @47 provides a great overlay of the history of CO2 levels and global average surface temperature (GAST). But the 30-year moving average temperature line looks even more like the CO2 line.
You can use the SkS Temperature Trend Calculator to see the 30-year GAST trend for the GISS v4 (the temperature dataset Bob Loblaw used). Choose GISTEMPv4 and set the follow: Start date = 1880; End date = 2023; Moving average = 360 months (30 years). The GISTempv4 30-year moving average increases between 1920 and 1950, and after 1965 (note that there is no ‘levelling off’ in a 600-month moving average). What is happening in the CET is similar. But local conditions can be understood, and expected, to vary relative to the global trend. The term ‘vary’ leads to the next points.
Many variables affect the GAST. It isn’t just the CO2 levels. Increased CO2, primarily due to fossil fuel use, is known to be ‘the major factor’. However, additional variables affecting GAST are already well understood (with more being learned – because – well that’s science for you). They include:
In addition to variables affecting GAST, there are other factors affecting local climates including:
The AMOC is weakening due to Global Warming. That could mean cooler winters in the CET region even with increased Global Warming due primarily to increased CO2, due primarily to human activity (primarily fossil fuel use).
So ... it is not wrong to say “Increased CO2 = increased GAST”. All that needs to be understood is that CO2 due to fossil fuel use is only the primary part of the 'increasing GAST and resulting Climate Change' problem.
Closing with a brief bit about the future of the Maldives due to increasing GAST. Reviewing the Climate Central Map of “Land projected to be below annual flood level in 2050” (a detail you missed or misunderstood when commenting about bridges near Edinburgh) you can see that only ‘most of the Maldives’ will be expected to be annually flooded by 2050 (using the default settings). More of the Maldives would be annually submerged in subsequent decades. Mind you, with the default settings, even by 2100 there are still little bits of the Maldives above the annual flood level. A related understanding is that people playing marketplace games can make 'very bad bets'.
A related understanding is that people playing marketplace games can make 'very bad bets', like investing in fossil fuelled pursuits, or buying in the Maldives (like the unfortunate people on Kona, the Big Island, Hawaii who chose to buy property and live in areas that are now under lava).
Fixitsan @46
"I wasn't talking about flat period of global temperatures mid last century, but instead a flat temperature in the UK from 1910 and proceding into the 1990s, which is 70% - 80% of the last century,...."
Ok, but I was just trying to make the point there are almost certainly logical explanations for that long flat period. So for example the first link I posted discussed how different regions warm at different rates, - and would also have different timing of the warming. I havent looked at mid Englands climate history and what factors have driven it, but there is bound to be some local or regional factor or combination of factors that explains the unusually long flat period of temperatures, despite rising CO2. And obviously a large part of that flat period is explained by sulphate aerosols (from about 1945 - 1980).
I agree quoting that particular temperature record could get you labelled a denier. Not sure what the solution to that is other than to say I don't personally dwell on very local temperature records like that, because its incredibly obvious that in our complex climate system there will be a lot of local variation. I'm mostly just interested in the global average trend and whats happening where I live myself. Local variation doesnt bother me because anyone with more than half a brain knows that doesn't represent the global trend and there are dozens of plausible reasons consistent with an anthropogenic warming trend.
And I agree the media sometimes exaggerate climate change. What can you do about that? I've complained to my local media for both exaggerating certain things, and and playing down other climate issues. It's the second problem thats a bit more concerning.
Bob wrote
""And he returns to the CET temperature trend as if local variabilty disproves global trends.""
Actually if you had comprehended what it is about that record which is curious it is int's INVARIABILITY, and not it's variability, which is distractive
[BL] Your continued inability to engage in constructive dialog, and your continued efforts to distort anything you read have forced me to step out of the discussion and enter a moderation role.
"Variability" can be large or small. You are playing word games. Look at definition 2 on this page:
https://en.wiktionary.org/wiki/variability
MA Rodger
""you treat us to the bizarre idea that we should be able to use the house prices on the Maldives to measure AGW ""
No that is your own disingenuity regarding the economic certainty that if the Maldives were about to be abandioned then nobody would live there, the house prices would therefore be zero.
Is it actually true that you think an island on the brink of abandonment attracts serial investors and property sharks who pop up out of the water for no other purpose than tax avoidance ?
Are you in a place where houses which will soon be abandined have excellent values ?
We have lots of clifftop houses here which are worthless because they're about to fall into the sea due to longstanding coastal erosion, I just assumed nobody would be stupid enough to pretend to think a property on the brink of abandonment would hold any value in the proporty market, for the sake of trying to make a lousy point. But you did it !|
I don't know if you would pay for a worthless property or not now. perhaps you actually would !
But I think MOST investors, banks, economic deprtments of the Maldives, and even loan sharks would, quite sensibly steer people away from investing on things about to be washed into the sea.
Conclusion - the properties are safe, or the world has gone mad
[BL} Off-topic rambling about economics deleted.
BOB Loblaw
" grossly-inaccurate characterization that rising CO2 must cause constantly rising temperatures,"
Well for goodness sake Bob please tell Mr Mason above about this.
He said if only I had told him before about the Forth Bridge story before then this group of international conributors could have done something about it
Then why aren't you doing something about the rest of the articles in the media who portray global warming to mean that CO2 rises equal temperature rises.
Please get on to them and stop them from incorrectly making a connection between CO2 and temperature....I mean fo CO2 doesn't cause the temperature rise than that's a different matter entirely but i don't think any undergradute who wrote in a report ' CO2 rises produce temperature rises' would be marked down for doing so.
[BL} Mr. Mason can speak and read for himself. You are playing games. This site is about the science, not the media. Off topic snipped (warning).
BOB Loblaw
rn
" grossly-inaccurate characterization that rising CO2 must cause constantly rising temperatures,"
rn
Well for goodness sake Bob please tell Mr Mason above about this.
rn
He said if only I had told him before about the Forth Bridge story before then this group of international conributors could have done something about it
rn
Then why aren't you doing something about the rest of the articles in the media who portray global warming to mean that CO2 rises equal temperature rises.
rn
Please get on to them and stop them from incorrectly making a connection between CO2 and temperature....I mean fo CO2 doesn't cause the temperature rise than that's a different matter entirely but i don't think any undergradute who wrote in a report ' CO2 rises produce temperature rises' would be marked down for doing so.
[BL] Duplicate post contents deleted.
One Planet
Thank you for explaining a short term datapoint is not indicitive of a long term trend
Perhaps a reply from you to the original poster of the #1 message to that effect ought to be posted, as the poster has asserted that 40 degrees, once, for a brief period, is proof of global warming !
[BL] Bogus claim about what others have said deleted.
Still flogging the same horse I see.....
High temperature records being broken time and time again all over the world are very strong evidence for global warming and the role of greenhouse gases in that process is something we have known about since the 19th century. Sarcasm does not change the laws of physics!
Why does the CET show that all mean low temperatures are not recent ?
Surely warming would increase the average low temperatures too, or else we're only talking about increasing peak highs, which is not the same as a general warming trend
[BL] You are literally arguing with yourself. First, you use the term "all" with reference to a local/regional example, and then you clam that this relates to some characteristic of "a general warming trend".
Your back and forth between local, regional, and global, and your repeated failure to be consistent in your interpretation, is turning your posts into incoherent rambling.
John Mason
How come the same temperature record you're discussing with me shows that Lowest maximums aren't rising like highest maximums are
This suggests that global warming doesn't affect lower temepratures.
Would you say that that makes sense ?
[BL} Repetition deleted.
In the same way that "the blob" south of Greeland does not. The Arctic is one of the fastest-warming places on Earth and the blob does not disquality that statement.
This is all I need, plus the other answers above that patiently explain why the whole world is not warming at the sme pace. Data: NOAA.
John Mason
No curiosity embedded in you at all then ?
Maximum highs are rising
Maximum lows are not
Lets hope next years maximum temperature is a normal maximum low.
The maximum highs might be hotter, but the maximum lows are not, adn there is no certainty that next year will be one of the maximum high year instead of a normal one
[BL] Repetition deleted.
Please take the time to review the Comments Policy and ensure future comments are in full compliance with it. Thanks for your understanding and compliance in this matter.
Fixitsan @63,
I fear you are getting carried away with all this. While not exactly representitive of "maximum low" records, the record for such CET values for 1st Jan was set 2022 and for 31st Dec 2021 and most maximum monthly low averages are also recent.
CET RECORD HIGH NIGHT-TIME TEMP - Jan 1921, Feb 1903, Mar 1957, Apr 2011, May 1889, Jun 2017, Jul 2006, Aug 1997, Sep 2006, Oct 2001, Nov 1994, Dec 2015, Annual 2006
John Masons' post @3 shows that the all time high low at night was set during this heat wave. Everyone informed knows that nights are warming faster than days and that the warmth is statistically confirmed. Fixitsan is just making things up.
Fixitsan: provide a link that shows data that the low temperature at night is not increasing.
[BL] Should Fixitsan wish to restore any credibility, he should provide such an analysis. Since his most recent claim (#59) references CET, he should focus on that.
For what it is worth, there are links in the comments to this blog post that will lead to the Met Office's daily CET data from 1878 to present.
Spoiler alert: the daily minimum temperature from 1878 to today results in a linear trend of 0.78C per century. If you look at just the last 50 years, it is over 2C per century.
michael sweet @65,
To make plain the Moderator comment, @3 the record high night-time temperature of +25.8ºC is a HadUK value set 19/7/22. The +18.9ºC for 19/7/22 in HadCET was the second highest HadCET night-time temperature with the record +19.5ºC being set 20/7/16. And as this all suggests, there have been more recent record high night-time CET temperatures than have survived from earlier decades.
2003-22 - 104
1983-02 - 62
1963-82 - 33
1943-62 - 55
1923-42 - 50
1903-22 - 26
1878-02 - 23
I made it5 clear in my first response that I was aware of a difference between local and regional and global terminologies
I was accused of not being aware of those differences several times by what must be assumed to be people who had not read the first post I made on this topic.
Which, is pretty frustrating, and further frustration is felt by other posters then sayying I did not accept a difference in those terms when clearly I had.
Look at it from my point of view, it appears there is deliberate twisting and deliberate misunderstanding of what I wrote for what I assume are just personal humour reasons.
You might as well have just said "Stupid denier" and be done with it.
What is it about a lack of sea level rise which makes it so obectionable in a discussion about climate change ona climate change website to make moderaters call it off topic.
Until climate change came along sea level rise was just a normal fact of life, before it became something that has been given a new name as if it is a new phenomenon.
I leave to play your games, I'm more than capable of a broad discussion and tolerate a lot of topic deviation because that is what happens during the turn of conversation in real life.
You don't want to talk about a lack of sea level rise of a rate which is considered to be a worldwide threat, yet would allow to be published anything which claims sea level rise is not normal at all, and the current rate is scarily high compared to the past, when it isn't.
[BL] Accusations of dishonesty deleted. Derogatory attacks deleted.
Off-topic and erroneous claims about sea level deleted.
Please note that posting comments here at SkS is a privilege, not a right. This privilege can be rescinded if the posting individual treats adherence to the Comments Policy as optional, rather than the mandatory condition of participating in this online forum.
Please take the time to review the policy and ensure future comments are in full compliance with it. Thanks for your understanding and compliance in this matter.
Fixitsan @67 , your return to this forum will be most welcome, if you choose to come with some well-reasoned arguments. Arguments which are scientific and Forth-right, rather than merely rhetorical.
Meanwhile, may I commend for you the specialist blog: "WUWT". That blog hosts a large number of denizens who delight in all sorts of motivated reasoning and deficiencies in self-awareness. Quite entertaining, to see how the WattsUpWithThat-ites fail to grasp science and fail to look at the Elephant In The Room. Indeed, a very recent article by a Mr Kip is chock-full of uninsightful wordiness. . . . about numbers ;-)
[BL] Off-topic deleted.
Fixitsan,
In post 67 you say:
"I made it5 clear in my first response that I was aware of a difference between local and regional and global terminologies"
Then you refer to your claim that the sea level is not rising in the Maldives. We are not talking about a single location when we discuss sea level rise, we are talking about Global Sea level Rise. When you describe sea level rise at a single location and then claim that global sea level rise is not a problem it appears that you do not understand the difference between the Maldives and the entire world.
Fortunately Tamino has done an article on Global Sea level Rise (that is the average sea level rise for the entire globe, not just the Maldives).
We see that the global sea level rise is about 200 mm from 1900 to 2020. The current rate of Global sea level rise is 5 mm/yr. From year 0 (zero) to year 2000 we know that sea level rise was about zero siince Roman ports on the Med sea are still usable (as are major ports all around the world). If sea level rise was even 1 mm/yr that would have been 2 meters of sea level rise over a 2000 year period.
I look forward to your link to a site that shows current Global Sea level rise is comparable to the rise from 0 to 2000 CE.
I note that sea level rise is accelerating. According to Tamino, before 2010 the sea level rise rate was less than 4 mm/yr.
Where I live in Florida, Tamino shows that the current rate of sea level rise is 11 mm/yr. That is "scarily high". 21 million people live in Florida. Real estate in Florida near the ocean is increasing in value at a slower rate than inland since sunny day flooding is already a problem in most of the state near the ocean.
I hesitate to dip my toe in this evidently warm water, since things seem to have wandered a long way away from the recent UK heat wave!
However having been blogging about the UKMO forecasts since July 10th I can report that here in North Cornwall outside temperatures peaked at a record 36 ºC in Bude and inside temperatures reached 32 ºC in my home office on the edge of Bodmin Moor.
Here's a Carbon Brief explainer about those forecasts which may be of interest?
https://www.carbonbrief.org/analysis-how-the-uks-insane-40c-heat-was-forecast-weeks-in-advance/
The article quotes Dr. Simon Lee, who more recently has been taking the Express to task for misrepresenting his work. Believe it or not allegedly "Strange Pacific events to trigger MONTH of heatwaves as 40C hits"!
https://twitter.com/SimonLeeWx/status/1552060364300455936
You're welcome, Jim.
I heard today that the Coningsby 40.3C reading has passed the UKMO ratification procedure, BTW.
Thanks for the heads up John.
Ditto for the new record in Wales. The UKMO announcement:
https://www.metoffice.gov.uk/about-us/press-office/news/weather-and-climate/2022/record-high-temperatures-verified
Some pertinent news from the BBC this morning (BST):
https://www.bbc.co.uk/news/uk-62323048
etc.
Disturbing but unsurprising, Jim. There can be few things harder to cope with than buying wholeheartedly into a myth (climate change denialism, brexit, trump etc) then witnessing its disintegration.
It seems that John Kennedy, who recently left UKMO, isn't entirely happy with the MSM coverage of the "this month's extreme heat in the UK" either:
https://twitter.com/micefearboggis/status/1552888125562781697
There’s an attribution of the record breaking UK heat but of the three articles I read (Guardian, AP, Carbon Briefs), not one linked to the actual study. I can’t even find a link to it on the WWA web site, just a summary.
Here's the missing link to the World Weather Attribution study that Robert Rohde dug up:
https://www.worldweatherattribution.org/wp-content/uploads/UK-heat-scientific-report.pdf
[BW - comment updated per request]
Michael Sweet
Regarding see level rise you assert is 5mm/year.
NASA today reports 3.4mm/yr
What is a layperson supposed to think is the rate of sea level rise ?
Where did your 5mm/year come from and why is it about a third higher than the rate NASA says ?
It's very interesting that if someone who for want of better expression is known as a 'denier' disagrees with NASA they're called fools, yet right off the bat you're ignoring NASA ?
Breathtaking stuff, really.
Regarding Floridian rates of rise, easily explained by excessive groundwater removal. Of course someone clever might have found a way to rewrite that part too, but yet we can't say groundwater extraction has had zero effect at all, because it almost always does affect land level.
Reporters and commentators on this matter often find themselves satisfied in terms of quoting fearsome sea level rise by turnign tot he Pacific ring of fire, because the sea bed is rising and falling in accodance with underground volcanic activity.
In fact it is extremely difficult to measure not only sea level, but sea level rise, because what we're actually talking abotu with sea level rise is sea volume increase. It would be better if science would standardise on that, and explain why the changes in earths gravity field are changing sea levels in various regions.
I note in your message you not only say that today the sea level rate of rise is 5mm, you quotte another person who says it exceeded 4mm/year by 2010 (Tomino quote)
Back to NASA, sea level rise is 3.4mm/yr
Why are you bouncing about on different sources, quoting 3 different rates of rise I wonder ?
Could it be because you can't actually decide which data source is reliable either ?
Is NASA wrong
[BL] From the Comments Policy, which you either have not read, have not understood, or refuse to follow:
Please note that posting comments here at SkS is a privilege, not a right. This privilege can and will be rescinded if the posting individual continues to treat adherence to the Comments Policy as optional, rather than the mandatory condition of participating in this online forum.
Moderating this site is a tiresome chore, particularly when commentators repeatedly submit offensive or off-topic posts. We really appreciate people's cooperation in abiding by the Comments Policy, which is largely responsible for the quality of this site.
Finally, please understand that moderation policies are not open for discussion. If you find yourself incapable of abiding by these common set of rules that everyone else observes, then a change of venues is in the offing.
Please take the time to review the policy and ensure future comments are in full compliance with it. Thanks for your understanding and compliance in this matter.
Jim Hunt, if the temperature in one month is outside 'normal' parameters you get to say it is abnormal.
If I point out previous one day temperature highs or lows I'm called a denier and taken to task for only choosing one particular day with a follow up insult of being a data cherry picker.
You can argue the CET covers just one region of the planet, as indeed I have acknowledged myself, but can the area covered by CET which showed no overall warming for 70% of 1900-2000 be easily rejected on the grounds that it only covers one region.
I understand the basics of weather patterns and I know weathermen struggle to predict further ahead than three days, in our climate. If it was Saudi Arabia things might be different but the UK is in a very dynamic part of the world makign weather unpredictable.
This large variability suggests to me that we will see a fair share of lots of different active weather patterns as they pass over us and to that end it seems unreasonable to suggest that the UK is in a bubble and is less likely to experience the ffects of global variability. The importance of this fact is that it suggests we get a fair share of the effects of global climate change.
Therefore we get a lot of the effects of global climate change, influencing the CET long term average which began to be recorded in 1659. So why, if CET represents it's fair share of the effects of climate change, do we dismiss it on the grounds that it is one location, when it holds the records of hundreds of years.
I find it so unlilkely to believe that a place on the planet which shows no net warming for 70% of 1900-2000 can be easily dismissed on one hand because it is just a small region, yet is included in virtually every climate because of it's reliability. It can't cut both ways, or can it ?
[BL] Assertions must be supported by evidence. You have been requested to actually show analysis of the CET temperatures, not just hand-waving. You are simply repeating previous assertions without providing any actual analysis.
More from the Comments Policy:
Fixitsan @76,
You blather is entirely off-topic but if you were to examine the comment of michael sweet @69, you may perhaps see where the value of 5mm/year for global SLR is sourced. And you will possibly then note that the data used is from tidal gauges which measure the sea level round the coasts while the NASA data is satellite data that measures the level of the entire ocean. You may wish to consider which measure is more important for humanity.
The method of calculating SLR is also different.
But if you have anything sensible to say on this subject of SLR, I would suggest a different SkS thread, perhaps this one -'How much is sea level rising?'
Fixitsan@77 - I heartily recommend that you read the attribution study I linked to @75 from cover to cover.
After that there are also numerous references the document links to.
I also feel compelled to point out that John's original post makes no mention of SLR. See also MAR@78.
Getting back on the topic of UK "heat waves", the GEFS mid range forecast for sunny South West England is heating up again:
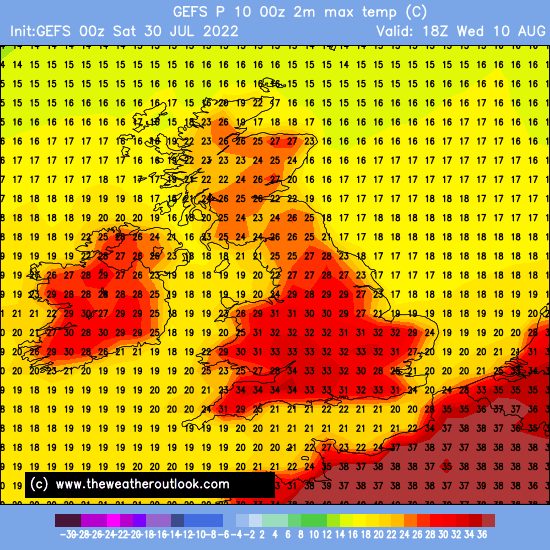
https://Davidstow.info/2022/07/drought-for-cornwall-later-in-2022/#comment-2627
This is one of the more extreme ensemble members:
Fixitsan,
You need to read my last post at 69. Most of your questions are answered in my post. If you read the linked posts by Tamino that would answer the rest of your questions. It is not my problem that you do not do your homework.
The reason that Tamino's sea level rise rate is differrent than NASA is because Tamino uses a 10 year average and NASA uses a 30 year average. Simply looking at the graph in post 69 it is obvious that sea level rise is accelerating. Therefor a 30 year average underestimates current sea level rise.
The data I referenced only considers sea level rise, ground water extraction is a separate issue more important in other areas. Florida gets so much rain that ground water extraction is not an issue here.
All the rates that I quoted are from Tamino who is a professional statistician who specializes in time series analysis like looking at sea level rise. Your suggestion that I used three different sources is simply false.
Sea level rise is different in different places, as you have been told repeatedly on this thread. You claim that sea level rise is zero in the Maldives. I state that sea level rise is 11 mm.year in Florida. Since I live in Florida, along with 21 million other Americans, I care more about sea level rise in Florida. It turns out that sea level rise now and in the future on the US East coast will exceed the global average by a lot.
You are certainly well informed about deniers claims that sea level rise will not be too bad. Unfortunately, sunny day flooding has become a big ptoblem on the entire East coast of the USA. It is particularly bad in flat areas like Florida.
[BL] Note that Fixitsan's most recent ramblings on sea level have largely been snipped from his comment. This will continue until Fixitsan takes the time to find one of several sea level posts here at SkS where the discussion will not be a violation of the comments policy. MA Rodger has suggested one.
This post will be left as-is, because it contains general advice that Fixitsan needs to follow: read the responses to his comments, read the links presented (where he can obtain additional information), and stop repeating claims that others have debunked with actual analysis.
Initial figures are in on the estimated excess deaths in England and Wales on July 17-19 2022. 948 people (844 of them on July 18-19) according to a London School of Hygiene & Tropical Medicine researcher. The work is summarised in New Scientist. See:
https://www.newscientist.com/article/2331349-40c-heatwave-may-have-killed-1000-people-in-england-and-wales/
To recap (a term used by fixitsan @2).
Fixitsan @67 claims “I made it5 clear in my first response that I was aware of a difference between local and regional and global terminologies”.
Their responses have clearly indicated something, but not what they hope to indicate.
Fixitsan @2 ends with the following para. I provide a response to each part in brackets:
So to recap, lets recall the amount of serious messaging about climate change which probably dates back to 1989, when Mrs Thatcher addressed the UN and stressed the importance of a worldwide commitment to reducing CO2 [Many global leaders spoke more strongly on the issue and did it years before Thatcher did. They had been learning since the 1972 Stockholm Conference which led to the 1987 Montreal Protocol about Ozone and formed the IPCC which issued its first report in 1990].
Anything since then is a year in an era when it has been fine to suggest we might only have ten years left to live, or only a few days left before doomsday due to climate change, [The correct understanding based on increased awareness and improved understanding since 1990 is undeniable. Avoiding the creation of significant harm to the future of humanity requires dramatic reduction of fossil fuel use by 2030. Many other dramatic corrections of harmful ways of living developed by humans are also required]
and recall how most of the CO2 was produced before 1989, [wrong, and shown to be wrong by other comments]
so how come that of the 12 months in every year, only 5 of those months have been hottest since 1989, [wrong – and proven by subsequent comments to be an incorrect claim, a gross misunderstanding about the meaning of bits of data found in the record of temperature in a small part of the planet. A ‘hottest date does not make a ‘hottest month’, or a ‘hottest year’. And finding a ‘hottest ’ in a region of the planet does not indicate a hottest global condition]
and 2 were hottest before the start of the industrial revolution (which apparently causes global warming, except not in April or May) [repeatedly proven to be a grossly incorrect way to think about the issue]
Further early evidence of fixitsan’s incorrect understanding is provided by fixitsan @8: ”Be honest you don't know if it was hotter 20 years ago in a place where there was no thermometer. Statictiscally possibl;e, as thermometers are located on such a small amount of area of the UK” [Nonsense belief that some actually collected temperature information indicates nothing meaningful ‘because everything hasn’t been measured rigorously everywhere all the time’. That nonsense appears to be the reason they refuse to learn about Sea Level rise or any other matter they do not want to learn about.]
That type of nonsensical thinking can be understood to be related to conspiracy type thinking - thinking that will not be a sustainable 'common sense' in any sub-set of humanity unless the subset is permanently isolated for all others. Review the following brief (about 6 minutes each) BBC Reel videos (I referred to the first one in my comment @51:
And that awareness and understanding makes sense of the success of the efforts to mislead people about climate science I refer to in my comment @39 pointing to my comment on the Skeptical Science New Research for Week #29 2022.
My comment on New Research for Week #29 links to The following BBC News item:
The audacious PR plot that seeded doubt about climate change
That BBC story includes the following concise summary point:
"What the geniuses of the PR firms who work for these big fossil fuel companies know is that truth has nothing to do with who wins the argument. If you say something enough times, people will begin to believe it."
A concluding Note:
It appears likely that the massive efforts to mislead regarding climate science were a response to the way that global leaders collectively agreed to meddle in the marketplace to limit the harm done to the Ozone layer. That type of global leadership effort appeared to be working towards a similar action on climate impacts, which would focus of ending fossil fuel impacts – and some harmful misleading people believed that that ‘helpful harm reduction action’ had to be delayed any way that could be gotten away with.
People like fixitsan appear to have allowed themselves to be so deeply misled into conspiracy belief that they cannot easily be helped to learn what is really going on and what needs to happen to limit the harm being done.
[BL} Please let's stop rehashing Fixitsan's earlier posts. Until he has something new to say (that will be on topic and survive application of the Comments Policy), let's all try to end this circular discussion.
For what it is worth, there is an example on Tamino's blog of what it is like when someone posts a comment that actually includes analysis, rather than just hand-waving.
Tamino's post on the recent UK heat wave has already been mentioned here in this thread:
...and yesterday a participant using the name bindidon posted a comment with links to two graphs that examine the frequency of record highs or lows for the last 125 years. One is for continental US stations:
and an equivalent one for global temperatures.
Bindidon states that he's been trying to get the data for the CET record, but has not yet succeeded.
The two graphs for US and global records clearly show that record cold events used to happen as frequently as (or more frequently than) record warm events, but now they are much less frequent. Exactly what is expected in a warming world.
...and showing that occasional record cold events can still happen, and are not evidence that climate science has failed. Analysis of extremes needs to be done properly - not by hand waving.
And Tamino has a post today that also shows how hand waving assertions of "no trend in [insert choice] temperature" are debunked by proper analysis. In this case, it is Seattle summer maximum temperature, but it is of interest in this thread because it illustrates how to do things properly.
https://tamino.wordpress.com/2022/07/31/not-even-wrong-2/
MA Rodger,regarding tide guages, the tide guages around the UK show some decline in sea level rise.
One guage measuring the Thames estuary shows a decline, several Scottish ones too.
We're back to the topic of local evaluations not being representative of global trends I guess.
'Bendy sea'
[BL] Off-topic deleted
Bob...
""Bindidon states that he's been trying to get the data for the CET record, but has not yet succeeded.""
CET data can be downloaded by the public can it not ?
I recall several occassions in the past decade I have downloaded it, has it been taken offline ?
[BL] Clear evidence that Fixitsan has not actually bothered to follow a link and read what it says.
ONE PLANET
"Thank you for accepting that averaging larger amounts of data provides a clearer indication of long-term trends like the impacts of increasing CO2 levels.""
That is a deliberate misrepresentation of my words. I did not indicate any relationship between temperature and CO2 levels at all
[BL] More from the Comments Policy that you are so eager to ignore:
No accusations of deception. Any accusations of deception, fraud, dishonesty or corruption will be deleted. This applies to both sides. You may critique a person's methods but not their motives.
Michael Sweet.
Coarse sea level rise since the start of the ice age melt, approx 20,000 years.
https://external-content.duckduckgo.com/iu/?u=https%3A%2F%2Ftse1.mm.bing.net%2Fth%3Fid%3DOIP.nUK9Ty2xjWQgiVLRcDeFngHaE9%26pid%3DApi&f=1
Alternatively
https://kartverket.no/contentassets/ed899aa3266245028d9e9b502ba5930b/global-sea-level-change-past-20000-years.jpg?width=1104&height=621&quality=85&mode=crop&scale=both
If these are at all disagreeable please feel free to post a corrected version
Clearly, sea level is not changing around a middling value, it has only really risen continuously, for 20,000 years and therefore I feel safe in my position to say sea level decline is probably impossible given the massivity of the system and almost uncountable variables which affect it which currently trend upwards in their output effects.
My issue, again probably focussed more towards the media misreporting, which few climate scientists seem to contest, centres around the lack of context of reporting of sea level rise as a distinct topic, but instead it is bundled into one topic of climate change.
If more people were more aware that sea level rise is 'normal', as opposed to sea level decline or even sea level stability, then much fear could be taken out of the subject and less anxiety induced in young and influential minds who sometimes feel the need to take their own lives due to feelings of hopelessness about the future of the planet.
Sea level rise is undeniably normal, it is all we have really seen for 20,000 years, only the rate has varied over that time and the current rate is much less than it was previously
[BL] Off-topic deleted.
For future reference, the Ed Hawkins graphic in the post uses HadCRUT5 data with the baseline being 1960-1990.
Curiouser and curiouser, Fixitsan @89. While I appreciate your desire to emulate the White Queen in believing six impossible climate things before breakfast ~ I do confess to being intrigued by your statement that "sea level rise is undeniably normal". Mr Milankovitch and his cycle would suggest (strongly) that the planet is in its natural cooling stage for about the last 4,000 years (minus the last couple of centuries of AGW, of course).
So why would the sea level be rising recently, without cause? Or do you define AGW as "normal" ? (With another five impossible things yet to be enumerated by you.)
[BL] Off-topic deleted.
Fixitsan @87,
I respond on a thread where SLR is not off-topic.
Fixitsan@87
Gotta link to the CET data you recall downloading? Remember the bit about "individual time series of all UK stations contributing to CET".
And please take the SLR "debate" elsewhere.
[BL] The link to the processed CET time series has been provided previously within this thread. The phrase "individual time series of all UK stations contributing to CET". is only visible to people that actually follow the link given in comment #84, and read the original. It's the second sentence in that comment, though, so a reader has to have the patience/willingness to read past the first line.
Mod @93 - Sorry, my bad.
I'll try to avoid clicking helpful links in future!
fixitsan's comment @88 included the following enlightening bit: "I did not indicate any relationship between temperature and CO2 levels at all" That appears to indicate a powerful 'need' to deny that there is any relationship between increasing CO2 levels and global average surface temperature (and the related harmful regional/local impacts).
The relationship between temperature and CO2, and harmful consequences, is fairly obvious today. It was pretty clear in the rigorous evaluation of evidence at the time of the 1990 IPCC report. And it has become increasingly obvious since then.
The CO2-temperature relationship was particularly well displayed by the image in Bob Loblaw's comment @47 (which I referred to in my comment @51 that opens with the bit that fixitsan chose to take exception to @88).
Not that it will actually come to pass, but in recent related news:
For the first time in history, a deterministic model simulates 40 degrees over Denmark.
https://twitter.com/SebastianTV2dk/status/1554360935246094336
""The relationship between temperature and CO2, and harmful consequences, is fairly obvious today"
I struggle to find anyone who can offer a sensible explanation why it is, that if 0.04% of the atmosphere consisting of CO2 traps significant heat, enough to warm the planet an estimated 1 Celsius in 1 century, why is CO2 at higher concentrations not used more often (or even ever) in common or garden insulation.
Could somebody explain the science about why we choose to fill double glazing cavities with argon, which has worse thermal conductivity and costs more than, CO2, when a change in concentration from 0.03% to 0.04% is considered to be significant.
Surely if we were to extrapolate further and suggest atmospheric CO2 were 0.1% then the theory holds the planet will be warmed much more than in the past during the period when the level rose from 0.03% to 0.04%, so I just wonder why, if CO2 is such a powerful heat trapping gas, it is not used anywhere at all in any way which makes use of that arguably excellent thermal property ?
The only time CO2 seems to have any ability to trap heat is in the upper atmosphere apparently, so why is that, specifically ?
[BL] Off-topic deleted.
Please note that posting comments here at SkS is a privilege, not a right. This privilege can and will be rescinded if the posting individual continues to treat adherence to the Comments Policy as optional, rather than the mandatory condition of participating in this online forum.
Moderating this site is a tiresome chore, particularly when commentators repeatedly submit offensive, off-topic posts or intentionally misleading comments and graphics or simply make things up. We really appreciate people's cooperation in abiding by the Comments Policy, which is largely responsible for the quality of this site.
Finally, please understand that moderation policies are not open for discussion. If you find yourself incapable of abiding by these common set of rules that everyone else observes, then a change of venues is in the offing.
Please take the time to review the policy and ensure future comments are in full compliance with it. Thanks for your understanding and compliance in this matter, as no further warnings shall be given.
Fixitsan @97,
I have replied to you off-topic comment on a more appropriate trhead.
[BL] Please note that since moderation has been applied to Fixitsan's comment (to delete off-topic portions), regular readers can no longer see what he wrote.