


 Arguments


Taking the Temperature: a dispatch from the UK
Posted on 22 July 2022 by John Mason
Well, it has happened. Forty degrees Celsius. It was bound to happen eventually, given the lack of determined action to halt our rising temperatures worldwide. Those who insisted such a temperature was impossible here in the UK have been left with egg on their faces. It was not a case of if, but when.
The synoptic pattern, high pressure to our east and a cut-off low to our far south-west (and approaching us) is common enough in UK summers. What is less common is that a more-or-less direct pathway was made available to advect hot air up from North Africa, across Europe and on to the UK. This was an unusually well-preserved hot airmass; for example over southern England on 19th July, 850 hPa temperatures were as high as 24C. That morning, to the lee of the Cambrian Mountains of Wales, a low-level temperature inversion mixed-out in a turbulent SE breeze and at some weather-stations, temperatures climbed by 7C in the hour between 0500 and 0600 BST.
By the time that such phenomena were being observed, records had already fallen. On July 18th, Wales kicked things off to a flying start: the old record high temperature (35.2C, 1990) got blown out of the water with a reading of 37.1C. An unpleasantly hot night followed, both in Wales and England; in both cases the overnight highest minimum temperature record was shattered at 24.5C and 25.8C respectively. July 19th brought things to a grand finale with the UK temperature record (38.7C, 2019) falling across an extensive area from London up to Lincolnshire. RAF Coningsby clinched top marks in the end, with 40.3C. Scotland also got in on the action with its highest recorded temperature of 35.1C* and its highest overnight minimum of 23.9C.
* although the Wales and England record temperatures were verified by the UK Met Office, the 35.1C Scotland record failed that test: the second highest of 34.8C is however good and is still a record. JM 02:08:22
Wildfire accompanied the dry heat: the Mayor of London, Sadiq Khan, described the situation faced by fire-crews in London as the “busiest since the Second World War”. Homes, gardens, woods and heathland alike were consumed by the flames: the final count, according to Khan, was 41 houses gone.
Something of a wake-up call, yes? Probably, but for the continued efforts of the right-wing media. It's a strange beast, that. We have covered one of its tentacles, the Daily Express, on here before. The Express is fond of scaring its readers with headlines like, “100 days of Heavy Snow” every autumn; in fact you don't really need a calendar any more. You know October has arrived if the Express is running those snow-apocalypse stories. On this occasion, however, its tone was somewhat different: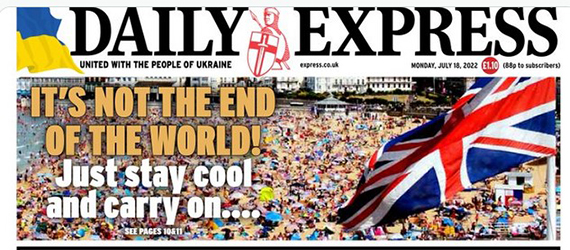
We've also covered the Daily Mail and its climate change denial over many years, here for example. Like the Express, the Mail employs people who appear not to understand the science, to opine upon it. In the early hours of July 19th, an editorial written by one Stephen Robinson presented a lengthy diatribe against the UK's Met Office (who in fact did an excellent job of forecasting the heatwave and the distribution of the highest temperatures). Here's an example of Robinson's tone:
“Taxpayers are footing the bill for the Met Office to peddle this fatuous health and safety advice. It doesn’t matter whether any of these bodies has the jurisdiction or expertise to opine on these matters. They are tolerated and bankrolled for as long as they parrot the predicable woke line.”
Less than 24 hours later, records had been shattered and London was burning.
I've had to conclude after much consideration that, “woke”, no longer means, “socially aware” (a good thing) but instead means, “anything that a right-wing free marketeer dislikes”. Covid restrictions? WOKE! Science? WOKE!! Climate science? DOUBLE WOKE!! We're supposed after all to get trained-up, work hard, consume as much as possible and then die, like items on a conveyor-belt. Anything else is therefore woke. Sorry, WOKE!!
Several days in advance, the Met Office had issued a Red warning for the heat, justifiably. A Red is the highest level warning in the UK system and means life-threatening conditions. 40C without some form of relief like air-conditioning is dangerous: UK infrastructure is not designed to cope with such temperatures because when much of it was built, 40C seemed highly improbable. Places that see heat like that on a regular basis tend to design both infrastructure and ways of life around it. We haven't.
Running highly implausible cold weather stories whilst downplaying dangerous heat are just two spanners in the science misinformer's toolbox. A hi-visibility meme placed on social media - and accelerated towards infinity by a complicit army of robotic sharers - attempted to downplay the 2022 heatwave by comparing it with the prolonged hot and dry UK summer of 1976. Expanding on the theme, the post included a complaint that old forecast graphics did not have all those scary shades of red on them – indicating high temperatures. Apparently, they looked like BLOOD! Therefore, creating FEAR! Never mind that similar colour-scales have been used for almost as long as I've been alive (almost 60 years) in various ways. I've always understood that blue colours mean cold, red ones hot, since the first time, as a young boy, that I jumped into the deep blue sea on the UK coast on a hot day but only in early summer. Eek!
But let's do that data thing. The maximum recorded temperature in 1976 was at Cheltenham on July 3rd, when it reached 35.9C. That figure can be found in moments. In contrast, July 19th 2022 was more than 4C warmer – widely. When that 4C difference takes things above the human body temperature (~37C), it becomes serious if many of the population are not used to that.
These days though, when denialists try it on, the meteorological/climate community are ready for them: in this case, they counter-shared this rather neat graphic, tweeted by Ed Hawkins on June 20th and simply waiting for its moment:
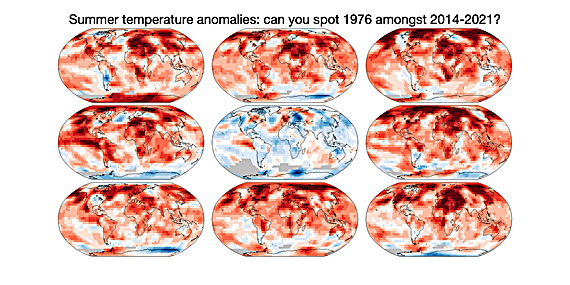
Data:HadCRUT5. Baseline 1961-1990. Graphic: Ed Hawkins.
Personally, I think the likes of the Mail and the Express should be ashamed of themselves and desist from publishing the anti-science nonsense. But that, they will argue, goes against freedom of speech. “Help! We are being CANCELLED by the WOKE!!!” Someone said on Twitter recently,
“Their readers do not care. They wait by the letterbox every day waiting to be told what to be angry about for the next 24 hours”.
That may be true to an extent, although it's probably unfair to the entire readership!
The thing is, in my view, with freedom there comes responsibility and feeding their readers with made-up nonsense definitely comes under irresponsible. Heat like that of the past two days IS dangerous, no ifs or buts. And we had better get used to it: thanks to those very same misinformers, the politicians and those who vote for them, who have together kicked the climate can down the road for too long. Further warming is now a given, even if we do reach net-zero by mid-Century. It needn't have been. But if anything counts as an incentive to act, the last two days here in the UK tick the box.


"Can you spot 1976 amongst 2014-2021?"
Oh, I know! I know! Pick me! Pick me!
Could it be.... the one in the middle?
It's like watching an episode of Sesame Street:
As a UK resident I have a vested interest in the situation we just experienced, although, being located 15 miles of Edinburgh I note that the rain we had on the hottest day of the year stood no chance of being reported as anything unusual, given the hysteria bias trending towards bad news selling better than good.
I awoke today to an outside temperature of 13 Celsius, so that was summer then, eh ?
The strength of reporting on local temperature highs always seems to be given more importance then another useful metric, the national average temperature.
Perhaps it goes without saying that nobody would be surprised to hear that on the 19th July 2022, when we saw our national record peak temperature occur (37.3 recorded by the Met Office, which does not include RAF airports as data sources) , we also saw a new record in the national average temperature being broken, at 28.1Celsius (for the whole of the UK covered by the national temperature monitoring service)
This all relates to the recording of temperatures by the Met Office at Hadley Centre, who maintain the worlds longest running instrumental temperature record which began in 1659, known as the Central England Temperature record, CET, meticulously maintained by them, and data from which is at the core of many climate models.
So it was a record July for both peak and average temperatures. Regardless of whether you include an RAf station or not. Fair enough
Of course the data is still only temporally corelated to reality. Nobody knows for sure if last year we had the hottest peak temperature on record occuring between two measuring stations, hence why a high peak recorded temperature isn't quite as reliable as the national average, (although the press certainly seem to think there is more newsworthiness and therefore £'s creation potential in scary news about high peaks, disregarding averages in the process)
Therefore, sticking with national averages and not instantaneous single location peak temperatures seems a better guide to what is happening in terms of trends over a larger sample area, nationally, than a single point reading at an airport somewhere can be relied on for.
In turning to the data of the well regardied CET record now, for a look at other national daliy average (mean) temperatures the next month August was hottest in the year 2020. With 25.2C on 12th August 2020 (The highest peak for any August day, recorded by CET, is 33.4C on 3rd August 1990
This means if we use averages then we can see that the two months discussed so far have their record average tempertures occuring in just the past 2 years, eliminating all doubt that warming is occuring. Hopefully
So having shown the effectiveness of using a daily national average temperature, instead of an instantaneoud peak value, lets consider the other highest peaks
Highest average for any January on record ? That was 13.6C on 23rd Jan 1834. That's right, the most recent hottest January average temperature in the UK was at a time when Marie Antoinetter was consort to Prince Louis and Charles Babbage was still working on the design for the analytical engine
The highest February average ? 12.8C on 4th Feb 2004, anpother quite recent one
Hottest March ? 15.2C on 30th March 2017, more confirmation of recent warming here
Hottest April ? Bear in mind the story is that the industrial revolution is the cause of all global warming, it seems strange that both April and May highest averages both occur before 1800, arguably before the indurtial revolution really got going. How come all of the CO2 from the industrial revolution has yet to produce a hotter April or May average than a date before the revolution itself happened ? Very odd, but all reliable data nonetheless from the Met Office and the worlds longest running reliable instrumental temperature record
Hottest June ? 22.9C 3rd June 1947, the year the cold war began. Hasn't global warming made a hotter day than that in June during the past 75 years ? It appears not
July and August I've already mentioned
September ? 22.3C on 2nd September 1906. Cars had wooden wheels back then. Have all the emissions from all the cars made since then not made Septembers any warmer than in 1906 ? Definitely not !
October ?, more recently again, 20.1C on 1st October 1985. It's the year of Live Aid. But still, 37 years of death inducing global warming since then still hasn't given us a hotter October, yet
November ? 15.5C on 5th November 1938, 11 months before the start of WW2 in Europe. Didn't all the munitions emissions, and emissions from cars, and all the flights in aircraft and ships since the start of WW2 produce a hotter November than one before WW2 ? No !
December ? 12.7C on 12th December 1994. This means that every person born in Britain since 1994 have yet to experience a hotter December average temperature than the one in the year they were born, 28 years ago (but yet they might well be the ones which think it just keeps getting hotter month after month, given that they've also had the most exposure to the 'it's always getting too hot' paradigm, which is produced if you only look at randomly produced peak temperatures, and not averages
So to recap, lets recall the amount of serious messaging about climate change which probably dates back to 1989, when Mrs Thatcher addressed the UN and stressed the importance of a worldwide commitment to reducing CO2. Anything since then is a year in an era when it has been fine to suggest we might only have ten years left to live, or only a few days left before doomsday due to climate change, and recall how most of the CO2 was produced before 1989, so how come that of the 12 months in every year, only 5 of those months have been hottest since 1989, and 2 were hottest before the start of the industrial revolution (which apparently causes global warming, except not in April or May)
Not sure what point(s) you are trying to make here but let's start with your claim in paragraph 4. To wit: "when we saw our national record peak temperature occur (37.3 recorded by the Met Office, which does not include RAF airports as data sources"
Erm, the Met Office tweeted this on July 20th:
UKMO have just posted this:
https://www.metoffice.gov.uk/about-us/press-office/news/weather-and-climate/2022/july-heat-review
Fixitsan @2,
A focus on averages by month would logically lead to comparing 'monthy averages' rather than hottest average day in a month.
That evaluation should Fix It for everyone concerned.
And an average would be the average of day and night values, not an average of the daytime highs.
The daily average would more correctly be the average of the max and min temperatures that day. The night could be warmer.
Fixitsan @2,
The following logical understanding supports the MET Office warning about and reporting localized extreme maximum temperatures:
Heat can kill. And a person in a location of extreme heat does not have the ability to turn on the "National Average" to reduce the Heat they experience.
@ John Mason. The qualification parameters for entry into the CET record are not applicable to the CET.
The Met office comment on many observed temperatures, but those sources are not affiliated to the CET record, depsite the Met mentioning them. The Met comment on many temperature measurements every year, none of which form part of their managed CET record
Be honest you don't know if it was hotter 20 years ago in a place where there was no thermometer. Statictiscally possibl;e, as thermometers are located on such a small amount of area of the UK
@ One Planet, I suggest you review night time temperatures whcih don't appear to have risen statictically significantly
Can you explain why there hasn't been a hotter April than 1775 after 247 years of CO2 production ? Do you even accept the notion that 1775 was the year of a record hot April day, and no other April since records began have had a higher average ?
Seemingly you suggest that it could have been hotter at night, are you saying it is your belief that in the April of 1775 there was record high night time temperatures - what would be the reason for that ?
The fact that you can suggest an alternative theory doesn't make the proposed theory incorrect. Just as I suggest that while I can read much fearmongering about how the world is getting warmer I can find an interpretation of the data which doesn't really support it, shouldn't you be willing to accept that, if you're open minded about it a hotter April or May should have occured by now after the output of CO2 from the industrial revolution, creating over 1Celsius of temperature rise last century. How many people do you realistically think would accept that after 200 years of Industrial revolution that April and May have never been hotter than before then ?
Bear in mind (this weakens my argument because it is disrespectful to the Met) that the Met pulled out of the lucrative business of long range weather forecasting (of vital importance to farmers everywhere, because getting it right at planting time can be worth 15% moire profit), because their moderate level of accuracy was surpassed by a more superior method which included solar and cosmic activity, while previously the Met Office had stated they did not think the sun affected the UK's climate.
Surely, climate only exists because of the sun.
No sun, no climate, and no climate change.
I say that with confidence as someone who firmly believes climate stability is a pseudo religious belief, and, there doesn't seem to be any evidence that the multivariant input based climate of the earth should ever see those variable parameters stabilise, ever, due at least to the fact that they all feedback into one another in various ways and particularly crucially, with different rates of change.
Stability is an impossibility and as far as I'm concerned the expectation of climate stability is a fools errand
Fixitsan @9,
"I suggest you review night time temperatures whcih don't appear to have risen statictically significantly".
Still sticking to 'hottest day maximum temp in a month - a day in April 1775', denying the logical fallacy of that methodology, says everything that needs to be said. You didn't even check the average of max and min on a day to see if your belief stands up to that weak test ( a weak one because you claim the nights are not statistically warmer). And, of course, you evaded the stronger test (logically built on your preference for averages) of where the Average of all of April (max and mins) in 1775 ranks in the list of Aprils.
The facts clearly contradict the story you are trying to sell. Everyone can confirm that independently. Also the warming of the nights is "statictically significant - confirmed to have happened in the temperature records everywhere". Though admittedly, as has been said, "There are lies, damn lies, and then there are the twisted ways some people abuse 'data manipulation - like statistics'.
I, and some others, strive to pursue and rely on logical understanding that best explains all of the evidence.
The logical understanding based on the evidence of the comments you have provided is you 'statistically' appear to 'confidently' prefer 'poorly justified beliefs' over 'logical improved understanding based on all the evidence'.
One Planet
Have you no answer as to why April and May have never had a higher daily average temperature than before the industrial revolution , about which it is said caused global warming, as in all places ahve got warmer.
Clearly there's at least one place where that doesn't seem to have happened and I wonder, how many others after that ?
Fixitsan,
Presenting a failure to comprehend my comments would be your fault. Repeating a clearly questionable point is still questionable.
How did the average for all of the month of April 1775 stand up? Surely that hottest day value you found is consistent with the month of April 1775 being the warmest in the record.
By the way, thank you for accepting that the MET was correct to warn about and report high local maximums.
How did April 'stand up'...to what ?
As I clearly pointed out to you that August's hottest peak temperature and hottest average temperature were on different days, then so to it could be expected the same for April.
The highest peak temperature for April was 25C, on 16th April 2003, and the highest daily average for April was 19.7C on 29th April 1775.
Given the wide spatial separation of individual thermometers it's no surprise that we always see a new peak in some areas, year after year, as the occasional coincidence of the highest regional temperature aligning with a recording thermometer occurs
Rearranging deckchairs on the Titanic is the first thing that comes to mind!
Fixitsan,
In your comment @9 you state "Can you explain why there hasn't been a hotter April than 1775 after 247 years of CO2 production ?" while offering as evidence that 'one day in April 1775 was the warmest in the record (of temperatures in a small part of the planet)'.
That leads to the requested test that 'the overall average of the Month of April 1775 be performed and compared to all other overall April values in the data set. That tests the claim that 'finding a hottest day in a month is consistent with that Month also being the hottest'.
But, more logically based on all the global evidence (not just a region's evidence), the understanding is that human activity has 'statistically significantly' caused significant rapid recent warming resulting in 'statistically significantly' higher local temperatures to occur more frequently.
Investigating a data set for part of the planet and finding a day in April 1775 that was warmer than any other temperatures on that date in other years in that data set (btw, was it statistically significantly warmer?) does not 'statistically significantly' contradict the understanding based on all of the evidence that "human activity has 'statistically significantly' caused significant rapid recent warming resulting in 'statistically significantly' higher local temperatures to occur more frequently."
Fixitsan (in several comments):
Hmmm. You seem to be rather inconsistent in your selection and discussion of data. In your first comment (#2), you make specific reference to the Central England Temperature (CET) record, but then you start talking about "national" temperatures. In fact, your comment #2 uses the word "national" nine times.
The CET is indeed well-known and documented. Wikipedia has a page for it.
It also appears that many (if not all) the record temperatures and dates that you provide are for the CET. The Wikipedia pages says that the "Central" in CET refers to the Midlans of the UK, and links to a page that contains the following map:
Yet, when I follow the link that John Mason gave in comment #4, to the UK Met Office report, they provide an animated GIF image of the maximum temperature comparisons for specific hot summer days in the years 1976, 2003, 2019, and 2022 (this week). When I look at those maps, I see that the Midlands usually is not part of the hottest regions of the UK for any of those maps. (Follow the link to the report to get a full-sized image.)
You also make the comment (third paragraph of comment #2) that "The strength of reporting on local temperature highs always seems to be given more importance then another useful metric, the national average temperature."
So, I have one question (for now): why are you using a regional analsyis of temperature (CET), and presenting it as a "national ...temperature"? Are you not making exactly the same mistake that you are saying other people should not be making?
Please provide a justification for treating CET as a "national temperature", when it is clear that it does not represent the area of the UK that tends to have the hottest temperatures. Why did you select CET, with its limited geographical coverage, for this purpose?
I understand your reservation about a single day in a single month, we need to compare a longer spell, like a while month in a year.
We have that data too in the CET, managed by Hadley Centre for Climate Change
Hottest January, 7.5C in 1916
February, 17.9C in 1779
March, 9.2C, 1957
April, 11.8C, 2011
May, 15.1C, 1833
June, 18.2C, 1846
July, 19.7C, 2006
August, 19.2C, 1995
September, 16.8, 2006
October, 13.3C, 2001
Novemeber, 10.1C, 1994
December, 9.7, 2015
Well now there are more warmer average months being declared in recent years, but has there really not been a warmer February since 1779 ?
All of the CO2 produced since 1779 failed to produce a warmer February than that year. WHat was so unusual about that year I wonder which made it the hottest ever even before any manmade climate change had begun.
May 1833, and June 1846 ? We haven't had a hotter May or June since before 1850, yet month after month, apparently, 'everything just gets hotter'
Regarding the regional/local aspect of one single temperature record, if it doesn't reflect the trend of the global patterns of temperature anomalies, the question needs to be asked about how many other areas do not align with the global trends, and therefore apparently challenge the notion that global warming is not global (affecting everywhere) at all
Fixitsan:
You are not addressing the unsuitability of using CET as a "national temperature". You said you are the UK. Surely you understand that the Midlands is not the entire nation?
Not every local area follows the global pattern. This in not at all surprising, and is totally expected. Your "month after month, apparently everything just gets hotter" is a complete strawman argument.
Fixitsan @18
A hottest month (or day) record in for example the UK in January 1916 doesn't prove the UK isn't warming or that the planet isn't warming. We have clear evidence the UK and world are warming.The old record is likely caused by a rare combination of weather events that concentrates energy in the climate system in one place to cause a temperature record. The planet could warm a couple of degrees as a whole, but it could be a long time before such a rare combination of events happens again, and with global warming added thus setting a new record.Eventually as the planet warms all the old records will be broken but it will take time.
Fixitsan @18,
Now we are getting somewhere. But there is further to go.
As you now see, looking at month averages rather than day averages changes things. April 1775's ranking is not the same as the ranking of that warmest April date you found.
Extend that learning to check where the overall year average of 1779 ranks relative to the February 1779 ranking.
The next step is to calculate the 11-year average for the years 1774 - 1784 (centered on 1779) and compare it to the most recent 11-year average. Then compare the 31-year averages (1764-1794 to the most recent 30 years). Is 1779 the centre of a 'period that was warmer than the most recent period'?
Another part of understanding this is that the amount of average global warming since pre-industrial times is only now slightly more than 1.0C. And the Arctic has warmed signficantly more (it really has). So the amount of average increase in a non-arctic area would be less. Review the data set to see if the range of temperatures for a specific date is less than 1.0C (It will be a far larger range of variation). You would also find that the range of average monthly values for February, or April (or any month) was also far more than 1.0C, but less than the range of values for any day within the month. Same goes for the annual values.
Finding a warmest day, or month, or even year, in the distant past in a regional temperature data set is not unexpected. But the warmest 30-year average in the global data sets are the most recent 30 years. And each month is almost certainly warmer than that month 30 years ago. So the 30 year average is now increasing with each new month of global data, even if the new month is a little cooler than the previous year. However, the much higher range of daily values could see a daily value that is cooler than the value 30 years ago. But, statistically speaking, it is more likely that a day this year will be warmer than that date 30 years ago.
Bob Loblaw @17,
The CET is described as "representative of a roughly triangular area of the United Kingdom enclosed by Lancashire, London and Bristol." That would give it a centre somewhere near Stratford-on-Avon and only the western edge of your red area sitting within that triangle which extends mostly to the south. One problem with using early daily data (or even monthly data) from CET is that it is not using standardised thermometer hosuings. The Met Office do give ranked regional, national and UK-wide monthly averaged data for max min & mean temperatures but only go back to the start of use of the Stevenson Screen in the 1860s. These at least would be "sticking with national averages" which as described by Fixitsan @2 indeed would be "a better guide to what is happening in terms of trends over a larger sample area," although advice apparently then ignored.
These UK-wide top-rankers come in:-
Max Temp - Jan 1916, Feb 2019, Mar 2012, Apr 2011, May 2018, Jun 1940, Jul 2006, Aug 1995, Sep 1895, Oct 1921, Nov 2011, Dec 2015, Winter 1989, Spring 1893, Summer 1976, Autumn 2006, Annual 2014.
Mean Temp - Jan 1916, Feb 1998, Mar 1938, Apr 2011, May 2008, Jun 1940, Jul 2006, Aug 1995, Sep 2006, Oct 2001, Nov 1994, Dec 2015, Winter 1989, Spring 2017, Summer 2018, Autumn 2006, Annual 2014.
But single months and even single years ar subject to a lot of noise so listing out these top-ranked months etc and reflecting on the length of time thay have maintained that top-rank is doing little more than examining randomness. Even for annual means, this UK-wide data provides a randomness spread of +/- 0.9ºC (2 sd) and the rankings will be latching on to even rarer events than 1-in-20.
So the argument set out up-thread by Fixitsan is baseless.
Added to that, the statement @2 that "most of the CO2 was produced before 1989" is wrong. In terms of FF emissions, more has now been emitted since 1989 and in terms of the rise in atmospheric CO2 levels, 1989 sit at about halfway from pre-industrial, but not forgetting the poor old climate system does need a decade or more to get its reaction to climate forcing working significantly.
MAR:
Thanks. I was going to see if Fixitsan could come up with any sort of analysis as to just what CET actually covers - e.g. station locations and such - but he so far seems to just want to run away from his "national" statement. If he addressed the coverage issue in a realistic fashion, I was going to come back to the suitability of instrumentation in the early periods. You've pre-empted that. (No harm done.)
Even the Wikipedia page has this statement (emphasis added):
So far Fixitsan seems to be pretty good at providing a Gish Gallop of numbers, but he's pretty short on understanding what they mean.
I don't recall ever suggesting there has been no warming.
We are definitely only talking about a single location on the planet which continually monitors the temperature, unlilke most locations on the planet.
I suppose most people would think that the hottest day of any month, or the hottest average recorded temperature for a whole month would by now, given the frequency and strength of argument update in the media, show without doubt that all the hottest months are relatively recent.
But there is clearly 1 location on the earth where that is not true.
What is one to say to someone who shows to me that the hottest May was nearly 200 years ago ?
I'm in the UK, the UK news swamps me constantly with global warming warnings whenever a single hot day comes along and an idiot lights a fire (clearly even at 100C dry grass doesn't burst into flames, ignition is still always required, self ignition never happens at lower temperatures)
I have a similar issue with sea level rise to be honest, living near to the Forth Bridge which the Scottish National newspaper warned could be under water by 2050. A brief calculation reveals that in order to cover the Forth Bridge the required rate of sea level rise is 1500mm per year. Nasa shows it is currently 3.4mm per year and the historical record shows sea levels have risen at between 1.5mm to 3.5mm per year for about 7000 years.
Who checks the media ? certainly nobody in the science community seems to pull them up for these outrageous claims, but should someone suggest that there hasn't been as much warming as the IPCC says, or the danger is less than claimed, the science community as it is, only puts it's gloves on then, but never when claims are reidiculously overstated and that is a very disappointing judgement to have to make of people who claim to be deeply interested in truth and facts
Sea level rise, we were told would cause The Maldives to be evacuated within 30 years, is another outrageous claim I need to mention as I'm on the subject. I can say that now , because that claim was made 30 years ago and since then the population of the Maldives has doubled and banks lend easily to build sea front resorts and CO2 levels have increased accordingly. I guess we need to throw bank managers in with other people who are acting irresponsibly together with scientists who permit lies to be published
Back to the Forth Bridge, anyone can see where the high tide mark was in 1892 photographs and hold it up today to see where the hgih tide mark is today, and discover that the sea level rise over the past 130 or so years is nothing unusual.
I'm dining tonight with a couple of mid 20's people, who fear, literally fear, sea level rise in this area thanks to media lies and exaggerations, which were made with absolutely no consideration for either what has gone before or what is most likely to happen next (According to NASA). All I'm saying is their distorted view of reality spoils what could otherwise be a good night out. And I bet they would not believe me if I said the hottest month of May in the UK happened hundreds of years ago, despite the record showing otherwise. They're virtually convinced this isle is about to be washed away
Science, sort yourself out, and please, please, shoot down the messengers of lies who predict 1500mm of sea level rise per year, that's nearly 5mm PER DAY are you absolutely out of your mind ? If you allow those lies to persist the net result is it becomes difficult to believe scientists
I am sure at this point in time that a reader of this message is actuvely taking out his TI calculator to try to prove how 1500mm per year is actually possible.
No it isn't, put the calculator away, write a letter to the people who are lying in the news and demand they tell the truth instead if you're a decent sort of human being
I think there has been some warming over the past 100 years
I believe there can never be climate stability, and climate change is the only possible scenario given the large numbers of inputs and feedbacks which are never stable
Therefore I feel it is irresponsible of science to allow any sort of publishing of an argument which claims we can 'get control' of the climate as if the temperature will stabilise and never change once again. It's unicorn thinking. Dire. Idiotic. It needs to be stamped out or else science is guilty of permitting lies to be propogated
The fastest rate of sea level rise I can think of was Melwater Pulse 1A. Estimates as to the rapidity vary but tend to be around 40-60mm per year over several centuries. Have never heard of anyone citing 1500mm a year! Perhaps you would be good enough to provide a link.
Fixitsan @24,
Forth Bridge under water?
I think you are referring to a bizarre report in the Scotsman from back in 2019. Or perhaps it is better described as being a spoof headline that snuck into print by mistake. If I were a subscriber of a paper offering up such a ludicrous story (and my local rag does occasionally get itself carried away with creating seriously bad nonsense, as well as giving column inches over to climate change denial and exaggerated climate threats) I bash off a strong letter highlighting their incompetence.
There were may local newspapers that picked up on the report of October 2019 by Climate Central entitled 'FLOODED FUTURE:Global vulnerability to sea level rise worse than previously understood' . What drew them to the report was the Coastal Risks Screening Map that accompanied the report. Your Forth Bridge story does rather take the biscuit, looking more Sunday Sport than Scotsman so why you bring it up here, I'm not sure.
The nespaper published that the Forth Bridge could be under water by 2050 (link attached). That was the headline
Depending on whether you mean the transport deck or the top of the bridge dictates the rate required to cover it
Most people have heard of the Fort hBridge and you can find the facts yourself, and I'm sure divide the deck height by the numebr of years to 2050
How have no scientists taken to the media to discredit fatuous and idiotic claims ?
Published 2019
https://www.edinburghnews.scotsman.com/news/forth-bridge-and-leith-could-be-under-water-2050-due-climate-change-1328692
The bridge is 110m above high water, and 137m above it's foundations, and there's 28 years to 2050 = 3.9 m per year required
I previously used the deck whicht and 31 years and rounded down but still produced 1.5m of sea level rise per year
That newspaper headline sat on the stands, in front of children.
If you're a scientist do you ever respond to nonsense unicorn facts like this or does the fact it helps to 'raise awareness' )in the worst possible way) by creating deep anxiety and causing some children to actually consider suicide due to the hopelesness of their future, or do you just leave this distorted truths to remain ?
I note at the last Extinction Rebellion protest the banner wording demanded 'Tell the Truth' ...so science...when are you going to dispute the fearmongering side of this debate, it clearly does more harm than good if children are left to develop anxiety about a lie
Tell the truth and be responsible.
This isn't just one newspaper on one day, the claims are frequent and equally stupid to anyone with even a basic engineering qualification, for no apparent reasons.
If you're interested in scaring children you have no right to claim ethical integrity as far as I'm concenred, and if as a scientist you fail to demand newspapers retract lies and distortions then you cannot expect people to think you are doing anything but enjoying riding the wave
https://www.edinburghnews.scotsman.com/news/forth-bridge-and-leith-could-be-under-water-2050-due-climate-change-1328692
Another national newspaper, this time the Kelpies and Forth Bridge could end up under water in 28 years time. The Kelpies are these things
https://www.scottishcanals.co.uk/destinations/the-kelpies/
30 metres high, 28 years, =1071 mm per year ...3mm PER DAY....are they smoking drugs ?
https://www.scotsman.com/sport/football/international/climate-change-could-see-kelpies-and-forth-bridge-under-water-2050-1401090
No it's not drugs, it's fearmongering, and the raising of awareness with the unexpected consequence that kids are demotivated at school due to anxieties about the future.
FixitSan #20:
Had you contacted us when you first heard of this article, we could have done a number on it for sure. We're a small international team of volunteers and can't be everywhere at once1
Fixitsan @27-29,
Why are you persisting with this crazy misinterpretation?
I wouldn't ever describe the Edinburgh News as a 'national' which you appear to have done. It is the Scotsman which is the 'national'. And you are continuing to blather on about the famous Forth Bridge when it is quite evident that the article (its text identical, cut-&-pasted by the Edinburgh News with adjustments for locale from the Scotsman) refers to the bridge further up the Forth at Kincardine but "Clackmananshire" was too long to fit into the headline.
Though I would have enjoyed setting things straight with the article, it has evidently slipped into some dark obscured recess or other. You can write an instructive piece on any type of climate misinformation - and I've seen cases where such yarns have actually come from the denier stable in a deliberate attempt to muddy the waters! I do not put anything past them, frankly.
MA Rodger, clearly not a local, the bridge in Clackmananshire is the Kincardine Bridge, known by no other name.
The Forth Bridge pertains to either the Forth Rail Bridge or Forth Road Bridge, either way, well over 50m or more above sea level.
The Edinburgh News is distributed nationally in Scotland, with the Herald and the Scotsman.
But just for the sake of pedantry as you[ve opened that gate, the Kincardine Bridge (The old one or the new one, you did not specify ?) has a high water clearance of 9m to the underside of the deck.
9m/28 years = 321mm per year of sea level required. Looking forward to hearing you explain how that is possible, when the highest ever during the meltwater period was approximately 60mm per year.
Nearly 1mm PER DAY
You're deluded if you think it is possible, but I cannot wait to hear you explain , how ?
John Mason you said " it has evidently slipped into some dark obscured recess or other."
It is right there up above, don't let anything stop you from earnestly demonstrating a commitment to truth and redo their maths as you see fit
Fixitsan #34 -
It is, and I found it quickly long before you posted the link by a simple search - but it did not get widely-circulated in the denialosphere, probably because it's so self-evidently ridiculous. That means even they didn't think they could get away with using it to attempt to undermine climate science - always their prime objective. Was probably the work of an intern with about 3 days of experience!
Fixitsan,
Regarding the Scotsman article about things near Edinburgh likely being ‘below annual flood levels in 2050’ have a look at the Climate Central map that is linked in the article:
“A map produced by Climate Central, an independent organisation of leading scientists, shows the most under-threat areas.
The map predicts the impact climate change would have by 2050.”
The presented description of the actual Climate Central map is “Land projected to be below annual flood level in 2050”.
Indeed, the approach roads to the Kincardine Bridge and Clackmannanshire Bridge (not the tops of the bridges) are indicated to be below the likely annual flood level in 2050. The approaches to the A91 bridge over the Forth would also be below the likely annual flood level in 2050. And the approaches, and significantly more road length, to the M9 and A905 crossings of the River Carron are also below the likely 2050 annual flood level.
That leads to understanding an answer to your question in your comment @24: "What is one to say to someone who shows to me that the hottest May was nearly 200 years ago ?"
The problem appears to be a lack of interest in more fully, and more logically, investigating things, even things that are rather easy to more logically fully investigate and better understand.
Fixitsan @33,
So, are you sitting comfortably? Then I'll begin.
The Edinburgh News may appear distributed nationally across Scotland if you live in Edinburgh, but elsewhere it is absent from the shop shelves although it maybe they keep it below the counter for the conveneince of Lothian folk.
The new bridge at Kincardine has been called the Clackmananshire Bridge since 2008 (previously the Upper Forth Crossing) and it is named as such by the original article in the Scotsman. Mind, you folk down-river may have a different name for it.
But as pointed out @ 26, whatever it is called and whether or not it has "a high water clearance of 9m to the underside of the deck" is all rather irrelevant as it is a hump-hacked bridge (although a very long one) with its approach roads (as with the old Kincardine Bridge) built across the flat lands alongside the water. So with a bit of SLR you maybe can cross the bridge dry-foot but you'd need a boat to access the bridge. This was presumably what the original copywriter at the Scotsman was saying when he tapped out "areas near the Clackmannshire Bridge were identified as at risk" while his editor and some credulous Edinburgh hack then added in the ridicule which you are attempting to prolong.
Wow. Fixitsan sure has a wild game of "look, squirrel!" going on.
From an original claim that a long list of temperaure records from the Central England Temperature series represented UK "national" values, he's gone into full retreat. No longer calling it "national" (he must have run out of "national"s in his keyboard, having used it nine times in his first post), he's backed down to calling it "regional" (not unreasonable), and then local, and finally (in comment #24) saying "We are definitely only talking about a single location on the planet which continually monitors the temperature, unlike most locations on the planet."
His game-killer statement? "But there is clearly 1 location on the earth where that is not true." (He's talking about places with record highs.)
Now, if he had looked at (and understood) the figures provided in the article, he would see that the rise in temperatures across the globe is not uniform. Here is the original figure, copied again:
Notice how the maps show a range of colours? The dark red ones are the hottest (relative to their normal temperature), and the blue ones represent locations that were colder than normal, with a range of colours in between. And Fixitsan seems to think that this is news - and devastating to the science of climate change. Of course, it is not. It's just a variation on the myth "It's freaking cold!" that Skeptical Science already has a page on.
If he understood anything about weather, he would also know that "climate" includes variations about the averages. Gradual warming does not mean that we'll never see cold again (see above link about "it's freaking cold!"), and it also does not mean that we'll never see record cold temperatures set. What we do see is records highs being set a lot more frequently than record lows - as would be expected in a warming climate. It turns out that Skeptical Science has a post about that, too.
https://skepticalscience.com/Record-high-temperatures-versus-record-lows.html
So, Fixitsan still hasn't said anything that is actually new, or that goes against our understanding of climate and climate change. He's just repeating myths that have been around for years - and debunked many times.
His closing comments on temperature seem to be: "...the question needs to be asked about how many other areas do not align with the global trends, and therefore apparently challenge the notion that global warming is not global (affecting everywhere) at all."
Guess what? Some areas are warming less than (or more than) other areas, and some may even show some cooling, but none of this represents any challenge to climate science. In fact, observations such as increased warming at the poles, regional variations in warming, etc. are all things that were predicted by climate theory. Fixitsan's "show stoppers" are actually confirmation of the science.
Then, running out of myths to retreat to on temperature, Fixitsan has jumped the shark to start going on about sea level rise. He's not doing any better on this. All he seems to have is some newpaper headlines and misinterpretations of same.
I'm not sure exactly what sea level rise has to do with temperature records, but I guess the discussion is a least on topic with the UK slant of the blog post.
Having seen his sea level "gotchas" torn to shreds, will we see Fixitsan jump to chase another squirrel? There are lots to choose from. Check out Skeptical Science's Most Used Climate Myths, choose your favorites, and place your bets!
Fixitsan says: "We are definitely only talking about a single location on the planet which continually monitors the temperature, unlilke [sic] most locations on the planet."
If the implication is that the region covered by CET is a single location on the planet which continually monitors the temperature, unlike most locations on the planet (the problematic part of the point), then we are not talking about the same thing, or at least 'we' have not yet developed a shared common sense of the bigger picture (reasonable common awareness and logical common understanding based on all of the evidence).
Where I live in Canada, scientifically collected (with Stevenson screens and all the other protocols) temperature data is available back to 1884 (when the region I live in was being harmfully over-taken in a 'settlement way' by the invading European colonizers - another emerging understanding that misleading marketing has held at bay for centuries). I am sure there are many other locations with longer histories of temperature data than the region I live in, not just CET.
Check out my comment on the Skeptical Science New Research for Week #29 2022.
There are many unreasonable reasons for the difficulty in establishing a common sense understanding regarding many issues these days. The power of misleading marketing is probably the most damaging scientific development by humans, likely more damaging than nuclear weapons or the diversity of fossil fuel developments.
One more (last) poke at how hard it is to misunderstand what the HadCET dataset shows:
A nice statistical analysis of this UK heat wave, including references to CET, over at Tamino's:
tamino.wordpress.com/2022/07/23/extra-ordinary-heat-wave/
One Planet, with reference to your own referenced series extracted from CET
Why was there a cooling starting at around 1972, with temperatures not recovering tot heir pre 1970's level until the 1990's if CO2, the alleged cause of all warming, was rising throughout the same period ?
The theory is more CO2 = always undoubtedly more warming.
@ Bob ""I'm not sure exactly what sea level rise has to do with temperature records""
No, perhaps reading any press article which consistently ties the two together ought to be all you need to do to raise your awareness.
Say 'climate change' on any high street, hear ' sea level rise' addended
Perhaps though you weren't aware of any previous connection between temperature and sea level ? Have you heard of a thing called climate change thepory ? Perhaps ? Maybe ? Oh well, hideaway.
Regarding the CET it seems to show no net gain in temeprature between about 1760 and 1910. An amazing sight to see, shoudl I be ever tempted to read news headlines which assert that temperatures have been rising continuously throughtout the industrial revolution. Not in Central England, they haven't.
Of course it depends if you use the 10 year or 30 year average but short term trending allows more noise through but regardless of that, warming only seemed to being in 1910 on the CET terecord, reached temperatures as high as those seen in 1730 by about 1940 (it remained colder than 1730 until 1940) and since 1940 we have seen a discontinuous warming, which incudes a cooling starting in the 1960's which doesn't finish cooling until the 1990's
With a lack of variability in atmospheric CO2 levels over that 100 or so year period (the change in CO2 has been steady and predictable, rarely variable) being coincident with the CET record during that time, it's visible to see that the theory of more CO2 = more warming is not being measured by instrumentation in the last 100 or so years. That is not to say that CO2 does not cause warming, but the CET record doesn't show what I believe many epople might understand is happening in their own minds when picturing the promoted relationship between CO2 and temperature on it's own
The reason different parts of the world warm at different rates is discussed here.
www.climate.gov/news-features/climate-qa/does-global-warming-mean-it%E2%80%99s-warming-everywhere#:~:text=No%2C%20%E2%80%9Cglobal%20warming%E2%80%9D%20means,all%20seasons%20across%20the%20globe.
The reason there was a flat period of global temperatures mid last century in the centre of England and for the planet as a whole was because industrial sulphate aerosols suppressed the warming caused by CO2. This effect ended around the 1980's as CO2 concentrations became large enough to overcome the effects of aerosols, and the quantities of aerosols dinished as coal fired power stations fitted equipment to filter much of them out. I believe this was to reduce acid rain effects and their affects on respiration.
This material is mostly intuitively obvious and takes only seconds to find on the internet. Why people can't find it is beyond me.
nigelj.No
I wasn't talking about flat period of global temperatures mid last century, but instead a flat temperature in the UK from 1910 and proceding into the 1990s, which is 70% - 80% of the last century,which is a period of time I bet if you asked the layperson to describe in terms of temperature for that period almost certainly would argue that because CO2 has risen for that century then so too must have temperature. To even suggest to them that that had not been the case, even backed up by such a reliable and noteworthy source, is just bound to have you labelled a denier, despite being backed up by science in that case. Well, if it isn't the layperson who would say that, any of the 'journalist fact repeaters' and news cockatoos would definitely stick their oar in.
To even get to that stage though suggests there is an enormous disconnect between what most people think and what is happening in reality. Science provides the data for reality and I assume the media in general make it their mission to sex up everything to do with climate change out of habit.
I still wait every morning for the final calamatous news that the Maldives have finally become a victim to sea level rise, as I was assured by the Maldivian climate minister and international scientists should have happened by today that it was the only certain outcome if CO2 production did not decline. CO2 output has increased over those 30 years .
Concerned about the properties of the people there I turn to Google and type 'Maldivian Properties risk' and get nothing but pages and pages of property sales pages reporting increasing property prices due to a high demand in the The Maldives, representing a good risk for investment. How interesting it is to find presumably otherwise finance savvy investors throwing money out to be washed away with the at risk properties in the Maldives (sarc)
You would think for an island constantly on the cusp of being destroyed it ought to be seeing falling property prices !
The cost of living in The Maldives is 9.82% lower than in the UK
Rent in The Maldives is 11.3% lower than in the UK on average
Surprisingly expensive for somewhere about to disappear forever under water that will rise and engulf it, apparently, when it gets around to it, it's just busy not rising all that quickly at the moment and has not been for quite some time indeed.
So did the Maldivian Environment minister and international scientists lie ? Perhaps they only made the most dire prediction possible and that hasn't come true. But in itself that makes it difficult to detect when any other prediction is a realistic one or if that's also the most dire possible prediction. Under these circumstances who can blame the average person for feeling like it is just business as usual where politicians are concerned, always amplifying negatives and generating high levels of irrational fear, but conveniently always leaving office before they have to be held accountable for being wrong. Again. Business as usual.
...and Fixitsan is back to his bogus argument that rising CO2 must create temperatures that are "always undoubtedly more warming". Is Global warming still happening? is #5 on the list of most common myths. Does CO2 always correlate with temperature? is #47 on the list of most common myths.
And he's picked the cherry of the 1970s cooling. Why did climate cool in the mid-20th century? is #49 on the list of most common myths. Will he chase the squirrel of early 20th century temperatures next? That is #52 on the list of most common myths.
And he's justifying going off topic for this blog post ("Taking the temperature: A Dispatch from the UK") because he seems to be incapable of using the search function (top left of every page at Skeptical Science) to find a post where sea level rise is on topic. Oe perhaps he simply does not understand that the link between sea level rise and global temperatures is the result of the slow overall rise in global temperature, not the week of record-high temperatures in a small part of the world (the UK). Given his repeated failure to understand the global vs local relationships for temperature, it seems quite likely that he is equally-poorly-informed about the causes of sea level rise.
And he returns to the CET temperature trend as if local variabilty disproves global trends. (He's still wrong.) And he goes into the pre-1900 period (part of the "Industrial Revolution") as an example, seemingly unaware that CO2 rise is largely a 20th century phenomenon - and mostly the latter half of that century.
I need to correct an earlier misunderstanding on my part. Fixitsan is not playing "look, squirrel!". He's playing Climate Myth Bingo. Which square will he call out next?
Oh, my. And while I was preparing comment #47, Fixitsan has posted #46, where again he fails to recognize that CET is not the UK, fails to realize that his eye-crometer view of trends is off (refer to the Tamino post I linked to earlier), repeats his grossly-inaccurate characterization that rising CO2 must cause constantly rising temperatures, fails again to actually look at when the CO2 rise is happening...
...and goes off on another tangent about sea level somewhere else in the world.
Fixitsan @42-44&46,
It seems SLR has gone Forth and we are now back amongst the sassenachs with their CET record.
(Note you miss the point @43 where you respond to a caooment which is questioning why a discussion of CET should suddenly be discussing a strange article in the Edinburgh News abuot SLR projections.)
@42&44 you forget that it is the global average SAT which will show some warming from a positive climate forcing resulting from increased CO2, and react with lots of warming from a big positive climate forcing like the CO2 forcing within AGW.
But as you say up-thread (perhaps you have forgotten), the temperature record of a wider area provides a "better guide" than a smaller area. So @42 perhaps the question of what is causing these CET wobbles of the 1970s/80s (or any other period) may provide an exemplar for why a smaller area is more wobbly than a biggerer one. And @44 there appears to be some inane idea that global SAT (& thus also wobbly CET) should have been rising vigorously since that day Abraham Derby first thought to make his steel using coal rather than of charcoal.
@46 you treat us to the bizarre idea that we should be able to use the house prices on the Maldives to measure AGW (with some inverse correlation) and because there is no indication of any falling prices to be seen, "the average person" will thus conclude the political message on AGW is yet more nonsense from the political classes.
Yet in such a world, what "the average person" thinks or doesn't think makes no reference to the SLR records in the Maldives.
For anyone wishing to examine a more formal version of climate myth bingo, there are a couple of web sites where such things have been more thoroughly formulated:
https://andthentheresphysics.wordpress.com/2020/12/04/a-climateball-bingo-card/
https://climateball.wordpress.com/the-bingo/