Climate Science Glossary

Term Lookup

Enter a term in the search box to find its definition.

Settings

Use the controls in the far right panel to increase or decrease the number of terms automatically displayed (or to completely turn that feature off).

Term Lookup

Settings


All IPCC definitions taken from Climate Change 2007: The Physical Science Basis. Working Group I Contribution to the Fourth Assessment Report of the Intergovernmental Panel on Climate Change, Annex I, Glossary, pp. 941-954. Cambridge University Press.

Home Arguments Software Resources Comments The Consensus Project Translations About Support

Bluesky Facebook LinkedIn Mastodon MeWe

Twitter YouTube RSS Posts RSS Comments Email Subscribe


Climate's changed before
It's the sun
It's not bad
There is no consensus
It's cooling
Models are unreliable
Temp record is unreliable
Animals and plants can adapt
It hasn't warmed since 1998
Antarctica is gaining ice
View All Arguments...


Username
Password
New? Register here
Forgot your password?

Latest Posts

Archives

Blaming the Pacific Decadal Oscillation

Posted on 5 March 2011 by Riccardo

The Pacific Decadal Oscillation (PDO) has gained some traction as an alternative hypothesis as the cause of the last century warming or at least a good part of it. More often, this hypothesis is based on the apparent visual correlation between warming periods and the positive phase of the PDO, but others ventured in semi-quantitative analysis (e.g. Dr. Roy Spencer).

Although none of them can be called strong evidence, it's worth looking at this climate feature in more details, obviously starting from describing it. The first thing to note is that the PDO, like any other oscillation, can not be the cause any long term trend. Whatever the impact of one phase might be, the opposite phase would have the opposite effect and after a full cycle the system would be brought back to where it was at the beginning. The heat can just be moved around through different parts of the system and it may even be "hidden" for some time, but after a full cycle it will be back. In other words, an oscillation does not create nor retain heat and we cannot have both an air and ocean long term warming trend.

The Pacific Decadal Oscillation

The PDO is a pattern of climate variability of the North Pacific (north of 20°) with period around 60 years. It's characterized by a positive (warm) phase with an anomalously cold central-western Pacific sea surface temperature (SST) and a warm eastern pacific SST. The opposite applies for the negative (cold) phase. Note that the terms "warm" and "cold" are definitely USA-centric.


Fig. 1: Typical wintertime Sea Surface Temperature (colors),  Sea Level Pressure (contours) and surface windstress (arrows) anomaly patterns during warm and cool phases of PDO. Left panel: positive (warm) phase; right panel: negative (cold) phase. (from JISAO).

Although the PDO may vary from year to year, it shows a tendency to be either in the positive or in the negative phase. To summarize its behaviour with time, the PDO index is derived as

[...] the leading PC of monthly SST anomalies in the North Pacific Ocean, poleward of 20N. The monthly mean global average SST anomalies are removed to separate this pattern of variability from any "global warming" signal that may be present in the data.

In other words, given a spatial pattern, this index describes how it changes with time. It is important to note that the "monthly mean global average SST anomalies are removed"; hence this index actually describes the "anomalous anomaly" of the North Pacific with respect to the global ocean.
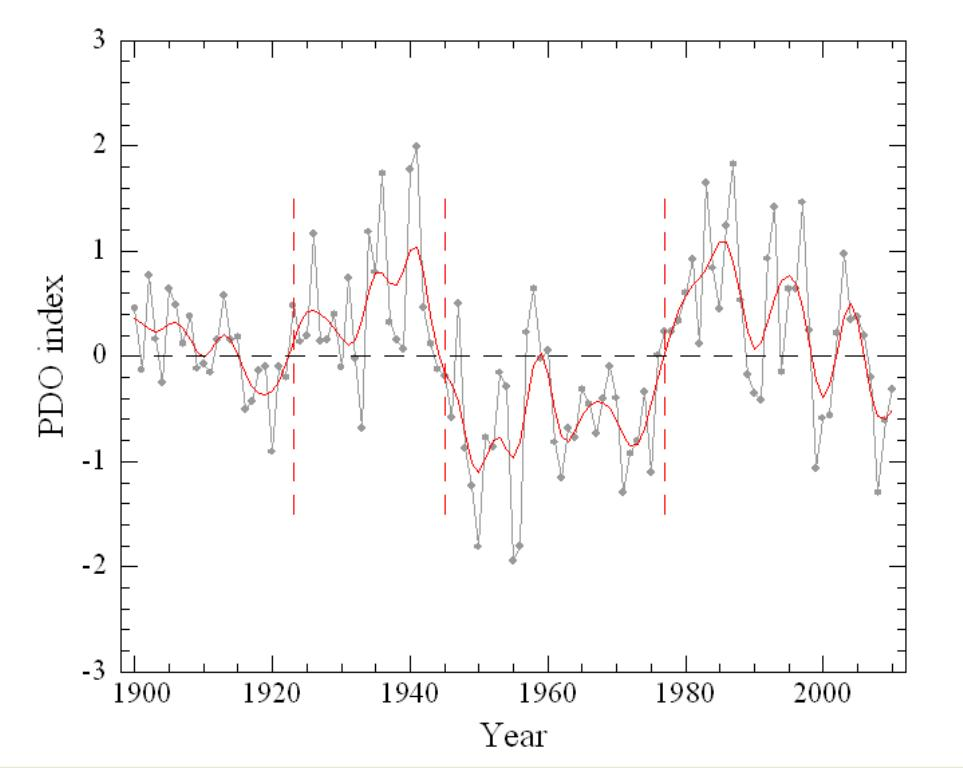
Fig. 2: annual PDO index from 1900 to 2010 (grey line). The red line is a 5 year smoothed version. Vertical dashed lines represent the three regime shifts (see text).

Three so-called regime shifts can be seen in the PDO index shown in fig 2, namely around 1923, 1945 and 1977. In particular, from the PDO index we see that between 1945 and 1977 the global ocean has warmed more than the North Pacific; this is the reason why some skeptics think that the PDO pushed the brakes on global warming.

The process to separate variability from the global warming signal implicitly assumes that the SST response to global warming is spatially uniform. This looks quite unlikely and we should expect the global warming signal to "leak" into the PDO index (Bonfils et al 2010). This fact alone should make the alarm bell ring before using it to explain global warming or even to remove the natural variability associated with PDO from observational datasets.

The causes of the PDO

It should be clear that in a strongly coupled system like our climate, nothing happens in isolation or by itself. Although a definitive answer to the question of what causes the PDO cannot be given, several studies have shown that the PDO depends on other climatic factors.

Some of you may have noticed that the PDO patterns shown in fig. 1 somewhat resemble the ENSO pattern (here in the positive phase); indeed, the PDO can be described as a long-lived ENSO-like pattern. Newman et al. 2003 have found that the PDO can be modelled as a first-order autoregressive process driven by ENSO. To make it simple, we may say that the PDO is atmospheric "noise" interacting with ENSO. Even more important, Shakun et al. 2009 obtained similar results regressing separately over the North and South Pacific. This means that the PDO is part of a more general pacific decadal variability driven by ENSO.

Schneider et al 2005 added to the picture the Aleutian low variability and the ocean circulation along the Kuroshio–Oyashio Extension (the Western Pacific counterpart of the Gulf Stream in the Atlantic Ocean). They conclude that the PDO is "a response to changes of the North Pacific atmosphere resulting from its intrinsic variability, remote forcing by ENSO and other processes, and oceanwave processes associated with ENSO and the adjustment of the North Pacific Ocean by Rossby waves".

Thus, the PDO is a response to something else; treating it as a forcing must be taken with caution.

The impact of PDO on global temperature

As noted before, some skeptics claim that the PDO is responsible for the 20th century temperature trend. Prominently, Roy Spencer used a simple energy balance model (EBM) forced by "cloud cover variations directly proportional to the PDO index values" to show that indeed much of the warming can be accounted for by the PDO alone. A zero-dimensional EBM relates the temperature change with the energy imbalance of the earth; mathematically, it can be written as


where C is the heat capacity, λ the climate sensitivity and F(t) the forcing; it can be shown that the response time of the system is given by τ = C λ .

In his post Spencer does not give many details on what he did. In particular he says that he "ran many thousands of combinations" with varying parameters and that his graph shows "an average of all of the simulations that came close to the observed temperature record"; a bit mysterious and hard to reproduce. Though, he gives an average value of the parameters: 800 m for the ocean mixing depth, λ = 0.33 °C/Wm-2 and a proportionality factor between the PDO index and forcing of 1.7-2.0 W/m-2. With these numbers it's possible to calculate ΔT from the equation above; the result is shown in the figure below as blue line.
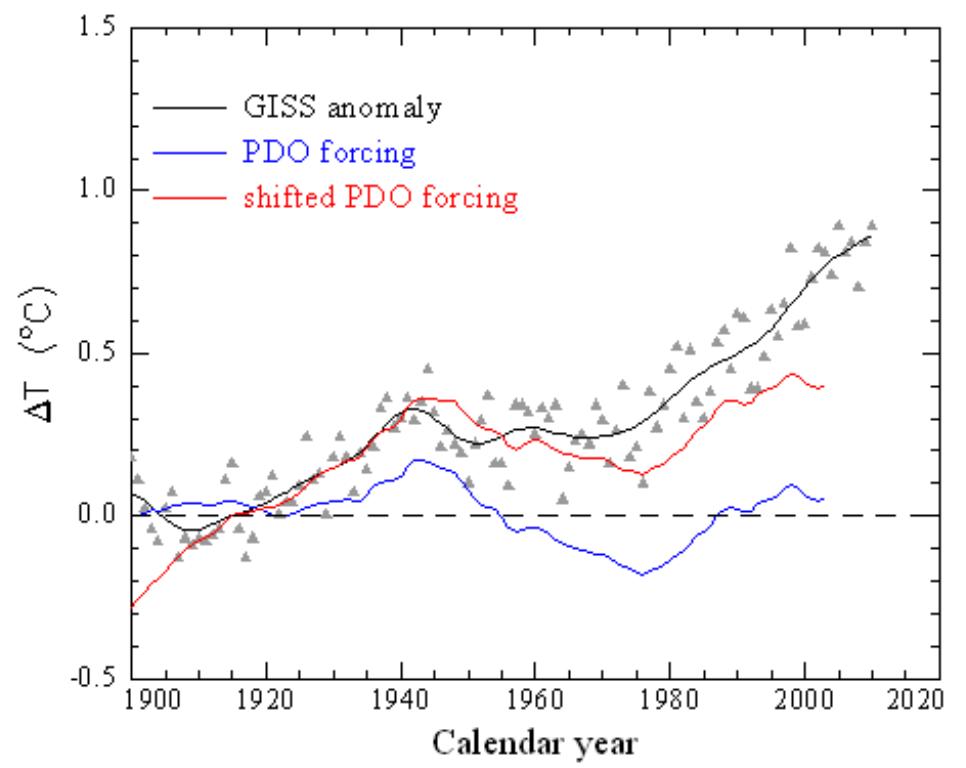
Fig. 3: triangles: GISS anomaly baselined 1900-1920; the black line is a 11-years smoothed version. Blu line: ΔT calculated from the PDO index. Red line: the same as the blue line but with a shifted PDO index.

It's evident that the calculated curve does not follow the measured ΔT much nor it is anything like Spencer's curve. Indeed it couldn't, it behaves exactly as expected given that the PDO index has no trend. The question is, then, how to reproduce Spencer's result. Answering this question requires a sort of "reverse engineering", which is prone to result in the wrong answer; nevertheless, I tried. Using the same parameters as before but shifting the PDO forcing up by about 2 W/m2, i.e. assuming an initial imbalance that large, I obtained the red curve shown in fig. 3 which this time looks pretty much like Spencer's curve.
(Note: you might want to read a similar and more authoritative explanation on how to cook a graph or Barry Bickmore's take).

If true, this is equivalent to adding a background linear temperature trend. In the end, contrary to Spencer's claim we can rule out at least that the PDO alone can explain the last century warming trend.

The PDO in the past

There has been some reconstructions of the PDO in the past. Clearly, there are no measurements available and it's also hard to find reliable proxies of the sea surface temperature in the North Pacific. Typically precipitation sensitive proxies are used.

Bondi et al. 2001, for example, used tree rings for the period from 1660 to 1992 from trees collected between Southern California and northern Baja California, a region chosen for the good correlation between tree rings and PDO. They found a dominant bidecadal cycle throughout the record up do the end of 19th century and longer periodicities, similar to those found in the instrumental record, in the 1900s associated with larger PDO-ENSO variability. Although there has been periods of reduced variability and loss of periodicity, nevertheless it appears that the PDO has been a more or less permanent feature of the Pacific Ocean variability.

One of the longest reconstructions I'm aware of is reported in MacDonald at al. 2005 which extend the record back to year 993. They found again the 50-70 years cycle but it is not stable throughout the record; in particular, this cycle is lost for extended periods during the 13th century and from the 17th to the end of the 18th century. But the more evident feature is the unusually low PDO during the Medieval period, as shown in the figure below.
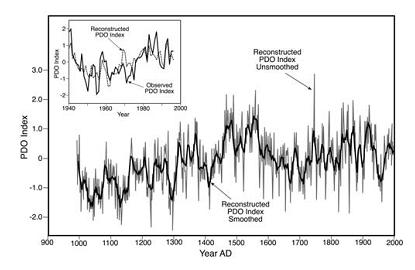
Fig. 4: reconstructed annual PDO index from AD 993 to 1996. The heavy line is the index smoothed using an 11 year moving average. Insert: the same reconstruction compared to instrumental data.

This anomalously cold eastern North Pacific is in agreement with a semi-permanent La Nina-type condition found by Mann et al. (2005). Both data and models agree on this somewhat paradoxical finding, warmer conditions over the tropical Pacific in the long run lead to the devleopment  of a prevalently negative PDO-ENSO. This can be explained (Cook et al. 2007) by the so-called Bjerknes feedback, where in a warmer tropical Pacific the east-west temperature gradient increases and so does the Walker circulation, creating the conditions for the development of a La Nina.

Conclusions

In this brief post I've tried to highlight some features of the PDO that I believe are important in the context of its impact on the global temperature trend. Although it is a well recognized pattern of variability with clear implications on the regional climate, it appears that it can not be invoked to explain the current warming trend; both recent and paleo data and our understanding of PDO-ENSO tell a different story.

NOTE: This post written by Riccardo is the Advanced rebuttal to "it's the Pacific Decadal Oscillation"

0 0

Printable Version  |  Link to this page

Comments

1  2  Next

Comments 1 to 50 out of 82:

  1. Riccardo, when you state "the PDO index has no trend" I assume you mean no trend in the magnitude of the index as it oscillates. But given it is an oscillation should it not be the frequency of the oscillation that is more relevant in the search for any trends rather than the magnitude of the index. Just looking at your Fig. 2: annual PDO index from 1900 to 2010, it appears that over that short time span, the index appears to have spent more time in the positive phase rather than the negative phase. Even in the reconstruction it appears as if the frequency of the oscillation has been increasing as we go.
    0 0
  2. I think it is unlikely that oscillations like PDO explain the whole XXth century trend, and that CO2 doesn't contribute to this trend. However, one should recognize that current GCM models are quite unable to describe this (and other) oscillations, and that this lowers their reliability concerning the determination of climatic parameters such as the CO2 sensitivity. If PDO contributes significantly to the warming of the last 30 years, it is not reproduced by the "natural alone" variations in GCM models (see e.g. http://www.ipcc.ch/graphics/ar4-wg1/jpg/fig-6-14.jpg ) , so this should lower the anthropic contribution accordingly
    0 0
  3. Even though the PDO would not explain a long term rising T trend, when coupled with rising solar output from 1750-1850, it correlates well with early 20th century warming (+increasing solar output), mid 20th century cooling (+flattening solar output), less so with late 20th century warming (flattening solar output). But what you have faiiled to mention is that these 3 coupled periods (sun+-PDO) correspond better than c02 does in the 20th century (eg mid 20th century cooling with rising c02), implying that climate sensitivity to c02 is low. That is, the c02 effect is weak when you intergrate PDO, solar trends, and c02 trends in the 20th century, and also up to the 1st decade of the 21st century. Others have looked at this and come up with a correlation of 24% between T and c02 since 1850, and it's currently falling (rising c02 but flattening T). This together implies very weak climate sensitivity to c02, and that most of the warming since 1900 has been from solar output + 20 year+ heat lag effects, coupled with PDO oscillation + lag effects (heat derived from same source since 1750-warming sun). C02 effect has been increasing since 1950 but is still weak, as also seen in the flattening of T since 2000.
    0 0
  4. To me it's not even clear that the PDO "warm" phase means a warmer Pacific SST as a whole. Eyeballing the figures, it looks like the "warm" phase could even be cooler than the "cold" one. Let alone warm the globe. Does anyone have a quantitative figure?
    0 0
  5. thinadonta@3: Have you tried factoring out the solar cycle from the temperature trend? Tamino does it here and several others have done similar calcs. Once you take out the effect of the solar cycle, the flattening since 2000 (which would probably be better described as an anomalously fast increase leading up to 2000) is replaced with a pretty linear trend. Here's a paper on the same thing: Lean and Rind (2009), GRL 36.
    0 0
  6. thingadonta, what is the correlation (r^2) between the temperature increase and solar output - PDO with a monthly plot. IF you only have a smoothed plot (which exagerates correlation) what is the correlation for that smooth plot, and what is the smoothing. And who worked this out, and where did they work it out?
    0 0
  7. Thingadonta, Your entire post has a total of zero links to data. "Others have looked" is just a bunch of deniers who do not know how to analyze data,or fabricate distortions. Provide links to peer reviewed data. If you cannot provide links to the data you will not convince anyone you have anything to say. Riccardo, You certainly have a lot of appropriate links to peer reviewed data. Are you involved in research in this field?
    0 0
  8. Riccardo, PDO is indeed not a forcing, it is an index reflecting the result of various natural forcings. Thus it explains some of the natural variation that overlays AGW. But there is an important fact about the index not mentioned above which is that the index has the global SST anomaly subtracted from it, see http://www.springerlink.com/content/5xm9ngv5fn5dc2r7/fulltext.pdf (Mantua and Hare 2002) where they explain: "Residuals are here defined as the difference between observed anomalies and the monthly mean global average SST anomaly (see Zhang et al. 1997)." I believe that is what Roy Spencer was trying to show by adding "CO2" to PDO in his graph.
    0 0
  9. Yes, Roy Spencer explained the warming trend with a weaker CO2-effect + the PDO. And then he is being attacked on "adding a trend to PDO" which is the human attribution in his simple model. He has done nothing wrong investigating alternative hypothesis'.
    0 0
  10. A general clarification related to some of the comments (johnd, Gilles, thingadonta). The point of the whole post is to show that the PDO alone cannot be the cause of current warming (Spencer's claim) and that what we know makes clear that it cannot even be considered as a forcing by itself. johnd frequency has indeed changed over time, as I showed, but as far as the PDO as a forcing is concerned it is irrelevant; it would anyway produce a tmporary warming trend. Lacking a long term trend in the PDO index rules out it's role. Fig 3 should make it clear. thingadonta I intentionally "faiiled to mention etc." because my point was exactly that, we can not use the PDO index this way. Moreover, how come you compare PDO+sun with CO2 alone? You can not play with the forcings you convenience, putting in the ones you like and leaving out those you don't like. Alexandre I do not have the figure you're asking for. Though, we know that the North Pacific Ocean is warming overall and that the PDO index tells us just if it is warming more or less than the global oceans. michael sweet I take your comment as a compliment. I'm not involved in any research involving climate, but I'm a scientist and I'm used to read the scientific litterature thoroughly whenever I find a scientific issue interesting. Eric (skeptic) I explicitly quoted the definition of the PDO index. Spencer, again explicitly, tried to show that the PDO index alone could explan a good part of the XX century warming. He added the CO2 forcing afterwards to account for the late XX century increase while the PDO index was decreasing. He didn't even considered the well know TSI increase durng the first half of the century.
    0 0
  11. Riccardo: Your post misses a very important point. You defined the PDO, but failed to clarify it. The PDO data from JISAO does NOT represent the Sea Surface Temperature (SST) anomalies of the North Pacific, north of 20N. In fact, on decadal timescales, the SST anomalies of the North Pacific (north of 20N) are inversely related to the PDO. The following graph presents the North Pacific SST anomaly residual (North Pacific SST anomalies MINUS Global SST anomalies) versus scaled PDO data, with both datasets smoothed with a 121-month running-mean filter. http://i52.tinypic.com/ipaxjr.jpg Now if we invert the PDO data (multiply it by a negative scaling factor) we can see how closely they are related. http://i52.tinypic.com/15oz3eo.jpg In other words, during epochs when the PDO is negative, the North Pacific SST anomalies are greater than global SST anomalies. For a more detailed discussion, refer to: http://bobtisdale.blogspot.com/2010/09/inverse-relationship-between-pdo-and.html
    0 0
  12. Riccardo Thanks for your response. So the North Pacific has been warming, sometimes a bit ahead of the entire global ocean, sometimes a bit behind. When it's ahead we have a negative PDOI and vice versa (right?). Look, I may be just giving away my own ignorance, but I cannot grasp any physical meaning of this index to justify it "pulling" the Earth's temperature up or down. It's just an oscillation between two different temperature distribution patterns. A very positive PDOI does not mean a particularly warm ocean (Global, at least. I tried to find some SST time series of the Pacific alone, and could not find any.)
    0 0
  13. thingadonta #3:
    "these 3 coupled periods (sun+-PDO) correspond better than c02 does in the 20th century...implying that climate sensitivity to c02 is low."
    Sorry no, you don't calculate climate sensitivity by looking at correlations. PDO does not cause long-term warming trends so it has no impact on climate sensitivity. Not to mention the fact that you're comparing a combination of multiple effects to just a single effect (CO2). CO2 doesn't act in a vacuum - you also have to take into consideration all other forcings in addition to CO2.
    0 0
  14. Bob Tisdale you're right, that's what I wanted to say when I noted that the definition is USA-centric.
    0 0
  15. Riccardo, you're right, you did. Sorry about that. Perhaps Spencer did indirectly consider the early 20th TSI increase in the sense that it is reflected in the PDO index.
    0 0
  16. Sometimes I think the language used to describe "climate oscillations" is somewhat unfortunate. To many the term "oscillation" suggests periodic behavior. This is compounded by references to "climate oscillation's" "period." But the behavior of climate oscillations is generally not periodic. Instead there is a characteristic time scale that appears to be associated with a form of bistability where the system tends to be in either one state or the other. Your reference to "atmospheric noise" is suggestive of the nonperiodic nature of the Pacific Decadal Oscillation's non-periodic, or alternatively, quasi-periodic behavior. The Pacific Decadal Oscillation has a couple of characteristic time scales. Atmoz gives a detailed explanation of the correlation between PDO and global temperature in which he mentions two different characteristic time scales:
    Sometimes, it's said that the PDO has a characteristic time scale, hence the word decadal in the acronym. The UW website states that "Shoshiro Minobe has shown that 20th century PDO fluctuations were most energetic in two general periodicities, one from 15-to-25 years, and the other from 50-to-70 years." To evaluate this, we can look at a wavelet analysis of the PDO with trend derived in the first part of this post. On the Relationship between the Pacific Decadal Oscillation (PDO) and the Global Average Mean Temperature Atmoz, 3 Aug 2008 http://atmoz.org/blog/2008/08/03/on-the-relationship-between-the-pacific-decadal-oscillation-pdo-and-the-global-average-mean-temperature(emphasis added)
    The longer characteristic time scale is comparable to that which presumably exists for the Atlantic Multidecadal Oscillation. Please see:
    Michael E. Mann, associate professor of meteorology and geosciences, Penn State, and Kerry A. Emanuel, professor of atmospheric sciences, MIT, looked at the record of global sea surface temperatures, hurricane frequency, aerosol impacts and the so-called Atlantic Multidecadal Oscillation (AMO) — an ocean cycle similar, but weaker and less frequent than the El Nino/La Nina cycle. Although others have suggested that the AMO, a cycle of from 50 to 70 years, is the significant contributing factor to the increase in number and strength of hurricanes, their statistical analysis and modeling indicate that it is only the tropical Atlantic sea surface temperature that is responsible, tempered by the cooling effects of some lower atmospheric pollutants. Climate change responsible for increased hurricanes Tuesday, May 30, 2006 http://live.psu.edu/story/18074(emphasis added)
    Shorter characteristic time scales would be suggestive of oscillators associated with shallower ocean ocean phenomena that would be more easily influenced by interactions between the atmosphere and ocean whereas longer characteristic time scales suggest that bistability involves changes in deepwater ocean circulation. In addition to the correlation between PDO and ENSO phases over time you have the fact that the two are virtually identical in spatial distribution but for the fact that PDO is strongest in the North Pacific whereas ENSO is strongest in the Equatorial Pacific. But during their warm phases both are cool in the North Pacific and warm in the Equatorial Pacific. You can see this here: Figure 1 Warm Phase PDO and ENSO. http://cses.washington.edu/cig/figures/pdoensoglobe_BIG.gif... from: The Pacific Decadal Oscillation http://cses.washington.edu/cig/pnwc/aboutpdo.shtml So there is a bit more to go on than simply a temporal correlation between two scalar values. What we have is an areal and temporal correlation between two two-dimensional fields that vary over time. Essentially, over the entire area of an ENSO, the warm phase of the PDO would appear to result in constructive interference with the warm phases of ENSO and destructive interference with ENSO’s cool phases, whereas the cool phase of PDO results in deconstructive interference with the warm phases of ENSO and constructive interference with ENSO’s cool phases. So it shouldn’t be any surprise at all that El Ninos are typically stronger, longer and more frequent during the warm phase of PDO and La Ninas are typically stronger, longer and more frequent during the cool phase of PDO. Spatial destructive interference might also help to explain the existence of a lead-lag relationship where an El Nino will tend to cause the Pacific Decadal Oscillation to tip from its negative phase to its positive phase. Feedbacks, both positive and negative, are part of an integrated theory of ENSO put forward in: Chunzai Wang (March 2001) On the ENSO Mechanisms, Advances in Atmospheric Sciences (Special Issue) Such feedbacks no doubt result in much of the observed quasi-stability of PDO states and would help to explain the observed lead-lag relationship between El Nino and the Pacific Decadal Oscillation, e.g., an El Nino weakening or overwhelming the negative phase of the Pacific Decadal Oscillation, making it easier for the latter to switch to its positive phase. Positive feedbacks no doubt help to explain the quasi-stability of the two states of the Pacific Decadal Oscillation. An El Nino may weaken or even overwhelm the negative phase of the Pacific Decadal Oscillation, making it easier for the mode to slip from its negative phase to its positive phase. PDO lags ENSO on the scale of several months:
    ENSO also leads the PDO index by a few months throughout the year (Fig. 1d), most notably in winter and summer. Simultaneous correlation is lowest in November–March, consistent with Mantua et al. (1997). The lag of maximum correlation ranges from two months in summer (r ~ 0.7) to as much as five months by late winter (r ~ 0.6). Matthew Newman et al (1 Dec 2003) ENSO-Forced Variability of the Pacific Decadal Oscillation, Journal of Climate, Vol 16, No 23
    ... and several years:
    There is potential a lead-lag relationship between the time variability of PDV2(i.e., the PC time series of PDV2) and N34Var although it does not exceed a statistical significance test. Figure 5c shows the lagged correlations of N34Var with the PC of PDV2. Note that the thick line indicates the 95% significant level and negative lags indicate the N34Var preceding the PC of PDV2. The maximum correlation occurs at lags of approximately 3~4 years with positive correlation. This indicates that the N34Varleads the variability of PDV2, suggesting that the Pacific mean state, which is identified by the PDV2, is due to a residual associated with larger or small ENSO amplitude. Sang-Wook Yeh and Ben P. Kirtman (May, 2004) Pacific Decadal Variability and ENSO Amplitude Modulation
    0 0
  17. Timothy Chase: The difference in the multdecadal variability of ENSO (NINO3.4 SST anomalies as a proxy) and the PDO should be a function of North Pacific Sea Level Pressure, with the SLP altering the strength of the gyre spin-up into the KOE.
    0 0
  18. Bob Tisdale wrote:
    The difference in the multdecadal variability of ENSO (NINO3.4 SST anomalies as a proxy) and the PDO should be a function of North Pacific Sea Level Pressure...
    It's not eye balling as they use statistics, but you might be interested in Di Lorenzo et al. (2010 ) ENSO and the North Pacific Gyre Oscillation: an integrated view of Pacific decadal dynamics (presented at AGU 2010 Ocean Sciences Meeting) nevertheless.
    0 0
  19. dana1981 at 13, responding to thingadonta #3: "these 3 coupled periods (sun+-PDO) correspond better than c02 does in the 20th century...implying that climate sensitivity to c02 is low." Dana: "Sorry no, you don't calculate climate sensitivity by looking at correlations." That was my thought as well, Dana. "CO2 alone" is one of the more firmly agreed upon figures for climate sensitivity at 1C.
    0 0
  20. As far as I understand it, the point here is that the PDO-like the NAO & the AO-cannot actually *create* energy within the system-all they do is move that energy around. If that is the case, then the PDO can't really be a *cause* of warming-it must surely be responding to another source of energy entering the system.
    0 0
  21. Marcus, Consider a strong La Nina event. The atmosphere starts neutral and the ocean starts to warm. As the SST increases and the area affected also increases the atmosphere starts to warm from convective and latent heat transfers. In the 1998 event the average global temperature increased by more than 0.5C. That energy was not simply moved around the surface of the Earth. The La Nina did not create the energy, but it added energy to the surface and the atmosphere that wasn't at the surface before. So these events do add (or take) energy to the system. I will also add that MacDonald's study was a tree-ring study that used results during a mega-drought. I would much rather trust a corral reconstruction for something like SST's.
    0 0
  22. TIS "La Nina did not create the energy, but it added energy to the surface and the atmosphere that wasn't at the surface before. So these events do add (or take) energy to the system." That's just plainly untrue, as even a Spencer graph shows: Temperatures after the '98 el Nino were the same as they were going in. No net heat increase. Oscillations have no input to the trend.
    0 0
  23. The Inconvenient Skeptic wrote:
    In the 1998 event the average global temperature increased by more than 0.5C. That energy was not simply moved around the surface of the Earth. The La Nina did not create the energy, but it added energy to the surface and the atmosphere that wasn't at the surface before. So these events do add (or take) energy to the system.
    If one's idea of "the climate system" is limited to the first couple of meters of the atmosphere and the first few centimeters of ocean, then yes, of course these events can add energy to "the system." However I doubt that this is what Marcus was thinking of when he posted his comment. By "climate system" I would assume he meant at least the first ten kilometers of atmosphere and more importantly the ocean that extends well below those first 10 centimeters where the temperature of the ocean is usually measured. On average the ocean goes down to a depth of over 2.6 miles and at its deepest 6.85 miles -- and unless you've found a wormhole its a pretty safe bet that the only way the ocean is going to heat up is if the rate at which energy is entering the climate system through the top of the atmosphere is greater than the rate at which energy is leaving the climate system through the top of the atmosphere. This is called "radiation balance theory" since the only way energy is going to enter or leave is as radiation. It is a cornerstone of climate science. But in terms of the balance of energy you can think of it as the principle of conservation of energy -- which Marcus alluded to when he said that climate oscillations cannot create energy -- they can only move it about. We know of course that other than the ups and downs of the solar cycle solar irradiance has been flat to falling since at least 1962. So it doesn't look like what explains the net increase of energy in the system lies with the rate at which energy is entering the system. So we have to look at the other side of the equation: the rate at which energy leaves the system. And we have a pretty good idea of what is happening there. Now if you are a regular here you have undoubtedly run into the essay Did global warming stop in 1998? (intermediate) which shows that more than 20X as much of the excess heat that has entered the climate system has gone into the ocean. Sometimes some of that heat comes back to the surface -- but as Marcus points out the climate oscillation didn't create that heat. The temperature of the ocean is increasing, including the deep ocean. And in fact the ocean is where the vast majority of the heating is taking place. If you just look at the surface or the atmosphere you are harboring a rather superficial view of the climate system. If so, you should probably venture a little further away from land some time.
    0 0
  24. Yes, Muon & Timothy, the point I meant was that the various ocean oscillations move heat energy around-both from one part of the ocean to another, & also between the ocean & the surrounding atmosphere-& vice versa. The point is that this heat energy isn't being created out of nothing-its heat energy that has already been added from another source. As an example, the 1998 El Nino was simply releasing a large amount of stored heat from the oceans into the atmosphere-probably accumulated over the previous decade or two-it didn't *create* that heat. Hope that makes more sense.
    0 0
  25. An odd thought, while it's clear PDO (or AMO for that matter) cannot explain GW, could it relate to the speed of arctic amplification? This claim would base itself to the Bering strait flows, which at least in the summer are going mostly north for the warmer waters of the Pacific. Years back I thought that this PDO thing was somehow cleverly modified derivative of the overall GW signal, but looks like there is something else too, at least on regional (well continental) level. But still, if there's no predictive model there's not much use to an index.
    0 0
  26. TIS - Keep in mind, "It's just a jump to the left, then a step to the right". Oscillations don't add energy; they just move it around. The PDO is a redistribution, not an added amount of total energy such as we see in global warming.
    0 0
  27. Riccardo at 00:36 AM, frequency would only be irrelevant if the situation you originally described was the case, that being "Whatever the impact of one phase might be, the opposite phase would have the opposite effect and after a full cycle the system would be brought back to where it was at the beginning.", however that would be to assume opposite phases to be mirror images of each other. The PDO, or any other such ocean atmosphere systems are based around geographic distribution of warmer and cooler SST's, and the difference between each phase is the relative location of the warmer waters versus the cooler waters. In addition there is also the relative location to adjoining land masses. In addition, within each phase there is also a "front" and a "back" where the system also manifests itself in different ways. Perhaps the easiest way to illustrate this is to consider that what El-Nino means to those on the eastern rim of the Pacific is what La-Nina means to those on the western rim. What then has to be also taken into account is that the surface of the planet is an irregular surface, with a very uneven distribution of land masses, and different ocean conditions, meaning that when the systems change phase, the physical environment also alters which then influences how the system interacts with the local and adjoining regions, thus determining how it ultimately manifests itself, and how that then controls the liberation or conservation of heat as it transfers between the ocean and the atmosphere, which then feeds into whether the ocean is gaining or losing heat in that particular location, during that particular phase. If identical circumstances were in play at either side of each phase, then perhaps I could see how things may balance out. But I suspect that they are not, and if that means things do not return to balance as each cycle completes, then a changing frequency becomes relevant.
    0 0
  28. muoncounter (RE: 22) "Temperatures after the '98 el Nino were the same as they were going in. No net heat increase. Oscillations have no input to the trend." Why not? Why doesn't the increase in temperatures set off the 'positive feedbacks' and make temperatures go higher and stay higher? If water vapor and cloud feedbacks, which operate on the order of days to weeks (or even hours), are positive as claimed by the AGW hypothesis, why did the temperatures come back down so quickly? Also, please explain how global temperature spikes coming down so quickly, such as those that occur during el Nino events, is inconsistent with net negative feedback operating on the climate system?
    0 0
  29. RW1, The oscillations do not add energy to the system, but merely move it around. This is why global feedback effects are not relevant.
    0 0
  30. RW1: As I understand it, global temperatures peak sometime after the peak of the El Nino or La Nina they are associated with. That lag shows the effect of the El Nino or La Nina is not just the effect of the change of Sea Surface Temperatures on the global average. There must be a feed back involved. However, El Ninos,ie, the condition with warm tropical Pacific SSTs is associated with warmer global temperatures. In contrast, La Ninas, with their cool SSTs, are associated with cool global temperatures. Therefore the feedback must be positive. The most likely cause would be increased water vapour during El Nino's driving increased heat by an enhanced greenhouse effect, and decreased water vapour during La Ninas having the opposite effect. The effect is short lived because the conditions that drive the feedback are short lived. After the SSTs return to normal, water vapour levels return to normal, and with it the the variation in the greenhouse effect. This picture is at least partly complicated by cloud albedo effects, with temperature variations in Australia in particular being driven by cloud albedo rather than water vapour feedback. Denier's should be very worried about this pattern. IN 1997 an average 2 degree anomaly over less than one ninth of the Earth's surface caused a 0.5 degree excursion in the Global Mean Temperature. An equivalent excursion to a forcing causing a 1.2 degree increase in global temperatures (ie, a doubling of CO2) would cause a global temperature increase of between 2.7 and 8.1 degrees C. That is a very rough calculation of climate sensitivity, but it shows that appealing to El Ninos should give deniers no cause for comfort. The stronger the climate response to the EL Nino Southern Oscillation, the stronger the climate response to CO2 forcing.
    0 0
  31. Bibliovermis (RE: 29), "The oscillations do not add energy to the system, but merely move it around. This is why global feedback effects are not relevant." How do you figure? And how do you know that 'the oscillations', such as el Ninos, are not the result of energy being added to the system? The point is temperatures do spike and clouds and water vapor operate in response to temperature changes - do they not? If the feedback is positive in response to temperature increases, why doesn't that keep temperatures higher?
    0 0
  32. RW1: "If the feedback is positive in response to temperature increases, why doesn't that keep temperatures higher?" Assume an initial warming of the ocean has caused in increase in water vapour, and hence an enhanced greenhouse effect. The total amount of water vapour in the atmosphere will be the product of both the initial warming of the ocean, plus the feedback. If that initial warming is then removed by a change in the oscillation, the water vapour will now reduce to the amount appropriate for just the feedback warming. But that reduces the feedback, and hence the amount of water vapour, and so on. Consequently the temperature will relax back to the equilibrium state. The equilibrium state is determined by the balance of energy coming in by radiation from the sun, and the energy going out by IR radiation (along with energy flows between regions for regional temperatures).
    0 0
  33. Tom (RE: 30), "As I understand it, global temperatures peak sometime after the peak of the El Nino or La Nina they are associated with. That lag shows the effect of the El Nino or La Nina is not just the effect of the change of Sea Surface Temperatures on the global average. There must be a feed back involved." How do you figure a lag means there must be a feedback involved? Let alone positive feedback? "However, El Ninos,ie, the condition with warm tropical Pacific SSTs is associated with warmer global temperatures. In contrast, La Ninas, with their cool SSTs, are associated with cool global temperatures. Therefore the feedback must be positive. The most likely cause would be increased water vapour during El Nino's driving increased heat by an enhanced greenhouse effect, and decreased water vapour during La Ninas having the opposite effect. The effect is short lived because the conditions that drive the feedback are short lived. After the SSTs return to normal, water vapour levels return to normal, and with it the the variation in the greenhouse effect. This picture is at least partly complicated by cloud albedo effects, with temperature variations in Australia in particular being driven by cloud albedo rather than water vapour feedback. You're making an awfully lot of assumptions here. What causes the SST cooling and warming (i.e. what causes El Ninos and La Ninas?)? "Denier's should be very worried about this pattern. IN 1997 an average 2 degree anomaly over less than one ninth of the Earth's surface caused a 0.5 degree excursion in the Global Mean Temperature. An equivalent excursion to a forcing causing a 1.2 degree increase in global temperatures (ie, a doubling of CO2) would cause a global temperature increase of between 2.7 and 8.1 degrees C. That is a very rough calculation of climate sensitivity, but it shows that appealing to El Ninos should give deniers no cause for comfort. The stronger the climate response to the EL Nino Southern Oscillation, the stronger the climate response to CO2 forcing." Again, you're making a HUGE number of assumptions here. How do you know that the response of EL Nino SO wouldn't be even stronger if were not for negative feedbacks opposing it? If you claim a +2 C over about one third of the planet caused a 0.5 C global average warming, how is that consistent with positive feedback? One third of 2 C is 0.67 C - more than the 0.5 C that occurred.
    0 0
  34. Tom (RE: 32), "Assume an initial warming of the ocean has caused in increase in water vapour, and hence an enhanced greenhouse effect. The total amount of water vapour in the atmosphere will be the product of both the initial warming of the ocean, plus the feedback. If that initial warming is then removed by a change in the oscillation, the water vapour will now reduce to the amount appropriate for just the feedback warming. But that reduces the feedback, and hence the amount of water vapour, and so on. Consequently the temperature will relax back to the equilibrium state." I don't get it. I do understand that if an 'oscillation' causes an increase in temperature and then the 'oscillation' subsides or ceases, the temperature would decrease some, but I don't understand how with net positive feedback, why temperatures would decrease back to pre-oscillation - let alone decrease back so quickly. Furthermore, if a mere natural 'oscillation' can cause as much as a 0.5 C spike in global average temperatures in one year, why couldn't slower natural oscillations cause most of the 0.6 C warming in the 20th century?
    0 0
  35. RW1 > One third of 2 C is 0.67 C - more than the 0.5 C that occurred. He said "less than one ninth" not one third.
    0 0
  36. RW1 @33: "How do you figure a lag means there must be a feedback involved? Let alone positive feedback?" If it was not a feedback mechanism, the global temperature effects would exactly coincide with the temperature effects on the surface of the pacific ocean, and would equal the surface temperature effects on the tropical pacific divided by the area effected. As it happens, the maximum global temperature effect lags the maximum surface temperature effect in the Pacific, and is larger than the proportional change in SST. Because the global temperature response lags ENSO, the causal direction must be ENSO -> global temperature response, rather than the other way round. Hence, it is a feedback. "You're making an awfully lot of assumptions here. What causes the SST cooling and warming (i.e. what causes El Ninos and La Ninas?)?" No assumptions. The increase of globally averaged specific humidity with El Ninos (and decrease with La Ninas) is a well known phenomenon. The 1998 spike in humidity is as obvious as the spike in temperature. Further, the connection between high humidity and high temperatures is also well established by theory and observation. El Ninos and La Ninas are caused by variations in the strength of the Walker circulation, which are in turn driven by changes in the relative temperature between the Eastern and Western tropical pacific. So, the Walker circulation in effect acts as a feedback mechanism to that variation. What causes the initial variations is more dubious, with a number of factors implicated (and it is unlikely to be a single factor). "Again, you're making a HUGE number of assumptions here. How do you know that the response of EL Nino SO wouldn't be even stronger if were not for negative feedbacks opposing it? If you claim a +2 C over about one third of the planet caused a 0.5 C global average warming, how is that consistent with positive feedback? One third of 2 C is 0.67 C - more than the 0.5 C that occurred." Again, I know that it is a positive feedback because of the relative magnitude of the response. The maximum area affected by an El Nino is approximately one ninth of the Earth's surface. This excludes those parts of the Pacific that are cooled in an El Nino, which if included would weaken the calculated initial response (and hence strengthen the calculated feedback). The minimum area warmed is about 1/27th of the Earth's surface. It is difficult to estimate the total area warmed, but with very high confidence it lies between these two extremes. So, 2 degrees over one ninth of the Earth's surface, globally averaged is 0.22 degrees, much less than the 0.5 degree global increase. Hence the feedback must be positive. And that is the very conservative estimate, as it allows the maximum possible warming extent, and does not consider the cooling at other regions. Again the caveat, this is beer coaster mathematics, and only indicates ball parks. It is certainly accurate enough to show the sign of the feedback, but not accurate enough to narrow the magnitude significantly. None-the-less, the correlation does hold that the stronger the effect of ENSO on global temperatures, the stronger the positive feedback involved, and hence the stronger the positive feedback from CO2 induced warming. @ 34: Perhaps it will make it easier when you remember that a positive feedback enhances both warming from an initial warming, and cooling from an initial cooling. The return of Pacific SSTs to normal values after an El Nino is a cooling, of equal magnituded to the initial warming. It will therefore generate a cooling feedback of equal magnitude to the initial warming feedback, thus cancelling it out.
    0 0
  37. It should rather be the Interdecadal Pacific Oscillation -because it is a basin wide multidecadal phenomenon that acts through modulation of the intensity and frequency of ENSO. Cloud cover changes in the tropical and subtropical regions are most strongly influenced by sea surface temperature. SST is most strongly influenced by ENSO+PDO. Observational evidence shows cloud cover and optical depth decreasing following the great Pacific climate shift in 1976/1977 to the late 1990's and increasing thereafter (Burgmann et al 2008, Clements et al 2009, Norris 2005) - consistent with these multidecadal changes in SST. These changes are consistent with the trends of ERBS, ISCCP and HIRS radiative flux data showing a decreasing trend in reflected shortwave and an increase in emitted longwave from the mid 80's to the late 1990's. There seems to have been a decrease in Pacific cloud cover in the late 1970's and an increase in the late 1990's - which if you anywhere near accept the quantum of the satellite data dominated warming in the period. I do have a recent post here - http://judithcurry.com/2011/02/09/decadal-variability-of-clouds/
    0 0
  38. Tom Curtis wrote in 30:
    As I understand it, global temperatures peak sometime after the peak of the El Nino or La Nina they are associated with. That lag shows the effect of the El Nino or La Nina is not just the effect of the change of Sea Surface Temperatures on the global average. There must be a feed back involved.
    The strength of the El Nino is measured by temperature in the tropics. However, just because the temperature in the tropics begins to drop precipitously doesn't mean that the water from the El Nino is losing all of its heat to the atmosphere. The warm water spreads out, circulating beyond the tropics, raising the temperature of the ocean beyond the tropics (which figures into the average global land and ocean temperature) and increasing the surface area that is exposed to the atmosphere, raising the temperature of the atmosphere over the ocean, and due to atmospheric circulation raising the temperature of the atmosphere over land as well. We really aren't talking feedback at this point. Somewhat higher levels of water vapor? Sure. But for the full feedback and effects of this to be felt from a new forcing that forcing must be maintained over a substantial period of time. And the full rise in the levels of water vapor will take essentially the same length of time.
    0 0
  39. RW1 wrote in 28:
    "Temperatures after the '98 el Nino were the same as they were going in. No net heat increase. Oscillations have no input to the trend." Why not? Why doesn't the increase in temperatures set off the 'positive feedbacks' and make temperatures go higher and stay higher? If water vapor and cloud feedbacks, which operate on the order of days to weeks (or even hours), are positive as claimed by the AGW hypothesis, why did the temperatures come back down so quickly?
    Ok, you raise temperatures and this causes water to evaporate, and like the greenhouse gas that it is (as you can see here) it reduces the rate at which energy escapes the top of the atmosphere. Now what? The temperature isn't suddenly going to jump up to its Charney equilibrium. The warming due to greenhouse gases is the result of a net, small imbalance in rate at which energy in the form of radiation enters the system. Greenhouse gases -- such as water vapor -- will reduce the rate at which energy escapes to space, but the rise in temperature due to water vapor feedback would -- like the warming due to carbon dioxide -- take years. And likewise you won't have the full rise in water vapor from increased levels of carbon dioxide right away. Part of the increase in levels of water vapor in the atmosphere is a response to higher temperatures that are themselves the result of higher levels of water vapor. Unlike the spike in temperature that results from an El Nino, much of the carbon dioxide that we emit will remain in the atmosphere for years, decades and even millenia. Raise the temperature of an object and it will emit more radiation. The warm water of the El Nino emits thermal radiation a higher rate than cooler ocean water. But it doesn't reduce the rate at which energy leaves the system. Carbon dioxide does -- and it will continue to do so until the system warms up, increasing the rate at which radiation is emitted so that the system achieves equilibrium at a higher temperature. However, the equilibrium due to carbon dioxide alone is lower than the equilibrium of carbon dioxide plus water vapor. And if the system cools down due to the negative feedback where a warmer object emits more radiation, increasing the rate at which it cools (the Planck feedback) then this will bring temperatures down before temperature has the chance to rise significantly due to increased water vapor. When the temperature drops this reduces the humidity of saturation and the extra water vapor will fall out of the atmosphere in the form of precipitation. RW1 asked:
    Also, please explain how global temperature spikes coming down so quickly, such as those that occur during el Nino events, is inconsistent with net negative feedback operating on the climate system?
    It isn't. And you do have a negative feedback: Planck feedback. A hot object emits radiation proportional to the absolute temperature raised to the fourth power. That happens pretty much right away. Increased levels of carbon dioxide due to higher temperatures reducing the capacity of the ocean to hold carbon dioxide? That would take centuries. In the absence of a long-term forcing such as that due to the Milankovitch cycle or higher levels of carbon dioxide due to the emissions of some supervolcano Planck feedback wins. But once carbon dioxide is in the atmosphere much of it tends to stay there for a long time. Now you tell me: if you don't have the full water vapor, cloud or sea ice response to an increase in temperature until several decades after the imposition of a new forcing to the climate system, what does the rate at which at which the climate system cools off after an El Nino have to say about whether there is a net positive or negative feedback? Beyond the Planck feedback, whatever the feedback (water vapor, clouds or melting sea ice) it really hasn't had a chance to affect the system since such feedbacks result in only a small imbalance in radiation entering the system over radiation escaping the system and the heat content and temperature of the system will rise only gradually, significantly only if this imbalance is maintained.
    0 0
  40. RW1: "if a mere natural 'oscillation' can cause as much as a 0.5 C spike in global average temperatures in one year ... " Now you are making a major assumption with the contention that all of ENSO is an entirely natural oscillation. From Yeh et al 2009: Using calculations based on historical El Nin˜o indices, we find that projections of anthropogenic climate change are associated with an increased frequency of the CP-El Nin˜o compared to the EP-El Nin˜o. ... the occurrence ratio of CP-El Nin˜o/EP-El Nin˜o is projected to increase as much as five times under global warming. "why couldn't slower natural oscillations cause most of the 0.6 C warming in the 20th century? " Here you're assuming that such slow oscillations exist at all, let alone in sufficient amplitude to 'cause' any such change. Then you'd have to explain why 'slow' oscillations cause rapid temperature increase in a pattern that accelerates (increases in rate of change) towards the Arctic. It would be interesting indeed if you applied the same zeal that you've shown for testing forcing theory to Spencer's calculations referenced in the context of Figure 3 of this post. That would be the skeptical thing to do.
    0 0
  41. A Google Scholar search using the words "El Nino humidity" reveals a plethora of papers discussing the relationship.
    0 0
  42. Timothy Chase @39: "The temperature isn't suddenly going to jump up to its Charney equilibrium. The warming due to greenhouse gases is the result of a net, small imbalance in rate at which energy in the form of radiation enters the system. Greenhouse gases -- such as water vapor -- will reduce the rate at which energy escapes to space, but the rise in temperature due to water vapor feedback would -- like the warming due to carbon dioxide -- take years." A very good point, that I did not think of. (That's the advantage of not being an expert - I get to make silly mistakes every now and then.) However, I am still not happy with the story that the increase in mean global temperatures is just due to atmospheric heat transport from the warm El Nino waters. For a start, during El Ninos, the water surrounding Australia is cooler than normal, yet Australia tends to be hotter than normal. That is probably due to reduced cloud cover, but that means feedback effects can still be a significant factor.
    0 0
  43. Tom (RE: 36), "If it was not a feedback mechanism, the global temperature effects would exactly coincide with the temperature effects on the surface of the pacific ocean, and would equal the surface temperature effects on the tropical pacific divided by the area effected. As it happens, the maximum global temperature effect lags the maximum surface temperature effect in the Pacific, and is larger than the proportional change in SST. Because the global temperature response lags ENSO, the causal direction must be ENSO -> global temperature response, rather than the other way round. Hence, it is a feedback." What you are describing here is a Time Constant (a lag between an initial change and final effect) - not a feedback. Feedback is a separate mechanism that opposes or amplifies the change. "No assumptions. The increase of globally averaged specific humidity with El Ninos (and decrease with La Ninas) is a well known phenomenon. The 1998 spike in humidity is as obvious as the spike in temperature. Further, the connection between high humidity and high temperatures is also well established by theory and observation. El Ninos and La Ninas are caused by variations in the strength of the Walker circulation, which are in turn driven by changes in the relative temperature between the Eastern and Western tropical pacific. So, the Walker circulation in effect acts as a feedback mechanism to that variation. What causes the initial variations is more dubious, with a number of factors implicated (and it is unlikely to be a single factor)." Well, what causes the initial variations is the key, isn't? Is it an internal or external forcing? Again though, you're mistaking a Time Constant for a feedback mechanism. "Again, I know that it is a positive feedback because of the relative magnitude of the response. The maximum area affected by an El Nino is approximately one ninth of the Earth's surface. This excludes those parts of the Pacific that are cooled in an El Nino, which if included would weaken the calculated initial response (and hence strengthen the calculated feedback). The minimum area warmed is about 1/27th of the Earth's surface. It is difficult to estimate the total area warmed, but with very high confidence it lies between these two extremes. So, 2 degrees over one ninth of the Earth's surface, globally averaged is 0.22 degrees, much less than the 0.5 degree global increase. Hence the feedback must be positive. And that is the very conservative estimate, as it allows the maximum possible warming extent, and does not consider the cooling at other regions." But what percentage of the Earth's thermal mass is warmed? That's a more difficult question, but one that would need to be answered, especially since only 2/3rds of the planet is ocean and the ocean is most of the thermal mass. Also, the phenomenon doesn't seem well understood enough to know that the area you cite in the Pacific is solely responsible for the full globally averaged warming effect. "Again the caveat, this is beer coaster mathematics, and only indicates ball parks. It is certainly accurate enough to show the sign of the feedback, but not accurate enough to narrow the magnitude significantly. None-the-less, the correlation does hold that the stronger the effect of ENSO on global temperatures, the stronger the positive feedback involved, and hence the stronger the positive feedback from CO2 induced warming. @ 34: Perhaps it will make it easier when you remember that a positive feedback enhances both warming from an initial warming, and cooling from an initial cooling. The return of Pacific SSTs to normal values after an El Nino is a cooling, of equal magnituded to the initial warming. It will therefore generate a cooling feedback of equal magnitude to the initial warming feedback, thus cancelling it out." This doesn't make sense to me. A forcing that causes a warming and then ceases or fully subsides is not an equal and opposite cooling effect - it's a simply a cessation of the forcing that caused the warming. In order to get an equal and opposite effect, you would need a forcing that causes cooling below the initial state prior to the warming forcing. Positive feedback is defined as feedback that amplifies or reinforces change. If the feedback is net positive, in the case of warming, then the feedback causes more warming above and beyond the initial intrinsic warming. If or when the intrinsic warming stops, the amount of warming above and beyond from the feedback remains. Why doesn't the net positive feedback continue to amplify the remaining warming? Clearly this doesn't happen.
    0 0
  44. Below is an edited email that I sent to NOAA almost four years ago telling them that I thought that El Nino and La Nina were caused by the actions of methane hydrates. At the time I did not know that the name for the conversion of the organic bedrock "shale" via liquid CO 2 was called the "retorting of shale oil" and I got some other things- not so much wrong as incomplete. I had only been reading about the topic for about six months;but the basic theory that I put forth that El Nino and La Nina are probably cause by the heat trapping cabilbities of the hydrates must be looked into. The year 2007 is also the year i first started to contact bee researchers and the USDA to tell them our problem with the bees was formaldehyde gas in excess in our atmosphere due to rising levels of ethane which oxidzes to the deadly gases of formaldehyde and carbon monoxide before proceeding to CO2. Shortley thereafter the light bulb went on that our excess CO2 was from methane oxidation, not our cars and factories. Andrea Silverthorne ----- Original Message ----- From: "Newstar Realty" To: Sent: Monday, May 28, 2007 4:35 PM Subject: Re:New question and info > With all due respect, your answer stating that El Nino and La Nina have > been around since the 1500s is incorrect. I have in my possession > innumerable fishing studies, and stories including ones by our country, > done at the time, which say the El Nino that caused the first fish kill in > Peruvian and Ecuadorian waters, in the early seventies was the first one. > >The fishing had always been great there and in fact, the studies say, > starting in the early 1950s, with new fishing techniques, and boats sold > to the Peruvians by American fishing companies, the catch went straight > up, every year, increasing with such great vigor that just before the > first El Nino, the Peruvians were second only to the Japanese in seafood > production. Nothing in recorded memory happened to interfere, even > nominally, with the fishing in the area, prior to the first El Nino. > > There is one American report that directly addresses the scientific claim > that El Nino had been around before, and notes various studies and > historical reports, right up until an American, 1969 report, none of > which, the author points out, discuss El Nino, or any noticeable > warming -or cooling of waters off the coast of Peru and Ecuador - at all. > The author and fishing-scientist-expert politely and directly challenges > the other non fishing, scientists' version by saying that perhaps a > fisherman's El Nino and an atmospheric scientist's El Nino are not the > same. I agree. > > > Therefore, now you do not have old Peruvian fisherman rumors to "kick > around" and help you set aside looking for an answer to this, as you call > it - mysterious and spastic, now you see it, now you do not, unpredictable > as to timing, duration, frequency and strength, El Nino and La Nina > happening, you should look at gas hydrates and their behavior, because > they are out there in massive quantities, according to the oil companies, > and no where are they more massive than in the Western South Pacific area , where the El Nino and La Nina events occur, and they are doing what gas > hydrates do, when first formed in fresh water and then thrust into a > saline environment. > > >Recently, in 2006, British petrogeologists discovered that methane: will > only form its hydrate in fresh water; can not tolerate even the slightest > amount of salinity; retards the melting point of ice; likes its fresh > water bride a lot; chooses its hydrate as its preferred state; compresses > itself in volume 170% in its hydrate form; fights disassociation by taking > up heat from its surrounding water or sediment; and it can take up a > tremendous amount of heat, directly into the methane molecule that sits in > the middle of the ice, without disturbing it -up to 183 degrees > Centigrade. A whopping amount of heat. > >The oscillation theories that were proposed in 1926, and expounded on in > 1969, prior to the seventies El Nino, did not address the El Nino type > occurrences, and even today scientist trying to fit the theory to El Nino > and La Nina admit, they do not wholly explain El Nino and La Nina. And > they are not proven in any way According to many scientists; there are just too many missing pieces, > especially, as one scientist says the "monstrous" water temperature drops > during a La Nina. > >Briefly addressing La Nina, I have research and found stories and reports > that say that your assertions are wrong, especially the writings of the > Italian free lance journalist you have on line. First of all, he is out > right wrong about 1950; the terrible winter was 1948/1949. 1950 was a year > of great weather from coast to coast, with only a record violent > 'Nor'easter' spoiling it at the end of 1950, during Thanksgiving. There is > a lengthy description of the storm and what caused it, by atmospheric > scientists, and they do not talk about the South Pacific, only air masses > in over the Americas. There is an equally lengthy description of the > winter of 1948/49, and it also describes the cause, and it has nothing to > do with the South Pacific or the temperature of waters of the Central and > Latin American coast, according to scientist that observed it. >> > The behavior of gas hydrates, as they disassociate, can explain everything > about El Nino and La Nina- and - rogue waves. They have to expand back to > gas at 170 times its hydrate volume; therefore, they explode with great > force, when they finally blow, -“salt out”-slumping the land, creating > craters in the sea and a huge upwelling of water and heat. > > Conversely, while they are fighting disassociation, they take tremendous > amounts of heat out of the water. Huge craters have been discovered in > the area of the Statoil EOR recovery effort off of Norway in the North > Sea. They have caused many landslides in the Caspian Sea and other areas; > they collapsed an oil platform in 1985. They have many factors that > figure into just how fast they disassociate, and therefore, how much heat > they have accumulated, and sometimes, one explosion will then destabilize > others, which would fit the description of the many waves, with the long > wave length, that propagated off of South Africa, in an EOR recovery area > and then moved all the way across the Pacific. Sometimes, they do not > break in the water they break through to the atmosphere; in either case, > hot air; hot water, they will create divergent and strong winds and > currents, and in any case, whether in the water or air, they oxidize into > formaldehyde. In the ocean this depletes the oxygen that fish need and of > course you know what formaldehyde does to fish.
    0 0
  45. Tom Curtis wrote in 42:
    A very good point, that I did not think of. (That's the advantage of not being an expert - I get to make silly mistakes every now and then.)
    I make a fair number of mistakes, too. You have to be willing to make mistakes if you wish to learn since almost inevitably part of the process. And I am not an expert, either. Just a philosophy major turned computer programmer -- who will often preface what he is about to say with, "As I understand it..." Tom Curtis wrote in 42:
    However, I am still not happy with the story that the increase in mean global temperatures is just due to atmospheric heat transport from the warm El Nino waters. For a start, during El Ninos, the water surrounding Australia is cooler than normal, yet Australia tends to be hotter than normal. That is probably due to reduced cloud cover, but that means feedback effects can still be a significant factor.
    There are feedbacks, but they are part of the El Nino itself, not something that happens afterwards as some sort of lagged feedback that causes global temperatures to rise after the El Nino. One of the more interesting feedbacks is referred to as a clear sky "super greenhouse effect" that occurs over tropical ocean where downwelling radiation increases more rapidly than upwelling radiation -- which is a result of increased water vapor. Please see: Valero, F. P. J., W. D. Collins, P. Pilewskie, A. Bucholtz and P. J. Flatau (1997) Direct Radiometric Observations of the Water Vapor Greenhouse Effect Over the Equatorial Pacific Ocean, Science, 275, 1773–1776. From the abstract:
    Airborne radiometric measurements were used to determine tropospheric profiles of the clear sky greenhouse effect. At sea surface temperatures (SSTs) larger than 300 Kelvin, the clear sky water vapor greenhouse effect was found to increase with SST at a rate of 13 to 15 watts per square meter per Kelvin. Satellite measurements of infrared radiances and SSTs indicate that almost 52 percent of the tropical oceans between 20°N and 20°S are affected during all seasons. Current general circulation models suggest that the increase in the clear sky water vapor greenhouse effect with SST may have climatic effects on a planetary scale.
    ... and from the paper itself:
    Satellite studies (8–10) have found that for clear skies and SSTs above 298 °K, the spatial variation of Ga with SST, dGa/d(SST), exceeds the rate of increase of sea surface emission, ds(SST)4/d(SST) = 4σ(SST)3. For a tropical SST of 300 °K, 4σ(SST)3 ~ 6.1 W m-2K-1. This effect, termed the "super greenhouse effect" (11), occurs in both hemispheres during all seasons. It is also observed for interannual variations of Ga with SST during the El Nino in the tropical Pacific (12). Observations in the tropical Atlantic ocean (11) show that the clear sky downwelling infrared flux incident on the surface (Fa-) also increases faster than the surface emission with increasing SST. The net result is further warming of the surface, which in turn induces additional heating of the atmosphere column above.
    However, what you are describing is a bit different -- and in terms of the effects at least the inverse of what we see up in the Seattle area. In Seattle we have warmer waters just off the coast, but this is only over a thin strip of water. Cool air blows in off of the cooler than normal North Pacific Ocean. In the case of Australia, however, I believe what is happening is the result of a decrease in moist air convection. With less precipitation there is less evaporation and the moist air convection by which the surface normally loses much of its excess heat. The same thing is supposed to dry out the continental interiors in the decades to come. Land warms more quickly than ocean due to the differences in thermal inertia. Warmer ocean temperatures will imply a higher absolute humidity over the ocean surface and over land, but as temperatures are higher in the continental interiors the humidity of saturation will be still higher inland and during the summers the relative humidity will drop more as you move inland. Therefore there will be less precipitation and reduced moist air convection carrying heat away from the surface. Thus during the summer months, when you need the cooling effects of moist air convection the most, it will be reduced, causing temperatures to rise still further.
    0 0
  46. It might help if we know what the notation means, eh? From the essay:
    The greenhouse effect can be defined as ([equations] 8-10)
    Ga = σ(SST)4 - F+ ([equation] 1)
    According to the Stefan Boltzmann law, σ(SST)4 is the infrared black body emission by the surface at temperature SST, σ=5.67 X 10⁻⁸ Wm-2 K-4 is the Stefan Boltzmann constant, and F+ is the outgoing infrared radiation flux at the top of the atmosphere.
    0 0
  47. muoncounter (RE: 40), "Now you are making a major assumption with the contention that all of ENSO is an entirely natural oscillation. From Yeh et al 2009:" The conclusions in that paper are highly presumptuous given that relatively little is known about what actually causes ENSO to occur. I don't find them convincing at all. "Here you're assuming that such slow oscillations exist at all, let alone in sufficient amplitude to 'cause' any such change. Then you'd have to explain why 'slow' oscillations cause rapid temperature increase in a pattern that accelerates (increases in rate of change) towards the Arctic." Not really. All I'm saying is if natural oscillations (variations) can cause up to 0.5 C of temperature change in one year, why couldn't natural forces cause most of the 0.6 C of warming over the whole of 20th century? "It would be interesting indeed if you applied the same zeal that you've shown for testing forcing theory to Spencer's calculations referenced in the context of Figure 3 of this post. That would be the skeptical thing to do. I haven't yet read Spencer's post, but I will take a look at it and possibly comment. The bottom line, for me at least, is net positive feedback is an extraordinary claim that requires extraordinary proof, especially since solar energy is not amplified to anywhere near such an extent and since net negative feedback is far, far more logical for a system stable enough to support life as the Earth is.
    0 0
  48. The bottom line, for me at least, is net positive feedback is an extraordinary claim that requires extraordinary proof, especially since solar energy is not amplified to anywhere near such an extent
    Warmer air will hold more water vapor, regardless of the sources of warmth, and this is a large positive feedback that is not an "extraordinary claim", as it's been known for ages. The extraordinary claim is that negative feedbacks will be large enough to offset this and other (relatively minor) positive feedbacks.
    net negative feedback is far, far more logical for a system stable enough to support life as the Earth is.
    As it turns out, reality, including that described by physics and other sciences, is often "illogical" and unintuitive.
    0 0
  49. dhogaza (RE: 48), "Warmer air will hold more water vapor, regardless of the sources of warmth, and this is a large positive feedback that is not an "extraordinary claim", as it's been known for ages." I don't dispute that the water vapor feedback, by itself, is positive. But water vapor is tied directly to clouds and precipitation, which ultimately remove the water vapor from the air and return it to the surface. Forming clouds from the water vapor reflect incoming sunlight and precipitation is typically cooler than the surface, so both counter act negative feedbacks to water vapor. "The extraordinary claim is that negative feedbacks will be large enough to offset this and other (relatively minor) positive feedbacks." Virtually every natural system, micro or macro, is dominated by net negative feedback, especially those stable enough to support life. The human body is good example. When the internal body temperature starts to cool down, internal feedback mechanism kick in that warm it up and vice versa - keeping a relatively constant internal temperature. Net postive feedback is the extraordinary claim. "As it turns out, reality, including that described by physics and other sciences, is often "illogical" and unintuitive." Sometimes, yes, but highly doubtful in this case, especially given that varying incoming solar power is clearly opposed by the system rather than re-enforced and the response of the system to solar power is so much less.
    0 0
    Moderator Response: Fixed open italics tag.
  50. RW1: But water vapor is tied directly to clouds and precipitation, which ultimately remove the water vapor from the air and return it to the surface. Forming clouds from the water vapor reflect incoming sunlight and precipitation is typically cooler than the surface, so both counter act negative feedbacks to water vapor. Really! I thought water vapor was tied to temperature. As for clouds, those with small water droplets (lighter clouds) tend to reflect light while those with larger water droplets (darker clouds) tend to absorb more light. Am I wrong?
    0 0

1  2  Next

You need to be logged in to post a comment. Login via the left margin or if you're new, register here.


The Consensus Project Website

THE ESCALATOR

(free to republish)


© Copyright 2024 John Cook
Home | Translations | About Us | Privacy | Contact Us