Shakun et al. Clarify the CO2-Temperature Lag
Posted on 10 April 2012 by dana1981
A popular myth amongst climate 'skeptics' is that historically atmospheric CO2 levels have risen after temperature increases began, and therefore it's actually temperature increases that cause CO2 increases, and not vice-versa as basic climate science and physics would have us believe. To this point, the standard response to this myth has been that initial temperature increases have historically been caused by the Earth's orbital (Milankovitch) cycles, which in turn warm the oceans, causing them to release CO2, which in turn amplify the global warming. Thus while the initial warming hasn't historically been caused by CO2, CO2 has amplified the warming for thousands of subsequent years, and thus is still the principal control knob governing Earth's temperature.
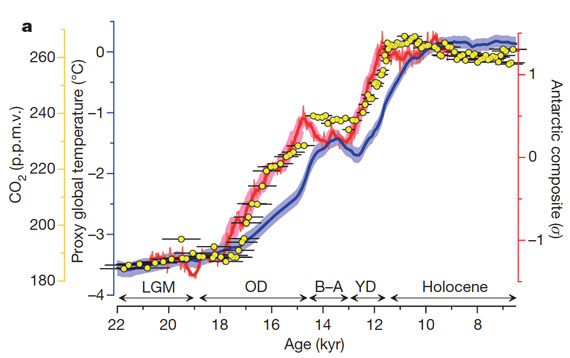
An intriguing new paper by Shakun et al. (2012) takes a more in-depth look at this particular myth. Many headlines have declared that Shakun et al. have demonstrated that CO2 has historically led (rather than lagged) global warming - the reality is a little more nuanced than that, but that is the basic take-home message. In Figure 1, the red line (Antarctic temperature) and yellow dots (atmospheric CO2) illustrate our previous unerstanding, while the blue line (global temperature) is the nuance added by Shakun et al.
Figure 1: The global proxy temperature stack (blue) as deviations from the early Holocene (11.5–6.5 kyr ago) mean, an Antarctic ice-core composite temperature record (red), and atmospheric CO2 concentration (yellow dots). The Holocene, Younger Dryas (YD), Bølling–Allerød (B–A), Oldest Dryas (OD) and Last Glacial Maximum (LGM) intervals are indicated. Error bars, 1-sigma; p.p.m.v. = parts per million by volume. Shakun et al. Figure 2a.
What did Shakun et al. Do?
The key to this myth is that it's based on Antarctic ice core records, which are not necessarily an accurate representation of global temperatures. In recent years there have been many studies collecting data from ice cores in Greenland, sediments drilled from the ocean floor and from continental lakes, and so forth. Most of these proxies don't extend as far back in time as the Antarctic ice cores, but many do extend back to the last glacial-interglacial transition which began approximately 18,000 years ago, as Figure 1 shows.
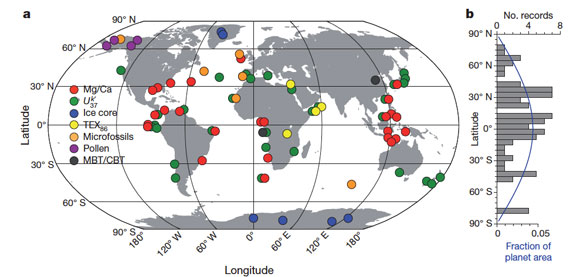
Shakun et al. examined 80 such proxy records from around the globe (Figure 2), recording sea surface temperatures for the marine records and surface air temperatures.
Figure 2: Proxy temperature records. a) Location map. CBT = cyclization ratio of branched tetraethers; MBT = methylation index of branched tetraethers; TEX86 = tetraether index of tetraethers consisting of 86 carbon atoms; Uk37 = 37, alkenone unsaturation index. b) Distribution of the records by latitude (grey histogram) and areal fraction of the planet in 5° steps (blue line). Shakun et al. Figure 1.
By comparing the atmospheric CO2 increase (note that since CO2 is well-mixed in the atmosphere, a single ice core record can be used as an accurate representation for CO2 - Shakun et al. used the Antarctic EPICA Dome C ice core for CO2 data) to these many different temperature records, Shakun et al. are able to discern whether the CO2 increase led or lagged temperature changes in various different geographic locations, and for the planet as a whole.
Does CO2 Lag or Lead?
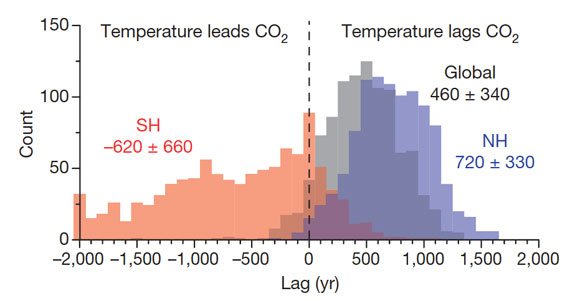
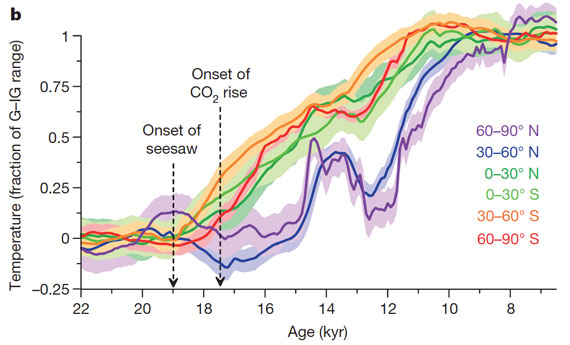
This is where it really gets interesting, because the answer is yes - CO2 lags and leads. In the Southern Hemisphere, Shakun et al. found that the temperature rise happened first, whereas in the Northern Hemisphere, the CO2 increase was first (Figures 3 and 4).
Figure 3: The phasing of CO2 concentration and temperature for the global (grey), Northern Hemisphere (NH; blue) and Southern Hemisphere (SH; red) proxy stacks based on lag correlations from 20–10 kyr ago in 1,000 Monte Carlo simulations. The mean and 1-sigma of the histograms are given. CO2 concentration leads the global temperature stack in 90% of the simulations and lags it in 6%. Shakun et al. Figure 2b.
Figure 4: Proxy temperature stacks for 30° latitude bands with 1-sigma uncertainties. The stacks have been normalized by the glacial–interglacial (G–IG) range in each time series to facilitate comparison. Shakun et al. Figure 5b.
What's Going On?
What appears to have happened, based on global climate model simulations run by Shakun et al., is not all that different from our previous explanation of the supposed CO2 lag - just a bit more nuanced.
- As we already knew, the Earth's orbital cycles trigger the initial warming (starting approximately 19,000 years ago), which is first reflected at the highest latitudes (i.e. Greenland and the Arctic - see "Onset of seesaw" in Figure 4).
- This Arctic warming melted large quantities of ice, causing fresh water to flood into the oceans.
- This influx of fresh water then disrupted the Atlantic meridional overturning circulation (AMOC), in turn causing a seesawing of heat between the hemispheres. The Southern Hemisphere and its oceans warmed first, starting about 18,000 years ago.
- The warming Southern Ocean then released CO2 into the atmosphere starting around 17,500 years ago, which in turn caused the entire planet to warm via the increased greenhouse effect.
In short, the initial warming was indeed triggered by the Milankovitch cycles, and that small amount of orbital cycle-caused warming eventually triggered the CO2 release, which caused most of the glacial-interglacial warming. So while CO2 did lag behind a small initial temperature change (which mostly occurred in the Southern Hemisphere), it led and was the primary driver behind most of the glacial-interglacial warming.
According to the Shakun et al. data, approximately 7% of the overall glacial-interglacial global temperature increase occurred before the CO2 rise, whereas 93% of the global warming followed the CO2 increase.
What Does Shakun Say About Climate Sensitivity?
Shakun et al. did not address the question of climate sensitivity in their paper. Readers may recall a paper by Schmittner et al. which used the glacial-interglacial transition to estimate climate sensitivity, and came up with an estimate (1.7–2.6°C with a best estimate of 2.3°C global surface warming in response to doubled CO2) towards the lower end of the IPCC range (2.0–4.5°C with a best estimate of 3°C). However, this lower estimate could mostly be attributed to Schmittner et al.'s low estimate of the glacial-interglacial temperature change, of just 2.6°C globally (most previous estimates put the value at around 5°C).
Shakun et al. estimate the global surface temperature change at approximately 4°C during the transition. A similar paper by many of the same authors recently published in the Proceedings of the National Academy of Science (Clark et al. 2012) estimates the greenhouse gas radiative forcing during the transition at approximately 2.5 Watts per square meter (W/m2), but neither Shakun nor Clark et al. estimated the total radiative forcing (including surface reflectivity changes, for example). Overall, the estimated temperature changes and radiative forcings are both slightly lower than in Hansen and Sato (2011) (Figure 5).
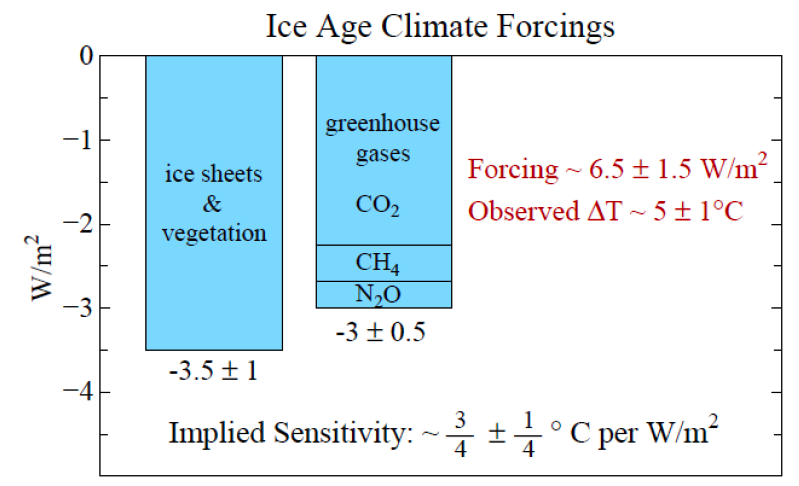
Figure 5: Climate forcings during the ice age 20,000 years ago relative to the pre-industrial Holocene from Hansen and Sato (2011)
Similar to the implied sensitivity in Hansen and Sato, a ~4°C global temperature change caused by a ~6 W/m2 forcing corresponds to a ~2.5°C sensitivity to doubled CO2. Note that this is a very rough estimate based on the Shakun and Clark results, but is within the IPCC climate sensitivity range.
Predictable Denial Reactions
Not surprisingly, since the 'CO2 lags temperature' myth is a climate denialist favorite (coming in at #12 on the most-used climate myths list), the reaction has predictably been one of, well, denial. WattsUpWithThat in particular has devoted several posts denying the results in the Shakun et al. paper. One such post quoting Don Easterbrook (of failed global cooling prediction fame) began with the following objection:
"1. They assume that CO2 is capable of causing climate changes..."
Need we continue? We could devote an entire post to the glaring errors from Easterbrook in this WUWT post, but let's not.
In the same post, Willis Eschenbach criticized the paper saying "My rule of thumb about these kinds of things is, no error bars … no science." However, Shakun et al. were quite explicit about the associated uncertainties throughout the paper (for example, see the uncertainty ranges depicted in Figures 1 and 4 above). Upon actually reading the paper, Eschenbach's criticism rings quite hollow.
Speaking of apparently not reading the paper before attacking it, a second WUWT post on Shakun et al. (also from Eschenbach) argued that their results are not valid because the glacial-interglacial warming occurred at different times in the different temperature proxies. But that is of course the point - the Southern Hemisphere warmed before the CO2 increase, while the Northern Hemisphere warmed after (as Figures 3 and 4 show). In looking for an excuse to reject this research, the denialists manage to miss the entire point of the paper.
In yet a third post, this one by Watts himself, Watts objects that Shakun et al. refuse to call orbital cycles the warming "trigger." This is a little bit silly, since the authors titled an entire section of their paper The trigger for deglacial warming, discussing that the first warming (of the Arctic 19,000 years ago) was indeed triggered by orbital cycles.
An Intriguing Result
The knee-jerk denial rejections of the Shakun et al. results reflect the inconvenience of their results for the climate "skeptics." The authors summarize their intriguing results, which expand upon our understanding of glacial-interglacial transitions.
"Lag correlations from 20–10 kyr ago suggest that the modelled global temperature lags CO2 concentration by 120 yr, which is within the uncertainty range of the proxy-based lag."
{...}
"Our global temperature stack and transient modelling point to CO2 as a key mechanism of global warming during the last deglaciation. Furthermore, our results support an interhemispheric seesawing of heat related to AMOC variability and suggest that these internal heat redistributions explain the lead of Antarctic temperature over CO2 while global temperature was in phase with or slightly lagged CO2."
Also see good coverage of this study by Climate Crocks, The Washington Post, and BBC.
Note: the Shakun et al. results have been incorporated into the CO2 lags temperature myth rebuttals.


 Arguments




On ScienceBits 21 April 2012 Nir Shaviv raised this objection to the Shakun et al. paper: "in order to recover their average "global" temperature, I needed to mix about 37% of their southern hemisphere temperature with 63% of their northern hemisphere temperature." So he is accusing them of deliberately manipulating the data by weighting it to get the result they wanted (ie that globally on average temperature lags CO2). I am interested in two aspects of this objection. 1) Is he correct, and if so how much does this compromise Shakun's results? 2) Assuming Shaviv is correct, would this mean that temperature does not lag CO2 only during the start of a period of warming (but it would during the mid and latter period), or would this apply across the entire period?
OneHappy, can you provide a link to Shaviv's methodology?
DSL: no method, little more than a blog post: http://www.sciencebits.com/Shakun_in_Nature
OneHappy @152, Shakun et al use 30 (37%) proxies from the SH, and 51 (63%) proxies from the NH. Because of the method used by Shakun et al, that does mean the global reconstruction is weighted in favour of NH temperatures. Further, in the SH, 13 (43%) proxies are extra-tropical, while 17 (57%) are tropical; whereas in the NH, 24 (47%) are tropical and 27 (53%) extra-tropical. As tropical areas cooled less than polar areas, that difference in weighting also means NH temperatures run warm (show less temperature difference between glacial and interglacial than do the SH temperatures). In fact, the proxies are predominantly (59 out of 81) from a band from 40 degrees north to 10 degrees south, and band that saw minimal temperature change relative to other parts of the planet. That may well have led to an underestimate of global temperature differences between glacial and interglacial.
How very odd that Shaviv did not comment on these other distortions, expecially given the importance of the later to his discussion of climate sensitivity.
The fact is that with a limited number of unevenly distributed proxies, no method will prevent some distortion. Focusing on just one of these (NH vs SH) is nto good science, it is simply (at best) a failure to recognize the issues involved.
That being said, the oddest thing is that Shaviv does not show a comparison between Shakun et al's global temperature reconstruction, and that obtained by averaging the hemispheres. Perhaps the reason is that when you compare them, you get this:
Does that look like deliberate manipulation to you? Or that it would compromise the results?
What it looks like to me is that Shakun et al took a reasonable approach (area weighing on grid cells) and that the difference between that and alternative approaches was so negligible that it was not worthwhile employing more complicated methods.
Thanks for your answer Tom. I'm impressed with the quick response. What you have written is a bit beyond me, but it looks like a good reply. I suspected the Shaviv objection was false. A lesson from this, it seems refutation of sceptical arguments can become a very complex business. This is the first time I've been out of my depth on the topic.
Hi! My questions above, from half a year ago, are too muddled and unclear. Just to fully understand the article's "What's going on?":
Complementary to what's going on when an ice age ended: What happened when an ice age was started by the Milankovitch cycle?
Hello everybody. I'm not sure this is the best place to ask my question, this topic is so old, but I try. Also please excuse my bad english.
I was wondering about this graph :
How is it that the increase in atmospheric CO2 levels is so far removed from the increase in global Earth temperature ? I estimate that there must be between 500 and 1000 years of difference; How is it possible ? Isn't CO2 once in the atmosphere supposed to immediately warm it up ?
And when we look at the curves about more recent times, scientists explain to us that the climate began to warm up from the start of the industrial area, we don't see a gap of several hundred years.
Do you have an explanation ?
DeeplyMoronic @158 :
Start by reading the article at the head of this thread.
Then read the advanced version of Climate Myth Number 12 (see top left, of this page.
DeeplyMoronic @158
I suspect that you misunderstands what "lag" is and how it is shown in the diagram you ask about.
First: It is not so simple that the horizontal displacement distance of the yellow curve and the blue curve is the time lag. The yellow 'curve' (collection of measurement points, rather than a curve) and the blue curve represents two quite different things (CO2 concentration vs temperature) and their respective scales are a bit arbitrary. They are selected to make the diagram easy to read with a glance. Imagine that the scale of the blue curve was selected so that it was much taller than the yellow curve. Then, if you assume that the horizontal distance was directly indicative of the lag, it would appear as the time delay was different, i e smaller. Just because of a change of scale.
Second: The concept 'lag' is a bit fuzzy. In this case we have one variable, representing a certain phenomenon, temperature, that depends on another variable , representing the phenomenon concentration of CO2. The temperature responds to changes in CO2 concentrations. This can be compared to signal theory where an out-signal responds to an in-signal. If the in-signal is a step then the out-signal is the step reponse. A typical step response starts immediately after the input but will take some time to reach its final value. In fact it will take some time before it's clearly visible - even if it really starts immediately.
See
https://en.wikipedia.org/wiki/Transient_response
and
https://en.wikipedia.org/wiki/Step_response
If the in-signal is not a perfect step (and in the real physical world it never is) then the response will look a bit more complicated and will take longer time to reach its final value.
Lots of physical system has this kind of behaviour. So in this case we have that when the CO2 concentration rather suddenly rises the temperature immediatly also start to rise, but the response takes quite a long time to finish. The climate is a very complicated physical system with all sorts of feedbacks and 'filter functions' involved so you should expect a diagram of past events to be a bit hard to read.
For our current situation we have a change in CO2 concentration that is not 'rather sudden' but very, very sudden. So we can expect that the temperature response will be visible a lot faster.
Lags are tricky in feedback-controlled systems. If one signal is 90 degrees out of phase with another, you can't really say one is leading or lagging over the other.
However, it's clear for the current interannual measure that CO2 lags the temperature shifts as T is clearly primarily seasonal and secondarily ENSO+AMO related. CO2 simply follows that temperature change via the outgassing relationship.
More problematic IMO is the belief that ENSO is a lagging indicator to shifts in prevailing winds, i.e. shifts in prevailing winds will trigger an El Nino event. One can argue that the winds are in fact a lagging indicator of the ENSO phase, with climatologists not able to accurately discriminate the two signals precisely enough. AFAIK there is only one article that has looked closely at this https://www.nature.com/articles/s41598-019-49678-w and they find that ENSO is initiated at the subsurface level (likely due to tidal cycles). The wind is a lagging indicator as the ENSO modified thermocline level creates spatially-resolved surface temperature variations, leading to atmospheric pressure gradients, and that's what drives the wind as it blows from regions of high pressure to low pressure. This happens dynamically so it explains why so many are fooled by this misguided correlation = causation attribution.