


 Arguments
Software
Resources
Comments
The Consensus Project
Translations
About
Support
Arguments
Software
Resources
Comments
The Consensus Project
Translations
About
Support
![]()
![]()
![]()
![]()
![]()
![]()
![]()
![]()
![]()
![]()


![]()


Latest Posts
- SkS Housekeeping: Updating the Comments Policy
- Skeptical Science New Research for Week #23 2026
- Nobody knows the future of energy
- Fact brief - Do electric vehicles almost always have a lower carbon footprint than gasoline-powered cars?
- Solar, wind, and EVs have knocked out a doomsday climate scenario
- 2026 SkS Weekly Climate Change & Global Warming News Roundup #22
- Skeptical Science New Research for Week #22 2026
- The next era of Atlantic hurricanes could be far more destructive
- On the death of RCP8.5
- RCP8.5 Update
- 2026 SkS Weekly Climate Change & Global Warming News Roundup #21
- Skeptical Science New Research for Week #21 2026
- What’s a ‘super El Niño’? And other El Niño questions, answered
- Fact brief - Does electromagnetic radiation from wind turbines pose a threat to human health?
- Five things you need to know about El Niño’s likely comeback
- 2026 SkS Weekly Climate Change & Global Warming News Roundup #20
- Skeptical Science New Research for Week #20 2026
- Higher warming predictions for 2026 and 2027
- A look back at ‘An Inconvenient Truth,’ 20 years later
- Two videos about the Atlantic Meriodonal Overturning Circulation (AMOC)
- 2026 SkS Weekly Climate Change & Global Warming News Roundup #19
- EGU2026 - Five days of virtual learning
- Skeptical Science New Research for Week #19 2026
- Climate Adam - Climate Change is Destroying Lives... Now
- EGU2026 - Presentation about the Skeptical Science Experiment
- Fact brief - Were the 2022 whale deaths off the US East Coast caused by offshore wind development?
- 2026 SkS Weekly Climate Change & Global Warming News Roundup #18
- Our new research is published - but we're not done yet with the 'Experiment'
- Skeptical Science New Research for Week #18 2026
- Wildfires used to ‘go to sleep’ at night. Climate change has them burning overtime
Comment Search Results
Search for Peter Ward
Comments matching the search Peter Ward:
- Trump just torched the basis for federal climate regulations. Here’s what it means.
nigelj at 12:31 PM on 26 February, 2026Bob Loblaw @ 02:00 AM on 26 February, 2026
BL: "What you describe for building codes is similar to what we have in Canada"
I have a vague recollection NZ actually modeled its building code on a combination of Canadas and Americas. Prior to about 1992 NZ didn't have a national building code as such. Local city councils had their own sets of rules on how houses had to be constructed. They did use the NZ standards which had been around for ages, and were effectively a national set of guidelines. But the net result is every city had its own building rules and they were all a bit different and confusing and they were very prescriptive.
In 1992 the government adopted a national building code with more of a performance based approach. Councils could not set local rules except in very limited circumstances. Its all been good but with some problems as well.
BL: "I had to get two permits and deal with two inspection processes: electrical, and everything else."
In NZ local city councils check drawings and issue building consents, and do all inspections including electrical. We are too small for regions. I think the sign off process has altered recently, I've lost track a bit.
BL: "When you say "signed off by Governments Cabinet", I assume that you mean the collection of ministers appointed by the Prime Minister (PM) to run the different government departments. (NZ is like Canada - following the Westminster system. We have an elected House of Commons, and an appointed Senate. It looks like you only have an elected house?)In practice, many decisions made within our government require sign-off by the Minister, but I don't think there are many (if any) that require sign-off by cabinet."
Yes we have the Westminster system. To be honest I'm not 100% sure whether something like a building code needs sign off by a minister or all of cabinet. I'm fairly sure some things need sign of by all of cabinet.
BL: "Some politicians and voters that disagree with government actions are convinced that the entire public service consists of partisan hacks working for the other political party......We're wandering much off-topic here, but to tie this back into the OP and what is happening in the US and the EPA, the US is devolving into a situation where large swaths of the "public" service are becoming political service."
I've only seen a very few people in NZ suggest the public service are partisan hacks. Generally appointments appear to be on merit. We certainly haven't had a leader like Trump making blatantly partisan appointments. But right now it would not be possible. The heads of public service departments are appointed by the Public Service Commissioner and his office. he PSC is appointed by the Governor General. NZ is still technically a monarchy. Politicians are consulted on appointments, but don't decide the appointments.
The problem is some of our conservative and right leaning politicians clearly admire some of what Trump has done. They don't embrace Trump like your conservative and right leaning politicians, but there is some leaning towards him particularly with Winston Peters of NZ First. But fortunately they would have a hell of a difficult job changing the system to allow them to make partisan appointments to the PS.
The thing with Trump is all he has to do is get personal control of the police and army by getting their loyalty, and he can do anything. I honestly think he's trying to do that, and ICE is the first move in that direction. Hopefully he's out of office before he can do this. Ok all getting a tad off topic. But Trump has such monumental influence I think its worth some discussion. I had decided to ignore reading about him in his second term, but hes inescapable. Agree with your views on him and his presidency.
- 2nd law of thermodynamics contradicts greenhouse theory
Bob Loblaw at 22:51 PM on 30 September, 2023Yes, the "explanations" that Likeitwarm prefers are indeed "the most screamingly laughable, unphysical explanations".
In comment 1606, Likeitwarm brings us back to the laughable paper by Peter Ward. Likeitwarm says:
Your radiated photons from all emitting gases carry wave length and amplitude dependent on temperature emitted from.
This repeats the laughable statements from Peter Ward, that attribute "amplitude" as a characteristic of radiation. Radiation does not have "amplitude". It has been over 100 years since physics addressed the issue of particle-wave duality in radiation. Radiation has attributes that can be described or explained by treating it as a particle, and radiation has attributes that can be described or explained by treating it as a wave - but in none of those scenarios does "amplitude" show up.
When Planck's Law calculates more energy at a specific wavelength or frequency from hotter objects, the increased energy comes from more photons, not higher amplitudes of waves. Every single photon that ever existed at a specific wavelength had exactly the same energy, regardless of when, where, or at what temperature the emission occurred. Any talk about "cold" and "hot" photons of the same wavelength is crank physics.
The "explanations" that Likeitwarm prefers are not simply "CO2 causes climate change science" denial, or even "climate science" denial - they are basic physics denial.
- 2nd law of thermodynamics contradicts greenhouse theory
Likeitwarm at 04:18 AM on 30 September, 20231600. Rob Honeycutt et al
I'll wear that name proudly!
I'm just looking for the most plausible reasons for climate change.
I have found a number of theories. You will call them all quackery because they are not your theory.
I like Peter Ward's. Scroll down the page you sent me and read Peter's responses to his challengers. He makes a lot of sense. His challengers did not prove him wrong, only disagreed with him.
What I find wrong with your version of the science is that you say the small amount(less than 8% of all IR from the surface) re-radiated IR from a colder part of the atmosphere causes warming of the surface per Trenberth chart. That cannot happen. Your radiated photons from all emitting gases carry wave length and amplitude dependent on temperature emitted from. Not enough energy to heat the surface there. Per Ward 2015 colder IR is reflected by warmer object, not destroyed.
Magically, your chart shows the down welling radiation is greater, almost double, than what the sun supplies. Satellites see 255k for the temperature that is radiated from about 5-6 km altitude, not from the surface. The surface is warmer, not from the GHE, but from gravity doing work on the atmosphere causing adiabatic heating. This is why near surface temperatures are ~33c warmer than Planck equations predict. That makes sense unlike the GHE raising the temperature that much.
There is no experiment showing co2 warms the atmosphere.
There is no measurement showing human emissions of co2 cause the recent warming.
All you have is a correlation that doesn't prove anything.
The extra UV-B radiation reaching the surface warms the ocean and the warmer ocean emits more co2 per Ward 2015 makes sense and he does have a correlation with ozone levels and temperatures. Read his paper I linked to.
I know you like labels, but get the label right.
It's "CO2 causes climate change science denier" not "climate science denier". - 2nd law of thermodynamics contradicts greenhouse theory
Rob Honeycutt at 04:11 AM on 28 September, 2023Likeitwarm... Well, I guess Peter Ward believes, in effect and contrary to conversion of energy, that energy can be destroyed.
Ward also claims, "...however, [ozone depletion] provides a much more detailed and precise explanation for changes in climate observed since the industrial revolution and throughout geologic history." And this us pure, unadulterated BS.
You might be interested to know that Ward is a Seismologist, not an an atmospheric scientist nor a physicist. He speaketh from an orafice unbecoming for a serious researcher.
- 2nd law of thermodynamics contradicts greenhouse theory
Bob Loblaw at 04:11 AM on 28 September, 2023FYI, there is a more complete debunking of Peter Ward's "theories" at this blog site:
https://hannahlab.org/climate-skeptics-peter-wards-ozone-depletion-theory/
- 2nd law of thermodynamics contradicts greenhouse theory
Likeitwarm at 02:56 AM on 28 September, 20231585. Rob Honeycutt
"what's it do? a u-turn?"
Ha! You're funny!
Not exactly a u-turn, but effectively.
Re-radiated IR cannot warm the surface according to Peter L Ward at the U.S. Geological Survey.
https://ozonedepletiontheory.info/wp-content/uploads/Papers/Ward2016OzoneDepletionExplains.pdf
He explains as follows:
"Thermal energy can only transfer
physically via resonance in this way from higher
amplitude to lower amplitude at a given frequency
and, through mechanical contact in matter, from
higher frequency to lower frequency, thus
explaining the second law of thermodynamics.
…
It is the
frequencies and amplitudes of these radiating
oscillations that, when absorbed by cooler matter,
increase the amplitudes and frequencies of the
internal oscillations of the absorbing matter,
thereby increasing the absorbing matter’s
temperature. It is these frequencies and amplitudes
that appear to be reflected, rather than absorbed,
by warmer matter [22]. When radiation has lower
amplitudes of oscillation at each frequency than
the prevailing amplitudes of oscillation within
receiving matter, heat cannot flow into the matter
by resonance, cooler to hotter. Therefore, by
conservation of energy, “colder” radiation must be
reflected. It can only flow away from the matter,
hotter to cooler. There is no physical way for
warmer matter to absorb “colder” radiation.
Resonance does not work in that direction. The
flow of thermal energy is all about the propagation
of a broad spectrum of oscillations in matter, in
space, and in gas molecules from higher
temperature to lower temperature." - There is no consensus
Eclectic at 18:27 PM on 10 September, 2023RicardoB @950 :
thank you for the link to Jordan Peterson's YouTube interview with Dr Judith Curry [made February 2023]. Thank you ~ sort of ~ but alas the video is one (1) hour plus 34 minutes long.
Warning. I didn't get much farther than 35 minutes into the video, before my patience ran out. Dr Curry seemed her usual rather vague & waffly self . . . a blend of half-truths & suggestive propaganda. [See my comments at post #949 , above.] If she or Dr Peterson have anything highly worthwhile to say in the remaining hour of the video ~ then please time-stamp it so I can go look at it.
Shortly before I gave up entirely, Curry at 38:40 said**: "at least over the next 3 decades, like the natural variability piece of this is pointing towards cooling ... [which] would tamp down the [CO2-caused warming]".
** My comment is that this is routine lawyer-advocate rhetoric coming from Curry ~ she has almost no evidence to support this "looming cooling" in the next 3 decades . . . but it sounds good to the gullible Denialist listener . . . and if real climate scientists challenged her, she would simply stand back and say (approx) "Oh I didn't say the world would cool, I just said the expected anthropogenic warming would/could/might be somewhat lower than the IPCC expects." [Which seems likely to be 0.5 degreesC hotter than 2023 ~ barring a sustained heavy asteroid bombardment.]
# At the start of his video : some minutes of Petersonian waffle ~ he may have (as a psychologist) some personal insight . . . but it seems to get overridden by his desire for limelight (such is his multi-year track record).
At 19:30 , Dr Jordan Peterson shows how little he knows about climate matters ~ fair enough ~ but why is he choosing to boost Dr Curry?
At 23:30 , Dr Curry makes vague & fluffy reference to cloud effects. And goes on to say: "we don't know how sensitive the climate is to increasing CO2"
At 24:35 , Curry goes on to suggest: "... the oceans and the sun that are the biggest sources of uncertainty in understanding what's going on ..."
RicardoB , you can see why I regard most of what comes out of Dr Curry's mouth as being very often slanted towards insinuations of a vague or semi-deniable type, well-suited as grist for Denialists.
But, if there's anything good in the last one (1) hour of the video . . . then let me know !
- It's the sun
Eclectic at 05:43 AM on 11 February, 2023Moderator @1305 [note: 3 additional scroll & clicks were required to reach Page 53 of Comments in this thread]
Thank you Bob, it likely my VPN "blocks" the video. But the VPN is not worth circumventing, if that video is by Curry and/or Peterson. As you say, both Dr Curry and Dr Peterson have poor track records.
(Personally, I have never seen either of them put forward an argument which invalidates the scientific evidence found in IPCC reports. Panhuang @1305 has a great deal of explaining to do. )
- The problem of growth in a finite world
One Planet Only Forever at 12:35 PM on 2 March, 2022Building on, and responding to, Peter Cook's comment @7,
A relevant related report is the following which was published in the Lancet on October of 2020 "Fertility, mortality, migration, and population scenarios for 195 countries and territories from 2017 to 2100: ..."
The report essentially presents the case that the population problem has been understood for a while now. And the report presents in detail how the population problem is being effectively dealt with, unlike the climate change impacts of the highest impacting portion of the global population.
The expected peak global population is less than 10 billion, and it is expected to be reached in the 2060s. Also, and more importantly, the report acknowledges that the achievement of the Sustainable Development Goals (established in 2015), will reduce the peak global population.
The highest impacting portion of the global population (primarily composed of Australians, Canadians and Americans along with a significant portion of the richer people in other nations like India and China) has not collectively responsibly responded through the past 30 years.
So this new report may help, but it is a little late to the game. I have not read it yet. I look forward to seeing if it refers to the above well established understanding about the successes to date on population limits and the importance of achieving the Sustainable Development Goals (which means global pursuit of leadership objectives like the USA Green New Deal, but more comprehensive than the Green New Deal). I will be particularly interested in seeing if it effectively identifies the problem as 'the highest consuming and highest impacting portion of the population'.
- CO2 was higher in the past
Postkey at 20:47 PM on 7 April, 2021Robert Murphy#46
"And that is true, except it says nothing at all about CO2 levels." From: 'The Undesigned Universe' - Peter Ward
“ . . . it>
62:26 is these ocean state changes that are
62:28 correlated with the great disasters of
62:30 the past impact can cause extinction but
62:35 it did so in our past only once that we
62:38 can tell whereas this has happened over
62:40 and over and over again we have
62:42 fifteen evidences times of mass
62:45 extinction in the past 500 million years
62:48 so the implications for the implications
62:51 the implications of the carbon dioxide
62:52 is really dangerous if you heat your
62:55 planet sufficiently to cause your Arctic
62:58 to melt if you cause the temperature
63:01 gradient between your tropics and your
63:03 Arctic to be reduced you risk going back
63:07 to a state that produces these hydrogen
63:11 sulfide pulses “ www.youtube.com/watch?v=Ako03Bjxv70 - Catching up with the Younger Dryas: do mass-extinctions always need impacts?
James Charles at 19:30 PM on 25 February, 2020The Undesigned Universe - Peter Ward
“ . . . it
62:26 is these ocean state changes that are
62:28 correlated with the great disasters of
62:30 the past impact can cause extinction but
62:35 it did so in our past only once that we
62:38 can tell whereas this has happened over
62:40 and over and over again we have
62:42 fifteen evidences times of mass
62:45 extinction in the past 500 million years
62:48 so the implications for the implications
62:51 the implications of the carbon dioxide
62:52 is really dangerous if you heat your
62:55 planet sufficiently to cause your Arctic
62:58 to melt if you cause the temperature
63:01 gradient between your tropics and your
63:03 Arctic to be reduced you risk going back
63:07 to a state that produces these hydrogen
63:11 sulfide pulses “ - Ice age predicted in the 70s
MA Rodger at 23:56 PM on 26 December, 2019Dave Evans @84,
The Wattsupian nonsense from Nov 2018 you ask about doesn't appear to have been de-bunked but the major slight-of-hand employed by the denialist-&-nonsense-author Angus MacFarlane has been de-bunked by SkS.
The Nov 2018 nonsense purports to itself de-bunk Peterson et al (2008) which is the main evidence base for the OP above. [The co-authors seem to have been overlooked by the OP above who call it Peterson 2008.] In directly challenging Peterson et al, the Wattsupian denier reclasifies 20% of the surveyed papers cited by Peterson et al (14 of the 66 re-assessed with 5 Peterson et al citations not assessed) and thus attempts to convert the result from 7 'cooling', 20 'neutral' and 44 'warming' into 16 'cooling', 19 'neutral' and 36 'warming'. This is not greating different and certainly does not support the contention that there was a scientific global cooling concensus during the 1970s.
To provide more fire-power, the Wattsupian denilaist adds extra citations to the survey - two which he found for himself (again not a level of evidence that would change the Peterson et al result) and an additional 117 papers gleaned from an earlier denialist attempt to debunk Peterson et al. It is only with this extra denialist fire-power from 2016 that anything like the number of citations can be obtained to overcome the Peterson et al result. This 2016 nonsense has been debunked in a two-park SkS post here & here.
The general nonsense in this 2016 denialist blather is possible best summed up by the denialistical use of the 1974 CIA document which considers the global food supply and within this considers climate as potentially a major factor. Global cooling is presented as a potential increase in risk to an adequate global food supply. There is no 'consensus' being waved that global cooling is expected. Instead they cite HH Lamb but ignore Lamb's view at that time in the mid-1970s that "On balance, the effects of increased carbon dioxide on climate is almost certainly in the direction of warming but is probably much smaller than the estimates which have commonly been accepted." As this may sound itself a little 'denialist' to modern ears, I should all that the 1977 book containing this quote had added into its 1984 preface:-
"It is to be noted here that there is no necessary contradiction between forecast expectations of (a) some renewed (or continuation of) slight cooling of world climate for some years to come, e.g. from volcanic or solar activity variations; (b) an abrupt warming due to the effect of increasing carbon dioxide, lasting some centuries until fossil fuels are exhausted and a while thereafter; and this followed in turn by (c) a glaciation lasting (like the previous ones) for many thousands of years.” [my bold]
The evidence-base for the CIA document is set out in its Annex II is based on the work of one scientist, Reid Bryson who did continue to find it beyond his abilities to accept the idea of AGW as a problem that needed tackling. So even though the 1974 CIA document runs with global cooling, a worst-case scenario, there is no scientific consensus backing it up.
The other study cited by the 2016 nonsense is Stewart & Glantz (1985) which talks of an emerging AGW-warming consensus but itself analyses the conclusions of a 1978 study on climate projection to the year 2000. This 1978 study would presumably have been advised by any 'cooling' concensus had such a thing existed in the mid-1970s. So their conclusions will be of interest:-
"The derived climate scenarios manifest a broad range of perceptions about possible temperature trends to the end of this century, but suggest as most likely a climate resembling the average for the past 30 years.- Collectively, the respondents tended to anticipate a slight global warming rather than a cooling. More specifically, their assessments pointed toward only one chance in five that, changes in average global temperatures will fall outside the range of -0.3°C to +0.6°C, although any temperature change was generally perceived as-being amplified in the higher latitudes of both hemiipheres."
So here the 1970s view was more towards 'warming' than 'cooling' although I note the 'warming' opinion prevailed as warming 1975-2000 was +0.5°C.
And today we see nothing but blather in that Nov 2018 Wattsupian whittering. It is ever thus there on the remote planetoid Wattsupia.
- Republicans call for 'innovation' to tackle climate change, but it's not magic
John S at 11:23 AM on 12 January, 2019Evan@2 absolutely it is time for individuals as well as governments to take action, but I’m glad you said “as well as governments” because individual action is not enough. I don’t own a car and live in a small apartment downtown; but if I needed a car, I couldn’t afford an electric one. That’s an example of a government policy we need to “pull” (as Dana said) the market so that ordinary folks who must drive can afford to do so cleanly. In this case, it’s the capital cost not the fuelling cost that is a barrier, so it is the prime example, often quoted by Marc Jaccard, where we need a policy in addition to carbon pricing, e.g. to incent, nudge, coax, coerce or whatever is needed to get the auto makers to put more affordable EV’s on the market (including for non-personal transportation, i.e. buses, trucks, trains, ships and mobile equipment for mining, construction, forestry and agriculture). Some might also say subsidize them; but that becomes a reverse Robin Hood, which the previous government in Ontario learned to regret.
At the same time, still give carbon pricing some credit for providing part of that incentive if it is designed well, by which I mean increasing every year transparently, predictably and significantly until the problem is solved. This gives all planners firm, forward numbers for business plans. (Yes, the social cost of carbon is a straw-man, often quoted by those opposed to carbon pricing. It’s an academic red herring – what we really want to get to is the price that nobody will pay – we don’t know what it is, but know we’ll reach it if we keep increasing sufficiently every year). And, yes, the price will (should) get quite high, which is another reason all the revenue must be distributed to citizens, otherwise politics will prevent the price rising sufficiently high.
nigelj@3 quite right the issue is not innovation or regulation; the issue is how to incent both deployment of existing alternatives (as Dana said) and innovative development and deployment of new. There are 3 basic methods: regulations, subsidies and carbon pricing. I prefer the latter and could doubtless annoy the moderator with the number of words by which I could describe the inevitable pitfalls of the other two, which is not to say some may never be needed and I gave what I believe is the prime example of one we need above, i.e. some type of mandated quota for producing and selling zero-emission EV’s.
OPOF@7 paragraph 4, an example of the social cost of carbon straw-man fallacy to criticize carbon pricing in the first sentence, then the rationale of what is actually the carbon fee and dividend strategy in the second. As James Hansen said ”As long as fossil fuels appear to be the cheapest fuels out there, they will continue to be burned”.
RedBaron@9 distribution of dividend is not a flaw but essential to secure political future proofing. It’s also ethically sound (check out “Who owns the sky – our common asset” by Peter Barnes (2001), which is where the idea came from).
Even supposing that siphoning off revenue to fund the green illusions of the government of the day would prove to be politically secure (which it wouldn’t so I am over-arguing here) the effective, efficient use of such “apparently free money” is highly questionable. As the old saying goes “governments can’t pick winners, but losers can pick government’s pockets”.
OPOF@10 paragraph 1, in agreeing with RedBaron@9 you are (both) totally missing the point that rising costs of fossil fuels (due to carbon pricing) puts a bull’s eye, so to speak, on every product and service that relies on fossil fuels (and not just in the energy sector) for entrepreneurs/intrapreneurs to target with better and cleaner alternatives and the rising carbon pricing schedule gives them invaluable competitive information to develop and deploy those alternatives.
But then the balance of your comments seems to agree with the ideas I expressed above with the additional twist that you seem to suggest diverting dividends that would go to the wealthy to other actions. And I don’t have a big problem with that; in fact, I’d suggest the “just transition”, e.g. re-training if necessary, those fossil workers not ready to retire. I’d leave the development and deployment of products and services, especially products, to those who know what they are doing and are honestly incented by the higher prices available, driven by carbon pricing.
nigelj@11 I generally find myself in agreement with most of your (very frequent) comments but here’s one I’d challenge (partly); that carbon pricing can do nothing about draw-down. Sure, it may be a government subsidy, but the prevailing carbon pricing schedule provides a good bench-mark e.g. alerting potential proponents to the value of certain possibilities. There may also be a role for off-sets.
OPOF@17 paragraph 3, “rich people can pay … investors still profit”; I’d like to, again, stress the impact of carbon pricing is not only on consumers but also, and more importantly, in my view, on the producers or providers of goods and services; e.g. rich people may still be willing to pay top $ to fly around, but the airlines will have invented clean ways to enable them to do that; e.g. non-fossil derived jet fuel from biomass via methanol.
nigelj@18, notwithstanding how I introduced my comment on nigelj11, here is another one – the big failing of cap and trade is that it does not provide a clear, transparent, long-term forward price, which is invaluable for planners and investors in all types of alternatives to fossil fuels.
- Burning coal may have caused Earth’s worst mass extinction
nigelj at 06:56 AM on 17 March, 2018Aleks @24, thank's for the comments.
"So, correct statement may be: “Burning coal is a culprit, but not CO2”.
I doubt that its that simple. It's entirely possible the extinction during the permain was a combination of global warming from CO2 and methane released by a combination of coal burning and very high levels of mass volcanic activity, along with the considerable ash clouds and sulphur oxides and other toxic material released by the coal. We know all the factors are dangerous for life and all could happen simultaneously, so its certainly plausible. The evidence points that way.
"At first, 2000 ppm is much less than 7000 in Cambrian or 4000 in Devonian period when both terrestrial and marine life was actively developing."
These high levels of atmospheric CO2 were reasonably constant over very long periods of tens to hundreds of millions of years, so species would adapt easly enough. The problem is a more sudden spike of CO2 that causes global warming over hundreds of years to thousands of years, maybe a few million years, and this is much harder for species to adapt to.
The Permian event was over a few thousands of years apparently and more important initiated quite suddenly. You can see from the graph in the Peter Ward article, and that other extinctions correlate with spikes in CO2 emissions in his graph.
"Secondly, the increase of temperature can be explained by the release of heat into the atmosphere during combustion, without resorting to the theory of greenhouse effect."
I doubt it. Provide a link to an explanation and full calculations.
"Third, the combustion of coal is accompanied by the release of toxic gases SO2, NOx, and CO that kill living things both directly and through acid rains (SO2 and NOx)."
Yes but see my comment above. This most probably combined with global warming.
"Finally, the death of marine organisms is due to acidification of seawater by dissolution of SO2 and NOx and it triggered by H2S."
CO2 also acidifies oceans. It's perfectly feasible that they all contributed.
I'm not a chemist, but I wasn't born yesterday.
- Burning coal may have caused Earth’s worst mass extinction
nigelj at 10:13 AM on 16 March, 2018MS thank's for that research paper.
It's pretty clear to me that there was a large increase of CO2 during the late permian. That is the most important thing, even if we dont know the exact ppm.
Sources of both volcanoes and coal make it pretty compelling to me. And it appears considerable methane was also released as well as sulphur oxides and volcanic ash etc. The period seems like a sort of hell on earth, and I dont think thats hyperbole.
This article is from Peter Ward, a reputable paleontologist, includes a graph with a huge spike in CO2 levels in the late permian. The graph also shows a remarkable correlation between multiple extinction events over millions of years and peaks of CO2 levels. I have no idea how correct this information is, but it's interesting, and he is not a crank or arm chair expert.
- There once was a polar bear – science vs the blogosphere
Matthew L at 10:57 AM on 2 December, 2017Jeff H. Please name the "deniers" you are referring to. The three names I put forward stress repeatedly that they fully buy into greenhouse gas global warming. However they do not agree with the established view that it is as rapid or likely to be as catastrophic as most articles on sites such as this. They put forward reasonable arguments and are far from extreme. So far the worst predictions of imminent catastrophe have failed to materialise. The longer the ice in the Arctic fails to melt away, the polar bears thrive, coral atols fail to sink and agricultural yields continue to grow the more convincing their arguments become and the less convincing are the predictions of disaster by the end of the century. I am still worried that the worst might happen and still read the science but am a lot less worried than I was 20 years ago when so many predictions of doom were made that have failed to come to pass. I notice you failed to respond to my comment on the tendancy towards self justification, and cognitive dissonance in the scientific community when predictions fail. Ever read the book "Mistakes were made (but not by me)"? I think you should. When you cry "wolf!" and predict catastrophe you had befter be very certain it will happen or you are not to lose all credibility. Professor Peter Wadhams was once a despected scientist...
- Global climate impacts of a potential volcanic eruption of Mount Agung
MA Rodger at 23:18 PM on 11 October, 2017Aleks @29.
You say:-
"However, speaking about "math model of greenhouse effect" I have meant not a global climate model, but a quantitative relationship between amount of greenhouse gas and temperature, at least for laboratory conditions when other factors are excluded."
Echoing nigelj @31, there are simplistic demonstrations that show that CO2 does absorb IR. This LINK shows a series of short YouTube videos of such experiments. The science which provides the detail of CO2's IR absorption is old and the literature listed HERE although much of it is sadly available publicly on-line only in abstract.
The mechanisms which result in increased CO2 raising global temperature are complex and cannot be reproduced within a laboratory. Indeed, it took science many decades to start to understand how CO2 effects global temperatures. (See this SkS POST describing an important part of the mechanism.) It would be akin to asking for a lab experiment to demonstrate specifically that the moon is responsible for the tidal effects witnessed in the English Channel. The proof would require either a full-sized experiment (which won't fit in a laboratory) or has to be calculated mathematically from data obtained in laboratory experiments.
And having been calculated mathematically, the big grown-up model that is then passed across to climatologists for use in their global climate models is HITRAN. (You would have noted mention of its little brother MODTRAN up-thread). It is HITRAN which allows calculation of global temperatures for different levels of the greenhouse gases.
And to again echo nigelj @31, no serious scientists and indeed no serious climate skeptic have issues with HITRAN. Those that do by acting as though HITRAN doesn't exist (like the Peter Ward you mention @26) are away with the faries and can be ignored.
- Global climate impacts of a potential volcanic eruption of Mount Agung
Eclectic at 08:10 AM on 11 October, 2017Aleks @26 ,
"thehill" article, by Peter Langdon Ward, is unmitigated garbage.
Unmitigated. Looney-tunes stuff. Bat excrement crazy.
Aleks, the good Mr Ward spouts so much garbage, that a rebuttal of his nonsense would take 20 very long paragraphs. Better, Aleks, if you start reading some of the Climate Myths (look on the top left part of the Home page here at SkS).
Education will soon show you how the word "reliable" and the name "P.L.Ward" cannot seriously be used in the same sentence.
- Hurricanes aren't linked to global warming
John Hartz at 02:38 AM on 12 September, 2017Over the past couple of weeks, I have posted links to the following articles about the climate change-hurricane connection on the SkS Facebook page.
Did Climate Change Intensify Hurricane Harvey? by Robinson Meyer, The Atlantic, Aug 27, 2017
Climate change did not “cause” Harvey, but it’s a huge part of the story by David Roberts, Energy & Environment, Vox, Aug 28, 2017
Could Hurricane Harvey Deal A Fatal Blow To Climate Change Skepticism? by Jared Keller, Pacific Standard, Aug 28, 2017
Harvey Shows How Planetary Winds Are Shifting by Eric Roston, Bloomberg News, Aug 30, 2017
Does Harvey Represent a New Normal for Hurricanes? by Robinson Meyer, The Atlantic, Aug 29, 2017
Katrina. Sandy. Harvey. The debate over climate and hurricanes is getting louder and louder by Chris Mooney, Energy & Environment, Washington Post, Aug 30, 2917
What Hurricane Harvey says about risk, climate and resilience by Andrew Dressler, Daniel Cohan & Katharine Hayhoe. The Conversation US, Sep 1, 2017
Three things we just learned about climate change and big storms: Can the lessons of Harvey save us? by Paul Rosenberg, Salon, Sep 4, 2017
Denying Hurricane Harvey’s climate links only worsens future suffering by Dana Nuccitelli, Climate Consensus - the 97%, Guardian, Sep 5, 2017
Harvey and climate change: why it won't change minds by Amy Harder, Axios, Sep 5, 2017
Hurricane Harvey's aftermath could see pioneering climate lawsuits, Analysis by Sebastien Malo, Thomson Reuters Foundation, Sep 5, 2017
On Climate, Hurricanes, And Growth by Joseph Majkut, Niskanen Center, Aug 31, 2017
First Harvey, now Irma. Why are so many hurricanes hitting the U.S.? by Nisikan Akpan, PBS News Hour, Sep 6, 2017
The science behind the U.S.’s strange hurricane ‘drought’ — and its sudden end by Chris Mooney, Energy & Environment, Washington Post, Sep 7, 2017
Hurricane Irma is one of the most powerful Atlantic hurricanes ever: what we know by Brian Resnick, Science & Health, Vox, Sep 7, 2017
6 Questions About Hurricane Irma, Harvey and Climate Change by Sabrina Shankman, InsideClimate News, Sep 6, 2017
President Trump, hurricanes Harvey and Irma are sending you a message, Opinion by Andrés Oppenheimer, Miami Herald, Sep 7, 2017
What We Know about the Climate Change–Hurricane Connection by Michael E. Mann, Thomas C. Peterson & Susan Joy Hassol, Scientific American, Sep 8, 2017
As Hurricanes Irma and Harvey Slam the U.S., Climate Deniers Remain Steadfast by Marianne Lavelle, InsideClimate News, Sep 8, 2017
Ask the Experts: How Did 2 Such Powerful Hurricanes Occur Back to Back? by Annie Sneed, Scientific American, Sep 7, 2017
Another Way Climate Change Might Make Hurricanes Worse by Faye Flam, Bloomberg News, Sep 8, 2017
Will Irma Finally Change the Way We Talk About Climate? by David Wallace-Wells, Daily Intelligencer, New York Magazine, Sep 9, 2017
Irma and Harvey lay the costs of climate change denial at Trump’s door by Bob Ward, The Observer/Guardian, Sep 9, 2017
Hurricane Irma Linked to Climate Change? For Some, a Very ‘Insensitive’ Question. by Lisa Friedman, Climate, New York Times, Sep 11, 2017
- New study shows worrisome signs for Greenland ice
Haze at 10:47 AM on 16 April, 2017This piece commences "As humans put more heat-trapping gases into the atmosphere, like carbon dioxide, ice around the planet melts. This melting can be a problem, particularly if the melting ice starts its life on land." In view of this it is surprising that a recently published paper claims the Antarctic Peninsula is cooling. This paper (Oliva, M., et al., Recent regional climate cooling on the Antarctic Peninsula and associated impacts on the cryosphere, Sci Total Environ (2016), http://dx.doi.org/10.1016/j.scitotenv.2016.12.030) states "from 1998 onward, a turning point has been observed in the evolution of mean annual air temperatures across the Antarctic Peninsula region, changing from a warming to a cooling trend,". This is not an isolated observation as others (Carrasco, J.F. 2013. Decadal changes in the near-surface air temperature in the western side of the Antarctic Peninsula. Atmospheric and Climate Sciences 3: 275-281). and Turner, J., et al 2016. Absence of 21st century warming on Antarctic Peninsula consistent with natural variability. Nature 535: 18645.} have also shown a decline in Antarctic Peninsula temperatures. Warming in the Antarctic has been claimed to be due to atmospheric C02 but it now seems that CO2 may in fact cause cooling in the Antarctic Peninsula (Holger Schmithusen, Justus Notholt, Gerd Konig-Langlo, Peter Lemke, Thomas Jung. How increasing CO2 leads to an increased negative greenhouse effect in Antarctica. Geophysical Research Letters, in press, 2015. doi: 10.1002/2015GL066749.)
- Climate Change – What We Knew and When We Knew It
ubrew12 at 14:45 PM on 22 February, 2017Dcrickett@2: Also on Peter Sinclairs 'climate crocks' website, I was fascinated by something pollster Ed Maibach said. After detailing the substantial public preference, as polled, for climate action in the U.S., he mentioned that the public, by and large, doesn't know that their neighbors hold the same opinions that they do (see at the 2 min mark of that articles video). They've been conditioned to 'suffer in silence' with their climate concerns, and not rock the boat. The fossil propaganda doesn't just preach against climate action, but encourages its believers to loudly proclaim that those who don't hold similar views are socialists or worse. So, to keep the peace, a majority of Americans simply hope somebody else will broach the subject, and never rise up to realize that all their friends and neighbors hold the same view. Here possibly is a way forward: destigmatize 'alarmism'. The message must be pushed that 'we are all alarmists now' (or, at least, a healthy 70% of us) and thus encourage people to end their climate silence.
- Caring for Creation makes the Christian case for climate action
Dikran Marsupial at 18:51 PM on 12 October, 2016nigelj "The Bible contains some genuinely good teachings, however it contains contradictions and mixed messages and sometimes lacks clarity, in my opinion."
It helps to remember that it wasn't written as a single book, but instead it is a collection of independent writings from authors who didn't necessarily agree with eachother on everything (e.g. Peter and Paul). The new testament wasn't "standardised" until the fourth century A.D. and today is an example of "the nice thing about standards is there are so many to choose from". The bible we have today is mostly a sixteenth/seventeenth century anthology. This also applies to Digby's comment, understanding the bible isn't that straightforward, and todays understanding is through the filter of nearly 2000 years of theology (some of which may well be deeply miguided). Having said which, my reading of the bible suggests that we should try to be understanding towards those that we percieve as misunderstanding it. ;o)
As I understand it, the same is true of the "Old Testament", only more so, which makes it even more difficult to intepret.
The issue of usury that Tom mentions is a good example of where unthinking attempts at rigorous adherence to the teaching has led to extreme injustice. Francis Bacon wrote an interesting essay "On Usury" which shows that people have been struggling between following Christian teachings and living in the real world for some time (with Bacon attempting a rational justification for regulated usury - nice to see that banking has sorted itself out so well between the reigns of the two queen Elizabeths ;o).
BTW I think the verses from Luke are no so much an instruction against usury, but that we can't expect much credit for acts that already bring us personal benefit. I.e. it is an exhortation to unselfish acts rather than a prohibition on personal gain.
- CERN CLOUD experiment proved cosmic rays are causing global warming
Tom Curtis at 21:45 PM on 2 August, 2016Aaron S @12:
1)
"I fail to see the connection between Earth's magnetic field, and the Sun's magnetic field. Are we are discussing climate relative to the sun's magnetic field deflecting Galactic Cosmic Rays? The Earth is something like a millionth the volume of the sun, and its magnetic field is weak regarding our solar system deflecticing Galactic Cosmic Rays."
From Scherer et al (2006):
"The Earth’s magnetic field shields us partly against galactic cosmic rays and solar
particles. The lower energy limit needed for a charged particle to cross the Earth’s
magnetosphere and access a specific position at the top of the atmosphere decreases
with the geomagnetic latitude of the observer, resulting in a cosmic ray flux on Earth
increasing poleward. The cosmic ray flux dependence on the geomagnetic latitude
was already observed shortly after World War II. Figure 28 represents the variation
of the flux of fast neutrons in the atmosphere with geomagnetic latitude measured
by Simpson (1951, 2000)."(My emphasis)
Fig 28:

Fairly obviously, if galactic cosmic rays where unaffected by the Earth's magnetic field, the variation of cosmic ray flux with geomagnetic latittude would be inexplicable. However, it is more interesting than that. To start with, according to Dunai (2010):
"Primary cosmic-ray particles with energies <10 GeV are modulated by the solar wind and by the Sun's 11-year solar activity cycle (Lal and Peters 1967, Eidelman et al. 2004). As a consequence of this modulation, galactic cosmic-ray particles with rigidities (see text box) smaller than 0.6 GV on average (Michel et al. 1996) cannot approach the Earth (at present the solar modulation potential parameter φ ranges from 0.3–1.2 GV, depending on solar activity; Michel et al. 1996, Masarik and Beer 1999, Usoskin et al. 2005, Wiedenbeck et al. 2005; see also Fig. 1.1).
Near-vertically incident particles dominate the primary cosmic-ray flux near the Earth's surface (Dorman et al. 1999; see also Section 1.3). Consequently, primary particles approaching the Earth's geomagnetic equator travel perpendicular to the geomagnetic field, whereas near the poles they travel essentially parallel to the magnetic field lines. Virtually all rigidities are permitted at the poles, while near the equator, rigidities well in excess of 10 GV are required to approach the Earth. The solar modulation limits the lowest energies at the poles to > 0.6 GV, having a consequence that the cosmic-ray flux does not increase monotonously approaching the poles, but levels off at rigidities close to the solar modulation potential (Fig. 1.4). Furthermore primary particles with energies close to the solar modulation potential are not energetic enough to generate a secondary particle cascade that can reach the surface. The resulting break in trend at high latitudes is referred to as the ‘latitude knee’. The decrease of the cosmic-ray flux with decreasing latitude below the latitude knee is sometimes referred to as the ‘latitude effect’."
(My emphasis)
In short, the rigidity induced by the Earth's magnetic field at the equator is approximatly 17 times that induced by the Sun, but while that induced by the Sun filters particles based on momentum equally regardless of terrestial location, the much larger terrestial rigidity at the equator falls to zero at the poles. That means in turn that the Laschamp event resulted in a large increase in bombardment of the Earth by galactic cosmic rays at the equator, but virtually zero effect at the poles. It also follows that the lack of climate perturbation at the Laschamp event represents a serious problem for the GCR/climate connection.
This point is proven by the close correlation between inverted Be10 production, and the strength of the Earth's geomagnetic field:

(Source)
2) Pursuing the effect of the Earth's magnetic field further, it means that if GCR do impact cloud albedo they will do so most strongly were the cut off rigidity is smallest. In fact, a map of the cut off rigidity should also be an inverse map of the strength of the effect:
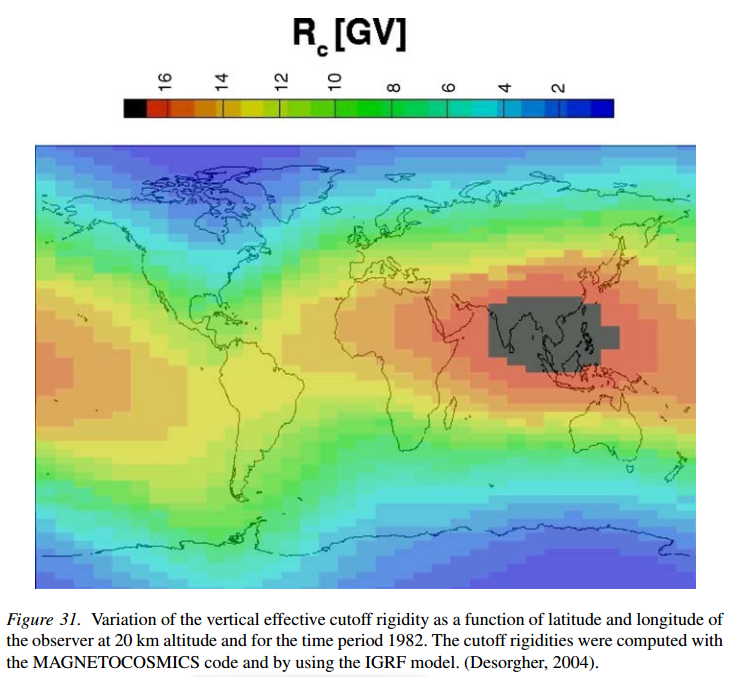
That creates further problems for the theory. First, it means the strongest effect is at the poles, ie, where clouds overly ice and snow so that any change of albedo in the clouds will have limited effect on the albedo fo the Earth. Second, because of the angle of incidence, insolation per square meter at the surface (or cloud top) varies approximately with the cosine of latitude - approaching zero at the poles. So, the strongest impact of GCR on cloud albedo (if there is one) will be located where it has minimal impact on the energy budget.
3) I passed without note above that the cut off rigidity due to solar effects varies from 0.3 to 1.2 GV over the solar cycle, ie, by a factor of 4. In contrast, TSI varied by 0.12% between the solar maximum of 1958 (the strongest on record) and the solar minimum of 2008 (the weakes recent minimum). That difference in effect means it is not reasonable to assume that the GCR effect on climate (if there is one) is a linear function of TSI. Unfortunately I know of no formulation be advocates of the theory of what the relationship will actuall by (other than an assumed linear relationship). If somebody does know of such a formulation, I would welcome a link to it. Absent a formulation, however, the 'theory' that GCR effect climate is no sufficiently advanced as to even quantify the forcing effect. Indeed, given that the strongest effect will be at the poles where the greenhouse effect of clouds is far more significant than their albedo (because of the albedo of the underlying snow and ice), it cannot even securely determine the sign of the effect. That means in scientific terms it is not yet a theory, but at best a hint as to how a theory might be developed.
4) Despite (3) above, I will follow standard practise in this case and use TSI as a proxy for TSI plus GCR forcing. I will justify this base on the fact that if TSI plus GCR forcing increases at less than a linear rate with respect to increases of TSI, any GCR effect will be minimal and largely irrelevant. If it increases at greater than a linear rate, that should exagerate the apparent effect of TSI on climate even more than is shown by the linear assumption. Failure of a significant correlation between TSI and temperature will therefore show that the GCR effect is either very weak, or rises at a less than linear rate with rising TSI (and therefore is self damping).
Given the above, here is the normalized running eleven year means of TSI and Global Means Surface Temperature (BEST LOTI) from 1850-2008:
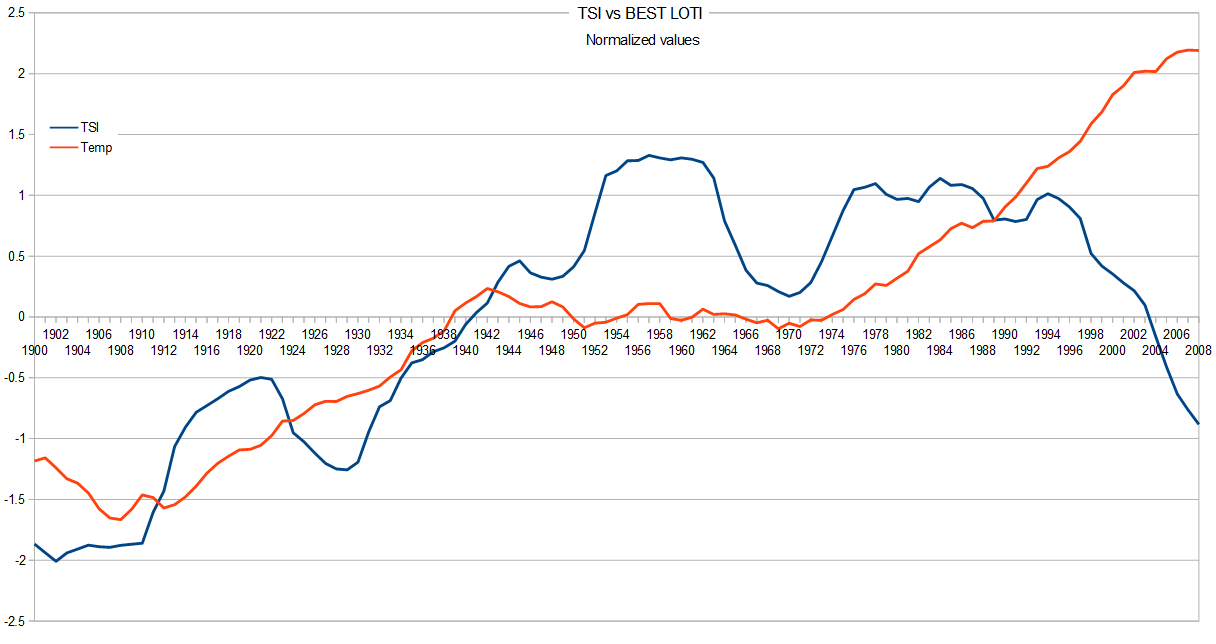
It is very clear that there is a poor correlation between the two. Indeed, the correlation between the unnormalized, annual values is just 0.416, with an r^2 of 0.173. Intuitively that means TSI explains 17.3% of the variation in temperature at most. Likely it explains much less once we allow for coincidental events and independence effects. For comparison, the correlation between CO2 concentration and the BEST LOTI (1850-2013) is 0.902, with an r^2 of 0.814.
- Surface Temperature or Satellite Brightness?
Tom Curtis at 13:43 PM on 16 January, 2016Some of you are undoubtedly already aware of the excellent video on satellite temperatures recently released by Peter Sinclair:
There is now some denier pushback against that video, led by the infamous James Delingpole, ;at Breitbart.
Some of the pushback (typically of Delingpole) is breathtaking in its dishonesty. For instance, he claims:
"This accuracy [of the satellite record] was acknowledged 25 years ago by NASA, which said that “satellite analysis of the upper atmosphere is more accurate, and should be adopted as the standard way to monitor temperature change.”
It turns out the basis of this claim, is not, however, a NASA report. Rather it was a report in the The Canberra Times on April 1st, 1990. Desite the date, it appears to be a serious account, but mistaken. That is because the only information published on the satellite record to that date was not a NASA report, but "Precise Monitoring of Global Temperature Trends" by Spencer and Christy, published, March 30th, 1990. That paper claims that:
"Our data suggest that high-precision atmospheric temperature monitoring is possible from satellite microwave radiometers. Because of their demonstrated stability and the global
coverage they provide, these radiometers should be made the standard for the monitoring of global atmospheric temperature anomalies since 1979."A scientific paper is not a "NASA report", and two scientists bignoting their own research does not constitute an endorsement by NASA. Citing that erronious newspaper column does, however, effectively launder the fact that Delingpole is merely citing Spencer and Christy to endorse Spencer and Christy.
Given the history of found inaccurracies in the UAH record since 1990 (see below), even if the newspaper column had been accurate, the "endorsement" would be tragically out of date. Indeed, given that history, the original claim by Spencer and Christy is shown to be mere hubris, and wildly in error.
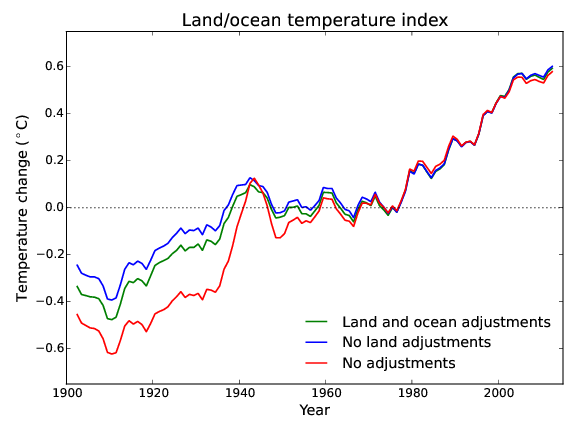
Delingpole goes on to speak of "the alarmists’ preference for the land- and sea-based temperature datasets which do show a warming trend – especially after the raw data has been adjusted in the right direction". What he carefully glosses over is that the combined land-ocean temperature adjustments reduce the trend relative to the raw data, and have minimal effect on the 1979 to current trend.
He then accuses the video of taking the line that "...the satellite records too have been subject to dishonest adjustments and that the satellites have given a misleading impression of global temperature because of the way their orbital position changes over time." That is odd given that the final, and longest say in the video is given to satellite temperature specialist Carl Mears, author of the RSS satellite temperature series, whose concluding point is that we should not ignore the satellite data, nor the surface data, but rather look at all the evidence (Not just at satellite data from 1998 onwards). With regard to Spencer and Christy, Andrew Dessler says (4:00):
"I don't want to bash them because everybody makes mistakes, and I presume everybody is being honest..."
Yet Delingpole finds contrary to this direct statement that the attempt is to portray the adjutments as dishonest.
Delingpoles claim is a bit like saying silent movies depict the keystone cops as being corrupt. The history of adjustments at UAH show Spencer and Christy to be often overconfident in their product, and to have made a series of errors in their calculations, but not to be dishonest.
The nest cannard is that satellites are confirmed by independent data, in balloons - a claim effectively punctured by Tamino:

Finally, Delingpole gives an extensive quote from John Christy:
"There are too many problems with the video on which to comment, but here are a few.
First, the satellite problems mentioned here were dealt with 10 to 20 years ago. Second, the main product we use now for greenhouse model validation is the temperature of the Mid-Troposphere (TMT) which was not erroneously impacted by these problems.
The vertical “fall” and east-west “drift” of the spacecraft are two aspects of the same phenomenon – orbital decay.
The real confirmation bias brought up by these folks to smear us is held by them. They are the ones ignoring information to suit their world view. Do they ever say that, unlike the surface data, the satellite datasets can be checked by a completely independent system – balloons? Do they ever say that one of the main corrections for time-of-day (east-west) drift is to remove spurious WARMING after 2000? Do they ever say that the important adjustment to address the variations caused by solar-shadowing effects on the spacecraft is to remove a spurious WARMING? Do they ever say that the adjustments were within the margin of error?"
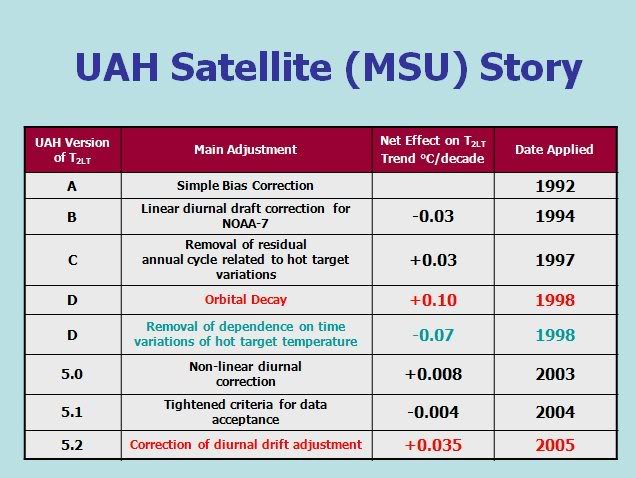
Here is the history of UAH satellite temperature adjustments to 2005:
Since then we have had additional corrections:
- 5.2: Eliminate NOAA 16 data, +0.01 C/decade; Dec 2006
- 5.2: Discovered previous correction eliminated NOAA 15 by mistake, unknown amount; Dec 2006
- 5.2 Switch from annual to monthly anomaly period baseline, +0.002 C/decade; July 2009
- 5.5 Eliminate AQUA data, + 0.001 C/decade
There were also changes from version 5.2 to 5.3, 5.3 to 5.4 and 5.5 to 5.6 which did not effect the trend. Finally we have the (currently provisional) change from 5.6 to 6.0:
- 6.0, Adjust channels used in determining TLT, -0.026 C/decade; April, 2015
Against that record we can check Christy's claims. First, he claims the problems were dealt with 10-20 years ago. That, of course, assumes the corrections made fixed the problem, ie, that the adjustments were accurate. As he vehemently denies the possibility that surface temperature records are accurate, he is hardly entitled to that assumption. Further, given that it took three tries to correct the diurnal drift problem, and a further diurnal drift adjustment was made in 2007 (not trend effect mentioned), that hardly inspires confidence. (The 2007 adjustment did not represent a change in method, but rather reflects a change in the behaviour of the satellites, so it does not falsify the claim about when the problem was dealt with.)
Second, while they may now do model validation against TMT, comparisons with the surface product are done with TLT - so that represents an evasion.
Third, satellite decay and diurnal drift may be closely related problems but that is how they are consistently portrayed in the video. Moreover, given that they are so closely related it begs the question as to why a correction for the first (Version D above) was not made until four years after the first correction for the second.
Moving into his Gish gallop we have balloons (see link to, and image from Tamino above). Next he mentions two adjustments that reduce the trend (remove spurious warming), with the suggestion that the failure to mention that the adjustments reduce the trend somehow invalidates the criticism. I'm not sure I follow his logic in making a point of adjustments in the direction that suites his biases. I do note the massive irony given the repeated portrayal of adjustments to the global land ocean temperture record as increasing the trend relative to raw data when in fact it does the reverse.
Finally, he mentions that the adjustments fall within the margin of error (0.05 C per decade). First, that is not true of all adjustments, with two adjustments (both implimented in version D) exceding the margin of error. Second, the accumulative adjustment to date, including version 6.0, results in a 0.056 C/decade increase in the trend. That is, accumulative adjustments to date exceed the margin of error. Excluding the version 6 adjustments (which really change the product by using a different profile of the atmosphere), they exceeded the margin of error by 38% for version 5.2 and by 64% for version 5.6 (as best as I can figure). If the suggestion is that adjustments have not significantly altered the estimated trend, it is simply wrong. Given that Christy is responsible (with Spencer) for this product, there is not excuse for such a mistatement.
To summarize, the pushback against the video consists of a smorgazbord of innacurate statements, strawman presentations of the contents of the video, and misdirection. Standard Delingpole (and unfortunately, Christy) fare.
- Eight things we learned from the pope's climate change encyclical
SkepticalinCanada at 00:14 AM on 21 June, 2015As this site is about evidence, and given the comments about overpopulation, I believe that it is entirely on topic to ask these questions, especially as the evidence I have asked for regarding carrying capacity has remained unanswered. Without evidence, it is a myth, or at least a fiction, that the planet is not already overpopulated, and that adding even more people will not increase the rate of extinction of other species and exacerbate all the other problems created by sheer human numbers.
1. At what level of total impact/total consumption/total production of waste (pick the metric) is our current population sustainable? Please quantify.
2. What will be the impact on that total if we add another 3 billion people to the human population?
3. What is the evidence that Herman Daly's projection of about 2 billion people being approximately the sustainable population level is incorrect?
4. What is the evidence that our agricultural practices, fossil-fuel dependent or not, are sustainable (see my reference earlier to Peter Salonius and "The Ten Thousand Year Misunderstanding)?
5. There is a focus amongst some on the habits of the highest consumers (and I don't disagree that it is an enormous problem), but what is the mechanism whereby we can reduce their consumption, and what impact will that have on the sustainable human population level? Please quantify.
If I forget humility for some reason and start to believe that humans are somehow special, unique, and moral, I go back to Lovelock's comment to the effect that humans are no more qualified to be stewards of the planet than goats are to be gardeners, and Eliot's comment that most of the evil in this world is done by people with good intentions.
- Lomborg: a detailed citation analysis
PhilippeChantreau at 12:18 PM on 26 April, 2015Peter Lloyd, you're wrong. This is entirely about Lomborg's work. It is about his publications, how much they have been cited, how relevant they are to the debate. It is about how misleading and how damaging his work has been. The comment just above is about the miserable lack of knowledge demonstrated in chapters of Lomborgs book in which Daniel has expertise. The comment above that one says nothing about the person and is somewhat off topic. The previous one (16) states that Lomborg leans a certain way in the debate considered and was likely chosen because of that. How does it attack the person? Lomborg advertises his convictions loud enough that stating them here is hardly a personal attack. The previous comment (15) argues the merits of the entire premise behind Lomborg's argument and others similar in reasoning. Above that we are a little more on topic, which is Lomborg's true qualifications for the position he was awarded. These are a rather objective matter, especially when considered through the normal means used to assess such qualifications. One can be whoefully unqualified for something and still be a nice person. Stating that they are not qualified does not constitute a personnal attack. Your statement has no basis whatsoever.
- Permafrost feedback update 2015: is it good or bad news?
billthefrog at 03:25 AM on 26 April, 2015Andy,
Thanks for the very informative article.
Can I ask a question concerning the level of credence that is currently being given to the views of Peter Wadhams - and his colleagues on the Arctic Methane Emergency Group - as they pertain to this very topic? As far as I can tell from my (very) limited viewpoint, he seems to represent the more apocalyptic end of the clathrate release spectrum, with, perhaps, David Archer at the other. There was an SkS article about 2 years ago by Chris Colose which seemed to suggest this divergence in viewpoint, but I don't know if perspectives within the broad scientific community have changed much in the interim.
I know that PW went very much out on a limb when he expressed the view that September levels of Arctic Sea Ice could be effectively gone by 2015. (He had elsewhere suggested the figure might be 2016 +/- 3 years, but, since we're in 2015, let's go with that version.) Not many people bought into this particular scenario, and, let's not be coy about this, it did provide a pretty soft target for the "it's not happening" brigade. The "official" AMEG line has softened (unsurprisingly) since PW made his claim back in 2012, and now simply states that...
"The tipping point for the Arctic sea ice has already passed"
However, and rather confusingly, about 2 lines further down on the AMEG home page, it goes on to state that...
"The meltdown is accelerating and could become unstoppable as early as Sept 2015"
Now, just because PW took an extreme view on Arctic Sea Ice, that doesn't necessarily brand him forevermore as "the boy who cried 'wolf!'" Hence my question about whether his views on methane release are still considered pretty extreme, or whether they're merely at the other end of a perfectly feasible probability range.
Cheers Bill F
- There's no empirical evidence
Tom Curtis at 09:31 AM on 25 April, 2015MA Rodger @280:
"This strongly suggests that the marked trashing of eco-systems over that period has not altered "ecosystem services" to any significant extent on a global scale."
Exactly!
Indeed, RedBaron's thesis is intrinsically implausible in that it requires biosphere sequestration of CO2 (by an unaltered biosphere) would go from just matching preindustrial LUC (at best) to matching industrial era emissions with a few years lag at most. It is thoroughly implausible that so sensitive a feedback mechanism would not either act as an inexorable pump of CO2 levels down to far below preindustrial levels, or result in wild fluctuations in CO2 levels on an annual and decadal basis. As neither has happened, presumably the feedback mechanism is slow, as is indicated by all the data.
Indeed, that is what we should expect. In principle, the Net Ecosystem Productivity (ie, the rate of Carbon sequestration) of an undisturbed forest will approximate to the rate of formation of coal. That is, it will be effectively zero. Immediately after it is massively disturbed, as by clear felling, it will become a carbon source, but will then become a large carbon sink with regrowth. However, within a few years or decades (depending on the rate of growth of the trees), it will decline as a sink, and approach the rate of sequestration of the formation of coal over time (if completely undisturbed). (See here, and also here.)
This pattern also applies to grasslands, with a possible (but not demonstrated by RedBaron) ongoing and slightly higher rate of sequestration due to the accumulation of soil carbon. Even there, however, carbon accumulation in soil is dependent on the rate of bioturbation, which implies such carbon soil carbon is outgassed at some rate depending on the rate of bioturbation at a given level. From that in turn it follows that even soil carbon will reach net zero sequestration given mature conditions, with a slight excess of sequestration if the soil is buried by sediment, and a slight excess of emission if it is eroded.
This pattern also means you cannot project high rates of initial sequestration in ecosystem reclamation projects (as in his linked article @278) forward as an expected sustainable rate. It will peter out rapidly for grasslands (excluding sequestration in soil), and over a few decades for forest. Soil sequestration will peter out more slowly, but will itself reach equilibrium over time.
The upshot is that the high rate of biosphere sequestration we see now is a consequence of prior degredations. Absent the regrowth of northern forests (particularly in the USA), it would be much smaller.
- Global warming hiatus explained and it's not good news
DMarshall at 12:14 PM on 21 April, 2015@Peter Carson
A certain well-known, heavily-trafficked "contrarian" site had a lively discussion about 3 years ago regarding undersea volcanos and ENSO.
The overwhelming "consensus" was that it ha zero-to-minimal impact.
When you find yourself putting forward an idea that NEITHER side of a polarized debate finds plausible, you're either about to overturn an entire field of study or - more likely - are treading on razor-thin basalt. - It hasn't warmed since 1998
DSL at 00:21 AM on 7 April, 2015Peter: "So my question is, if the pause continues, how many years must pass before it’s conceded that “something is fundamentally wrong with our climate models”? In other words, if the pause continues for n years then can that then be classed as a falsifiable criterion for AGW?"
Peter, let's not be ham-fisted about this, eh? The greenhouse effect is extremely well-established. It's been directly measured from the surface. And I don't think you want to argue that humans aren't responsible for most, if not all, of the increase in atmospheric CO2 over the last century. The general theory of AGW is not going to be falsified by the trend in surface temperature. CO2 does what it does. We have done and are doing what we've done and are doing.What the trend in surface temp tells us is how well we've modeled energy circulation for Earth's climate system. It also helps us understand climate sensitivity past and present. If the surface trend goes flat or negative for thirty years, then it will indicate that we are missing a major factor in the climate process. If ocean heat content also goes flat for thirty years, then we've likely completely misunderstood the process.
Note that OHC (in the link I posted earlier) in no way shows a "pause." The oceans are still rapidly accumulating energy, and the oceans are 93%+ of the thermal capacity of the climate system.
As Tom has pointed out, and as several of your quotes--in fuller form--point out, drawing conclusions from a surface trend is tricky business. When does the thirty-year trend start? 1998? Not statistically sound, as Tom has pointed out. Trend is negative from x to y (a period of between 6 and 10 years)? So what? Happened before, as I pointed out. Trend is not statistically significant? Ok, but what exactly does that mean? Does it mean that the trend is not statistically distinguishable from zero, or does it mean that it's not statistically different from well above the expected trend? Both. It doesn't mean there's no trend (i.e., it doesn't mean what you think it means).
Your interest seems to be "falsifying AGW" rather than understanding the science. You shouldn't attack something you don't understand. Understanding the theory of anthropogenic global warming by working backward from the surface trend is a bad idea. You should start with the basics. When you start with the basics, you'll know what is "settled science" and what is still being actively researched.
In this latest comment, you're basically repeating the same argument. Tom has answered the question you just asked, and in detail. If you repeat it again, without recognizing what has been said in response, your posts will be in violation of the SkS posting policy.
- There is no consensus
KR at 05:57 AM on 19 December, 2014Peter Lloyd - The consensus on AGW, although very consistently measured in the high 90%'s, is not immutable.
In the early 20th century the consensus on climate was that natural causes predominated. There were early researchers like Tyndall Fourier, and Arhennius who made some quite prescient predictions, but until the mid-20th century there was no general opinion that anthropogenic factors were important. But then things changed due to new evidence. Callendar in the 1930's (AGW a factor in early 20th warming), Plass (radiation balance) and Revelle (oceans won't absorb all anthropogenic CO2) in the 1950's, Keeling measuring CO2 in the 1960's, Manabe and others in the 1970's modelling GHG effects, etc - all contributed to the body of evidence.
And over the 1960's-1980's, the scientific consensus on climate changed, to the currently held view that AGW is the dominant factor in recent warming, accounting for ~100% of it (with natural factors such as insolation providing negative contributions).
The consensus changed due to evidence and how it is viewed by those who have studied these topics. It could certainly change again - but that would require a considerable amount of new (and contrary) evidence to that effect. There's no sign of such whatsoever - just inconsistent, contradictory and unsupported claims (it's the sun, it's a cycle, cosmic rays, it's not happening at all, there's a grand conspiracy toward a 'World Order', etc), claims that appear, quite frankly, loony.
Now, as to the meaning of such a strong scientific consensus - that's important because laypeople (quite wisely) will take expert opinions into consideration when deciding public policy.
You've claimed uncertainty where it doesn't exist. And your comments simply don't hold up in the face of the evidence.
- 2014 SkS Weekly News Roundup #33B
Leland Palmer at 14:57 PM on 18 August, 2014Hi chriskoz-
To make it short and sweet, methane is scarier than CO2 because of the carbon isotope excursions associated with past mass extinction events like the End Permian, plausibly due to the release of trillions of tons of methane from the oceanic methane hydrates. The End Permian killed upwards of 90 percent of all species- surely more than 99% of all individual organisms. And the sun is hotter now than it was then, by a couple of percent- an effect Hansen says is equivalent by itself to 1000 ppm of CO2.
Two major greenhouse gases is much scarier than one, mainly because infrared absorption bands get saturated, and because of the ability of methane extend to extend its own lifetime through degradation of the hydroxyl radical degradation mechanism. And three major greenhouse gases is worse than two, if you figure that water vapor will increase about 7% per degree of warming, whether that warming is due to CO2 or methane.
Then there are the atmospheric chemistry effects of methane, and the oceanic chemistry effects of methane.
Strong atmospheric chemistry feedback to climate warming from Arctic methane emissions
"The indirect contribution to RF of additional methane emission is particularly important. It is shown that if global methane emissions
were to increase by factors of 2.5 and 5.2 above current emissions, the indirect contributions to RF would be about 250% and 400%, respectively, of the RF that can be attributed to directly emitted methane alone. " (RF is an abbreviation for Radiative Forcing)For the oceanic chemistry effects of methane, read Peter Ward's book "Under a Green Sky".
No, methane is definitely scarier than CO2. The runaway feedback effects of methane are far, far scarier.
Methane is why we need to ban fossil fuels, not just decrease their use.
- 2014 SkS Weekly News Roundup #25A
ubrew12 at 19:43 PM on 19 June, 2014chriskoz@1: I think, in a nutshell, that's the purpose of this website, and of others like it. "Why, indeed, is this happening?" is what Cook and others (Peter Sinclair at climate crocks) have been asking, and the answers have been illuminating about human behavior and the 'calculus' by which vested commercial interests prey upon societies understanding of 'truth' in service to their profitability.
Changing the subject, I really enjoyed the Ecowatch article 'So you want to change the World? Better read this first.' about how societies really only change when infrastructural requirements (resource depletion, new technologies), force them to (and that this is one of those times). It's illuminating to see modern trends put in a 'cultural anthropologists' perspective. A quote: "How can you know if your idea fits the emerging infrastructure? There’s no hard and fast rule, but your idea stands a good chance if it assumes we are moving toward a societal regime with less energy and less transport (and that is therefore more localized); if it can work in a world where climate is changing and weather conditions are extreme and unpredictable; if it provides a way to sequester carbon rather than releasing more into the atmosphere; and if it helps people meet their basic needs during hard times." From here on out, 'may you live in interesting times' is our fate. It's useful to have such thinkers working to provide a useful guide to how to respond to these challenges.
- Rapid climate changes more deadly than asteroid impacts in Earth’s past – study shows.
Leland Palmer at 13:51 PM on 30 May, 2014howardlee @26-
Wow, that's a great list, thanks. Best I've ever seen. :)
So there are isotope excursions at a coincident time and in the correct direction to fit the flood basalt erruption / methane and CO2 release / oceanic acidification and anoxia general theory of most mass extinction events.
It appears now that there is a subclass of methane hydrates that might be dramatically less stable than most methane hydrates are - high salt "triple point" hydrates.
DYNAMICS OF SHALLOW MARINE GAS HYDRATE
AND FREE GAS SYSTEMS- Xaoli Liu (Thesis)"We show that the hydrate system at South Hydrate Ridge is already
everywhere at the three-phase boundary, and therefore it is highly sensitive to changes in ambient conditions, offering a mechanism for rapid release of methane from gas hydrate deposits." [page 2]Other scientists including Peter Flemmings are starting to write about these high salt hydrates. Models of the high salt hydrates tend to confirm Xaoli Liu's predictions.
These hydrates appear to be at the triple point of the hydrate/methane gas/sea water system. This would result in extreme temperature sensitivity and gas phase transport of methane within the high salt region. These high salt methane hydrate deposits, in combination with albedo change from loss of sea ice and permafrost rotting, could act as a bridge between mild CO2 based warming and massive hydrate dissociation.
The high salt concentrations in these sediments would normally be diluted out by diffusion into surrounding sea water and low salt sediments. The salt is generated by the well known "purification by crystallization" process in which the methane hydrates tend to exclude salt from their crystal structure when they crystallize out, leaving the salt behind in the sediments. So, a continuous flow of methane gas from deeper in the deposit is necessary to sustain these high salt triple point hydrates, before the salt diffuses away.
The need for a continuous flow of methane tends to put the high salt deposits in pinnacles at the top of the hydrate formations - in deposits at the top of the hydrate stability zone. So the relative shallowness of these deposits may make them more vulnerable to temperature changes.
These high salt deposits are in principle detectable by seismic mapping - there is a blank looking "wipeout zone" created by free diffusion of gas beneath a methane producing pinnacle.
So, just by looking again at existing sonic mapping data, we could in principle discover just how common these high salt methane hydrate deposits are, and determine how likely they are to push the climate system past tipping points into low level (?) runaway global warming.
- Looking for connections
wili at 03:55 AM on 24 May, 2014Others have already addressed quite well most of aust's points, but I would just add that Peter Ward has proposed a "Medea Principle" (or Hypothesis) to set against the Gaia--The earth does foster its 'children' for a while...until it suddently flies into a rage periodically and slaughters (almost) all of them in a mass extinction event. LINK
We are now in the midst of just such an event, and it is getting worse.
Note also that even with less than one degree C of warming above pre-industrial levels, we are already seeing non-linear, permanent changes kick in--Arctic sea ice will be essentially gone in the next few years or (at most) the next very few decades, and won't return any time soon no matter what happens. And now we hear that the West Antarctic Ice Sheet is simillarly doomed, though that collapse will take a bit longer to play out.
Unfortunately, the 'negative' damping feedbacks to raising of CO2 levels are both smaller in number and much slower than the positive feedbacks--think weathering of mountain ranges. The speed of our carbon 'forcing' is breathtakingly fast by any geological comparison.
- The consequences of climate change (in our lifetimes)
Doug Hutcheson at 17:00 PM on 27 April, 2014Peter says AGW does not alarm him, but (to paraphrase) the human reaction to the threat is alarming. I have to agree, with the caveat that I am alarmed by what AGW could do to our civilisation and, by inference, to our population. If our current cereal producing areas go out of production, what guarantees do we have that we can migrate our food plants as we migrate toward the poles? Sure, the cool areas may become warm enough to support our current prey organisms (plant and animal), but what will happen to plants adapted to a different day length, for example?
Will we see any concerted action before large numbers of people become alarmed enough to apply political pressure? I don't think so.
At the very least, the C in CAGW should stand for 'Concerning'.
- 2014 SkS Weekly News Roundup #10A
wili at 12:05 PM on 6 March, 2014More on the Antarctic current here:
"The Antarctic Half of the Global Thermohaline Circulation is Collapsing"
"The largest source of Antarctic Bottom Water in the global thermohaline circulation (labelled W) has ceased production.
...this study probably underestimates the amount of fresh water around Antarctica and its effects on Antarctic Bottom Water (ABW) formation...
Global political policies are not keeping up with the rate of change and our models have, to date, underestimated the rate of change. We are witnessing a total failure of global leadership to deal with changes we caused that are spiraling out of control."
Peter Ward on the consequences of this development: "When [the global ocean current conveyor belt] stops, we lose oxygen at the bottom, and we start the process toward mass extinction."
- A Hack by Any Other Name — Part 2
Andy Skuce at 13:43 PM on 28 February, 2014I think that there are some intreresting comparisons to be made between the Gleick case and the SkS hack. While there were a few who applauded Gleick (eg George Monbiot) many more were critical of his ethics, some harshly so. Peter Gleick himself apologized. The released material comprised budget documents and strategic plans. Released documents that contained personal information about Heartland board members was taken down.
There was no need to hack SkS to find out our budget or strategy, anyone who asked could find out: a few bucks raised by donations to pay for webhosting, no payments to contributors, no secret paymaster. Our strategy is to keep doing what we have been doing.
The SkS hacker must have been disappointed. All he got was confirmation of all of the above and a few intemperate comments of the kind that people make when they are chatting and venting privately among friends. Mostly, the conversation was earnest (and usually rather boring) discussion about getting the science right.
In contrast, many of those sympathetic to the SkS hacker continue to deny that there was even a break-in. We had faulty locks, they say, so even if there was a break-in, SkS deserved it: in other words, blame the victim, plea contributory negligence. The hacker himself does not dare to come forward, even anonymously, to say what happened.
And, among those who have published our private conversations and personal information, we hear very little in the way of doubt or questioning that this might or might not be justifiable.
- Lawson, Climate Change and the Power of Wishful Thinking
shoyemore at 18:31 PM on 3 October, 2013The BBC are clearly violating the letter and spirit of the report by Professor Steve Jones a couple of year ago which explicitly warned against a specious "equal time" for minority views in science. Jones has publicly pointed this out, and he is not the only one.
According to John Ashton, formerly the top climate-change official at the Foreign Office, the BBC's coverage of last week's report from the Intergovernmental Panel on Climate Change was "a betrayal of the editorial professionalism on which the BBC's reputation has been built over generations".... He questions why a senior corporation figure had long meetings about climate change with Nigel Lawson and Peter Lilley, both prominent UK sceptics. His criticism was echoed by other green campaigners, and academics
I honestly think this is the sort of thing that happens under a Conservative government - Lawson as an old Tory from the Thatcher days has access to levers of power he would not have otherwise under another party. That comes out in some of the denier talking points emanating from government ministers. If it was not for the presence of the British Liberals in the Coalition, Cameron's government (which he boasted would be "the greenest ever") would be tending towards that of Abbott or Harper.
While left-leaning governments may be hypocritical and tend to "greenwashing", at least they come with less fossil-fuel corporate baggage.
I am not British, btw, and am centrist by nature and choice, but I will probably never vote for a government of the right ever again - not when you look at Canada & Australia. It is a relief that in Germany the SPD or the Greens may be in government with the CDs.
- Toward Improved Discussions of Methane & Climate
Leland Palmer at 05:17 AM on 6 September, 2013It appears that some methane hydrate deposits are associated with high salt brine deposits- and those hydrates may be much, much less stable than the majority of hydrate deposits.
When methane hydrate crystals form, these crystals exclude salt and other impurities from their crystal structure, in the well known "purification by crystalization" process.
This apparently leads to high salt concentrations in some deposits, which allows those deposits to be at the triple point of the system- in which liquid, methane gas, and solid hydrate co-exist.
For these deposits, methane gas is much more mobile, and can apparently migrate upward through the hydrate deposit as a gas, according to authors including Peter Flemmings and his student Xiaoli Liu :
DYNAMICS OF SHALLOW MARINE GAS HYDRATE AND FREE GAS SYSTEMS
(2) Massive release of methane from gas hydrate depends on its proximity to the three-phase boundary. Where methane flux is high, there is a three-phase zone from the base of the hydrate stability zone to the seafloor. The three-phase zone increases the amount of hydrates located at the three-phase boundary; thus it can rapidly respond to environmental changes. Hydrate dissociation within the three-phase zone is regulated by changes in salinity required for three-phase equilibrium with temperature. The dissociated free gas can be released to the ocean via the three phase zone, even though hydrates do not completely dissociate during a small warming event. We estimate that a 4°C increase in seafloor temperature can release 70% of methane stored in the hydrate system that is initially at three-phase equilibrium, providing a mechanism for rapid methane release.
Such high salt methane deposits may be fairly common, according to authors including Maria Torres and Miriam Kastner:
OCCURRENCE OF HIGH SALINITY FLUIDS ASSOCIATED WITH MASSIVE NEAR-SEAFLOOR GAS HYDRATE DEPOSITS
CONCLUSIONS
Massive gas hydrate and chloride brines in near- seafloor sediments along continental margins are not at all uncommon, and may represent a significant carbon reservoir, which is susceptible to oceanographic perturbations....Preliminary estimates suggest that there is approximately 125 x 10-3 Gt of carbon trapped in the Ulleung Basin brine patches. If we assume that there are 200-500 such locations sites worldwide, this will represent a ~25 to 62.5 Gt carbon, which is 0.25 to 12% of the total carbon thought to be sequestered in gas hydrate deposits globally.
The existence of these deposits may be the answer to the disconnect between the geological evidence of past methane catastrophes and our current lack of understanding of how these mass extinction events occurred.
These high salt deposits could provide a bridge between orbital or anthropogenic forcing and massive methane release from the oceanic methane hydrates. Along with permafrost decay and shallow permafrost bound hydrates, these high salt hydrates could be the answer to how massive methane releases could occasionally be triggered by relatively minor triggering events.
Global methane hydrate inventories are probably very high, due to a series of recent ice ages. We are providing an exceptionally rapid and systematic triggering event by our global greenhouse emissions. The situation seems ideal, to me, for the generation of a methane catastrophe- perhaps the biggest one ever.
Why hasn't a biosphere ending methane catastrophe occurred before? The End Permian was a close call, perhaps, with upwards of 90 percent of species exterminated. And the sun is hotter now, by a couple of percent, than it was during the End Permian.
Maybe a biosphere ending runaway greenhouse hasn't happened before, just by luck.
If a low level or greater runaway had happened before, we would not be around to discuss it.
- 2013 SkS Weekly News Roundup #34B
chriskoz at 20:48 PM on 26 August, 2013grindupBaker@5,
You're likely taking about this Nature article co-authored by Peter Wadhams and based largely on Shakhova's research, looked by Chris Colose here with interesting comment thread. Intetresting it was, indeed.
- Toward Improved Discussions of Methane & Climate
Leland Palmer at 04:49 AM on 4 August, 2013By the way, even if most of the methane doesn't make it into the atmosphere, it could still do the biosphere major harm via ocean acidification, as it oxidizes into CO2 in the oceans.
I seem to recall seeing a modeling paper of this phenomenon in the Arctic ocean, which predicts that chronic methane release from the hydrates would overwhelm the oceans ability to absorb and oxidize the methane, and lead to more direct venting of methane to the atmosphere.
There are also suspicions that anoxic oceans could increase their production of NOx, I think.
As gws said, the atmospheric chemistry effects of methane release have to be considered- but so do the oceanic chemistry effects.
In his book "Under a Green Sky" Peter Ward talks about the truly catastrophic effects of massive methane release on the oceans, including anoxia and proliferation of strange bacteria. We're not there yet, and have a long way to go before things get that bad.
But, once it starts, could we stop the process?
- Nils-Axel Mörner is Wrong About Sea Level Rise
Klaus Flemløse at 07:20 AM on 17 July, 2013I have tried to investigate the photo from Minicoy Island from 2010 taken by Nils-Finn Munch Petersen – se post 56.
Figure 6 One of the locals of Minicoy, Ali Manikfan, showing how much the island has grown. What was once the beach is now located well above the wave-washing zone, is becoming overgrown (just as many beaches in the Maldives; Fig. 4; Mo¨rner et al., 2004; Mo¨rner, 2007a,b) and invaded by land-snails (photo: N.F. Munch-Petersen, 1992). Link.
This photo has been used as documentation that the water level in the Maldives is decreasing. The photo was taken at the north side of the south-western part of the island close to the light tower looking towards the isthmus.
Here is a picture of Minicoy Island:

Here is a picture of the isthmus:

In the bay protected by the isthmus on the inside of the atoll, it is expected in most cases that new land will be created. Prof Nils-Axel Mörner and Nils-Finn Munch Petersen have used this as the proof of the decreasing sea level around the Maldives.
Using Google Earth, it appears that there is erosion on large parts of the island and a buildup of sand in at least two places as a result of coastal protection programs.
It would be pleased if someone could check my argument.
From Colorado University, I studied the water level around Minicoy Island. This is shown in the following figure:

This figure shows that the water level has increased by about 3.2 mm per year during the years 1990-2013.
So we have a paradox as Prof. Nils-Axel Mörner and Nils-Finn Munch Petersen claim that the water level is decreasing whereas sea level based on satellite measurements show the opposite. Who is right?
- UK Secretary of State for the Environment reveals his depth of knowledge of climate change (not!)
DSL at 23:32 PM on 12 June, 2013HJones, are you actually going to stick around and defend/discuss your claims? I look forward to you doing so.
As for Patterson (and your defense, HJones), there's no critical contextualization being done. For example:
Patterson: "the Arctic melted completely and you can see there were beaches there."
This is probably a reference to Funder et al. (2011), titled "A 10,000-Year Record of Arctic Ocean Sea-Ice Variability—View from the Beach." Yes, Funder finds that during the Holocene climatic optimum, Arctic sea ice effectively disappeared at summer minima. That has been used to make MWP-like claims about sea ice: "sea ice has been lower in the past; therefore there is nothing remarkable about current sea ice loss." What Peterson, HJones, and sites like HockeySchtick fail to mention is that Funder et al. also found a hockey stick during the late 20th century. Arctic sea ice extent slowly grows from the HCO until it reaches around 1970, when it sharply goes into decline. Hockey Schtick went so far as to chop off that end of the graph. HJones just ignores it. Patterson has probably never read Funder; someone told him it would be a good thing to mention. They also fail to mention that despite the long-term decline in solar forcing -- and the short-term decline of the last 50 years -- Arctic sea ice extent is plummeting and will reach conditions similar to HCO summer minima within decades (again, without help from the sun; indeed, with the sun trying to cool). - On the value of consensus in climate communication
johncl at 18:40 PM on 23 May, 2013I do believe the main problem for many now is not to accept that there is global warming happening, but that its caused by humans - as it implies that they are themselves guilty of it. Also, its very easy for people to put blame to others even if they believe humans are the cause of it. "Its the Chinese and all their coal plants!". So here in Norway there is constantly comments from people about e.g. electrical cars being bad because they are fueled by coal electricity - even though Norway has 99% of its electricity from hydro power. The general idea is that, if its not good for the general average over the whole globe, its not good for us as well. But this idea is rather silly in my opinion, and in most cases its rather impossible to change peoples view on this since its so securely rooted in the trandition of the fossil fuel car being the best choice. It doesnt help that Norway also gets its current wealth from oil as well.
The same odd argument is also used against building more windmills in Norway, because we already have enough hydro power. So its indeed like a snake biting its own tail, as many people seem to be unable to have more than one thought in their heads at one time. I do believe the more you are able to see things in a wider perspective your views will slowly creep towards more liberal viewpoints and are able to see the bad things about free market policies and the effect of e.g. globalism. Also there is general disconnect from nature in the way that we treat consumables as things that magically appears in the shelves. In general people need to be educated about the carbon footprint of anything we buy, almost to the point where every good has a carbon footprint estimate printed on its label. But with e.g. the clothes industry not even wanting to inform the public about which factories their goods are made in - its clear that the "truth" of globalism is one they would rather be kept secret since its generally bad publicity the moment another building collapses or is known for using child labour. So we need education of the masses that every choice we make in consumption is also a moral choice about the implication of globalism, its carbon footprint and human suffering that results from it.
I am very thankful that John Cook and SkeptialScience is keeping up with spreading the message and I was very happy to see the consensus research even presented in mainstream media here in Norway as well. The discussions in the comment fields were just littered with "AGW is BS" and all kind of denial ofc. But those comment fields are also a place were we should be active and promote real science information and preferably with links to sources, which is one the denialsphere often lacks as its generally based on feelings and not facts. Unfortunately when they do seek "facts" for themselves they very easily end up on WUWT and other denial sites because it seems they have been able to flood the search databases with classical spam link methods for getting high on the search results. Its easy to see this if you search for "global temperature" for images and see where those images lead to. So its indeed an information battle going on here to get real information. Good transparent research like this consensus project is definitely what we need more of.
To quote a song by Peter Gabriel: "Turn up the signal, wipe out the noise!".
- Science vs. the Feelies
Michael Whittemore at 22:57 PM on 18 March, 2013I have seen Venus used as an example of runway global warming causing the oceans to boil. I look forward to Peter trying to debunk the “Myth” of a possible runaway warming effect happening here on earth.
- Obama, Romney, and Various National Climate Policies Around the Globe
JasonB at 17:09 PM on 12 September, 2012
Sceptical Wombat,
The danger with cap and trade systems is that carbon allocations are in effect a form of money and (as with water allocations or money itself) there will be a strong temptation for governments to simply create more, which of course results in a lowering of the price. It is crucial that the integrity of the system be maintained.
Sure. But auditing each country's issued permits is straightforward, and if someone is found cheating then their permits can be declared invalid or worth less than face value by the amount of the over-subscription (a form of inflation, if you will).
Also, my understanding is that Europe has moved to a centralised cap and registry so individual countries won't be able to do that anyway.
Unfortunately Jason is wrong in thinking that a lower carbon price will result in lower compensation. The household compensation is fixed so a lower carbon price will result is a budget problem.
Well, that just means that rather than the compensation being automatically calculated each year it just becomes part of the normal budget-making process.
Each year, Treasury could forecast the carbon price for the following year and estimate its impact just like they did when the carbon tax was introduced, then the government could add a buffer to minimise the risk that the price will rise higher than expected and the compensation would be insufficient, and then include it in the budget for the following year.
This is true regardless of what the current legislation says. No Parliament can make a law binding a future Parliament (Tony Abbott wants to repeal it entirely, remember!), and the budget has to pass through Parliament anyway.
(This is one of the things that always made me laugh about the GST legislation. Peter Costello made a big deal about the idea that the only way to change the rate of the GST was if every state parliament and the federal parliament agreed. This is of course complete and utter rubbish, the GST legislation is an Act of Parliament and can be modified by any future Act of Parliament no matter what the original Act says. The only thing binding Parliament is the Constitution.)
So, it's really just a political question. If Labor is still in power by 2015 and the carbon price is still really low and this is going to be an issue for the budget, the obvious solution is to tell voters that they don't need as much compensation because it isn't costing that much. There is no reason that the carbon price should cause a budget problem. It could cause a political problem if the international price skyrockets during the year and the compensation thus calculated turns out to be insufficient, but mid-year reviews and additional handouts are not unknown. - It hasn't warmed since 1998
DSL at 23:53 PM on 30 May, 2012
Peter42, if your basic question is "what would convince me that non-significant or no warming is taking place," then the answer is "non-significant or no warming taking place." If, instead, you're asking about AGW fundamentals, then I'd have to be provided with a comprehensive physical model that did not allow CO2/H20/et al. to absorb and emit within the range at which the sun-warmed surface of the Earth emits, and one which did not allow cooler "objects" to radiate toward warmer "objects."
Absent that alternative model, anthropogenic global warming must be taking place. Is some cooling factor countering the warming? Perhaps, but that doesn't mean the GHG factor has stopped doing its thing. If insolation drops and aerosols increase, both providing overwhelming cooling effects, does that mean that AGW is not occurring? No. The warming--or, as some semantic trolls like to have it, "the slowing of cooling"--is still occurring, even when the temperature is trending down. That's what Foster & Rahmstorf (2011) partially addresses. Strip away the major cooling/warming factors (solar, ENSO, volcanic) other than GHG, and what do you have left? - Monckton Misleads California Lawmakers - Now It's Personal (Part 1)
bill4344 at 17:51 PM on 28 March, 2012
Ah, the hubris is truly extraordinary! Visiting foreign parts and lecturing the natives on how they don't understand their own economies; how very colonial!
I look forward to part 2 - I'm curious as to whether he also repeated some of the very same myths that he's currently running away from Peter Hadfield's debunking of. - Peter Hadfield Letter to Chris Monckton
Same Ordinary Fool at 11:06 AM on 26 March, 2012
Why didn't I think of that?..........Caerbannog's #10 and #18 accounts of Monckton's chosen venue of an unpublicized appearance to an underworld-from-reason of the right wing could have been predicted. When the debunkers are always there after every public appearance, correcting his errors, for all interested people to see - it was always inevitable that he would some day have to retreat. And leave the lecture circuit of simulated scientific discussions for something else. Here, to that of rabble rousing applause lines.
Even so, it is depressing and scary now that it has happened. These are people who don't believe in evolution. Despite the obvious proof that every single fossil has been found positioned in evolutionary order. And none in creationsist order - no giraffes amidst the dinosaurs.
Think about how much harder it will be for creationists to learn from experiencing global warming's consequences - which will always be interspersed with the occasional old fashioned cold spell (resulting from weather variability).
However, though we decry what comes next, this is progress, and a success for the debunking community. The more he's quoted from such appearances, the less welcome he will be at semi-serious-science occasions, to spread his climate science errors.
After watching all of Potholer54's Youtube videos..........I'm inclined to give Peter Hadfield (and Peter Sinclair) much of the credit. Video, Marshall McLuhan's "hot" medium, is best for exposing the errors of a denier like Monckton.
Typeface on paper or screen is better for presenting ideas or science. A reader can proceed at his own speed, go back, repeat, scan forward, and generally jump around. It is also simpler, less labor intensive, and cheaper: since all one needs is a keyboard. However, it cannot convery as much as quickly [that picture-is-worth-a-thousand-words thing].
Show, don't tell..........Peter Hadfield, in his 5 part Youtube series, amply demonstrates that video is the best medium for Monckton. And that it can be effective without resorting to the boring scientific details that might be misinterpreted by a general audience.
.....Him misstating a research paper, followed by a visual of the paper and the contradicting statements in it.
.....Him misstating a quote, followed by a visual of the original source of the quote.
.....Him misusing graphs, as by cherry picking. Which is quickly demonstrated, by showing the correct graphs.
.....Him being contradicted by himself - via videos from his other presentations.
.....Him denying in emails that he'd made the mistakes pointed out by Peter Hadfield, followed by examples of same.
Monckton's non response..........could also have been predicted by anyone who had just viewed those 5 videos. It's obvious that it has always been a mistake for Monckton to engage with Peter Hadfield. Because Monckton would always be expected to lose the least gullible among his potential believers - if they actually watched the videos. - Peter Hadfield Letter to Chris Monckton
funglestrumpet at 02:18 AM on 26 March, 2012
Perhaps we as a species really do not deserve to survive. Just look at the facts: The powers that be observe that the climate is changing and are sufficiently alarmed to set up the IPCC. This enables the world's leading climate scientists and other leading scientists in related fields to pool their expertise and analyse the state of the science in the relevant papers on the subject. From this analysis they then advise those in the legislature regarding policy on the issue. By way of 'thanks', they get a whole army of people: Delingpole, Philips, Hitchens, The Tea Party, The Republican Party, etc. etc. ridiculing them for all their hard work on all our behalves, while speaking from positions of breathtaking scientific ignorance and even invoking Genesis on occasion. They, like sks, get their private details hacked, and in some instances they get court proceedings taken against them. In fact, the list of 'retaliatory' acts seems endless.
Perhaps the denialati don't realise that Mother Nature has declared war on us and she has some heavy armaments her arsenal. In a war situation, the last thing anyone should do is try to disrupt the work of the intelligences agency (IPCC) in formulating a 'state of play' regarding what the enemy is doing (Mother Nature) and offering advice on what our strategy should be in response. Yet that is exactly what Monckton and a whole army of like minded individuals are doing.
Perhaps, difficult as it is to believe, the likes of Monckton actually want Mother Nature to have her wicked way with us. Perhaps they think that they and their progeny will be able to survive the troubles that lie ahead and come out on top, so to speak, in much the same way the collaborators in WW2 believed they were in for a good life at the end of hostilities.
Perhaps those who are fans of Monckton have not spotted that His Lordship has a much more interesting life than they almost certainly do, flitting around the world as he does giving the same old same old (complete with known misleading statements) to audiences of adoring fans. Keith Barry and Derren Brown deceive their audiences, but only for the purposes of entertainment. It is difficult to work out the motives behind Monckton's audience deception. I for one would love to see who pays for all this globe-trotting and associated expenses. Perhaps his need to be in the limelight is so desperate, he pays for it all himself.
Perhaps Peter Hadfield is right in allowing for the possibility that Monckton's misleading statements are genuinely unintentional. I would do the same if they did not include so many misrepresentations of hardworking scientists who are engaged on our side of the fight; misrepresentations that appear very deliberate to me.
Perhaps we should not view Monckton as a collaborator, but it is hard not to. Perhaps he is not receiving any benefit from his actions on climate change other than a fun life being the centre of attention, something that he appears to crave. But there again, perhaps we really should view him thus. What really saddens me is that so many young people support his efforts to blight their future; like the cannon fodder of WW1 admiring the generals who were sending them 'over the top' to their almost certain deaths in a war they had been told was the war to end wars. ("Well, young Willy McBride, it's all happened again and again and again and again.")
Perhaps Mother Nature is not really at war with us. Perhaps all she is doing is reacting as Gaia to a virus infection called humankind that has reached a tipping point in terms of its population and needs culling. When a person gets sick with a virus infection, the usual response is a rise in temperature. It would seem that the earth is only doing likewise. Perhaps Monckton is only acting as an anti-body, or somehow sees himself as such.
Perhaps I should admit defeat, but I cannot. I regard Monckton and all those like him, together with their supporters that give them the oxygen of publicity, as my enemy, my children's enemy and the enemy of their children, unborn and unnamed. With that in mind I will fight them with all my might. Perhaps in Monckton's case Mother Nature will do the job for me. When a soldier runs away, as Monckton has so clearly done on this occasion, instead of standing their ground, the usual response is a court marshal for cowardice, followed by a blindfold and a target marker over the heart. I wonder how Mother Nature will deal with his cowardice. If he were genuinely worth his peerage, he would have the courage to either offer a defence of his seemingly misleading statements, or admit his error and amend his presentations accordingly. Perhaps he will, but I doubt that he has the courage. - Lindzen's Junk Science
Martin Lack at 07:06 AM on 12 March, 2012
#1 Composer99 As I have said elsewhere, Lindzen's talk was given to an audience comprised mainly of Repealtheact rentamob (i.e. members of the supposedly "sceptical" public) and scientifically-illiterate journalists. Apart from Lord Monckton and Sammy Wilson, the only other MP present (in the audience) was former Trade and Industry secretary Peter Lilley. The closest one could possibly get to celebrity status would be James Delingpole.
When I last checked, the Repeal the Act ePetition had just over 1000 signatures so they are never going to change policy that way (100k required to trigger Debate) but what is more concerning is Monckton's claim that Lindzen was whisked away afterward to brief a Cabinet Minister. This is clear interference in UK politcs and I would love to know what MIT think about it. - Lindzen's London Illusions
Martin Lack at 07:09 AM on 8 March, 2012
Professional misconduct complaint against Professor Richard S. Lindzen Sent by me to MIT today:
Dear Sirs,
I should appreciate some guidance about whether and how - as a non US citizen - I can make a formal complaint against Professor Richard S Lindzen for apparently repetitive hypocrisy, obfuscation and misdirection of several audiences, including the following:
1. At the Heartland Institute's 4th International Climate Change Conference in May 2010;
2. In testimony to US House Subcommittee on Science and Technology hearing in November 2010; and most recently
3. At a meeting in Committee Room 14 of the Palace of Westminster (at which I was present) on 22 February 2012.
I have now sent Professor Lindzen 3 emails (on 23 and 25 February, and 5 March but, as yet I have had no explanation - let alone a satisfactory one - for the issues I have raised in my emails to him.
Transcripts of my 3 emails have been published on my blog as follows:
An open letter to Richard Lindzen (28 February 2012) - 1800 word email with questions from me.
Prof. Lindzen – try this instead! (29 February 2012) - Many of my questions re-formulated as 17 statements via which I invited Professor Lindzen to explain his position.
There is no cause for concern? You cannot be serious! (5 March 2012) - about 900 words - plus some very interesting comments from me and others.
If nothing else, Professor Lindzen's repetitive divergence from - and ridicule of - the genuine scientific consensus regarding the nature, scale and urgency of the problem we face (i.e. anthropogenic climate disruption) and/or his invocation of conspiracy theory as a grounds for dismissing the validity and reliability of that consensus would appear to be in severe danger of damaging the international reputation of your highly-esteemed establishment.
Therefore, if I do not hear from you within 7 days, I shall forward this email to Suzanne Goldenberg (US Environmental Correspondent for the Guardian newspaper) suggesting that she publish it forthwith because, in the continuing absence of a satisfactory explanation from him, I am inclined to believe that Professor Lindzen is part of an organised campaign to downplay, deny and/or dismiss anthropogenic climate change being orchestrated by right-wing, ideologically-prejudiced Conservative Think Tanks (CTTs) such as the Heartland Institute and the CATO Institute. I have reached this conclusion, in no small part, as a result of my reading of research done by Peter Jacques et al., the findings of which may be summarised as follows:
In prefacing their research, Jacques et al. observed that:
“Since environmentalism is unique among social movements in its heavy reliance on scientific evidence to support its claims… it is not surprising that CTTs would launch a direct assault on environmental science by promoting environmental scepticism… (2008: 353).
Furthermore, based on their findings, they concluded that:
“Environmental scepticism is an elite-driven reaction to global environmentalism, organised by core actors within the conservative movement. Promoting scepticism is a key tactic of the anti-environmental counter-movement co-ordinated by CTTs…” (ibid: 364).
Jacques has also highlighted the central aim of CTTs as being to cause confusion and doubt amongst the general public, in order to prevent the creation of a popular mandate for change (i.e. achieved by using a tactic developed by the tobacco industry of countering supposedly “junk” science with their “sound” science), which he refers to as the “science trap” (2009: 148).
Based on the findings of the research published in 2008, Jacques therefore also concluded that environmental scepticism is a social counter-movement that uses CTTs to provide “political insulation for industry and ideology from public scrutiny”; and that this deliberate obfuscation stems from a realisation that “anti-environmentalism is an attitude that most citizens would consider a violation of the public interest” (2009: 169). However, Jacques does not blame the CTTs for the ecological crisis he feels we face, as they have merely exploited a dominant social paradigm; “because neoliberal globalism and its logic are protected from critique” (ibid: 119).
I therefore trust that I may hear from someone regarding this in the very near future.
Kind regards,
Martin C. Lack. BSc (Geology), MSc (Hydrogeology), MA (Environmental Politics).
Author of the Lack of Environment blog - 'On the politics and psychology underlying the denial of all our environmental problems….'
References:
Jacques, P. et al. (2008), ‘The organisation of denial: Conservative think tanks and environmental scepticism’, Environmental Politics, 17(3), pp.349-385.
Jacques, P. (2009), Environmental Skepticism: Ecology, Power and Public Life. Farnham: Ashgate. - PMO Pest Control: Scientists
Doc Snow at 05:06 AM on 6 March, 2012
"Environment" Minister Peter Kent responded to critical questioning about the decisions to close down PEARL by saying "I don't have a million and a half dollars in my back pocket."
However, it appears possible that ordinary Canadians of good will just might:
http://www.cbc.ca/news/technology/story/2012/03/04/arctic-research-station.html
It should be noted that this is not due to extreme financial pressure; Canada's net debt ratio is lowest in the G-7, and the last deficit was a very manageable $33 billion.
http://www.fin.gc.ca/afr-rfa/2011/report-rapport-eng.asp
Sadly, the video does seem to accurately encapsulate the true attitude of the Harper government toward science--and especially science that is in some way environment-related. - Warming to Ignite the Carbon Bomb
funglestrumpet at 11:52 AM on 5 March, 2012
Regardless of whether the global warming that is currently in play is due to human beings and is thus AGW or not due to human beings and is thus just plain old GW, can there be any argument that we as a species absolutely must do whatever we can to reduce our contribution to the greenhouse effect? Anyone who thinks that there is an argument for not taking action needs to re-read the above post and if they still feel the same, they need to find out what is meant by the term ‘tipping point’.
We know what the greenhouse gases are and how much of them we are releasing into the atmosphere. We also know how to minimize that release. Surely it is a crime against humanity to deliberately hinder any action towards their reduction. (Cue some smartarse to say that I am calling for a cull in the population of human beings, seeing as we emit greenhouse gases. Some more than others in my experience.)
Future generations are going to look back at what we knew as a species and wonder why on earth we did not take the action the scientists are screaming for. Mind you, five minutes spent looking at archive material of the WUWT website and they will get some idea as to where the problem lies. It is not all WUWT’s fault, of course; in the U.K. we have Lord Monckton, the well known >snipping< >snip<, Lord “We can adapt to global warming” Lawson, columnists such as Peter “The greenhouse effect probably doesn't exist” Hitchins and Melanie “Climatology is a global fraud” Philips, among many others who seem to speak from positions of appalling ignorance, yet deliberately try to stop action that is intended to combat global warming and thus their children’s suffering and that of their grandchildren. The comments policy prohibits my giving an opinion of such people. As for America’s contribution to the issue, well ...! - Monckton Misrepresents Specific Situations (Part 2)
funglestrumpet at 08:24 AM on 24 February, 2012
Can we really let this obnoxious individual get away with endangering us? Surely the time has come to put a stop to him and his deceit once and for all. This site concentrates on the science of climate change, and does a very good job of it. From my perspective, the only thing missing here, and I guess it is due to a lack of published papers on the subject, is in-depth analysis of what is likely to happen for each degree of warming if the likes of Monckton get their way and we fail to take the necessary action to combat it. I know it is crystal ball stuff, but I think it necessary to be able to produce documentary evidence that Monckton is wrong, has been informed by recognized expert opinion that he is wrong, but ignores such information in subsequent presentations. We also need to demonstrate that he has to be aware of the dangers to human life of hindering or stopping action to combat climate change i.e. the degree by degree analysis. He makes great play of the fact that he is a Lord. Well, I wonder if we can get him stripped of his title on the basis of the dangers he is putting his country in. Though, quite frankly, I would like to see a situation where losing his title would be the least of his worries.
As Peter Hadfield, in his Monckton Maneuvers videos, clearly shows, Monckton admits to not being a scientist, says to his audience that he can support any claims he makes, yet not only routinely fails to produce that support when asked, but changes (maneuvers) to a position where he eventually agrees with the science . The trouble is that by the time he gets round to agreeing with the science, the audience have long gone, possibly to rattle the cage of their parliamentary representative in order to demand that any action on climate change be halted because it is not the threat the ‘alarmist research fund seekers’ make it out to be. Meanwhile Monckton is off somewhere else repeating his misinformation to yet another bedazzled audience sitting rapt by this real English Lord, and a Viscount to boot, Wow! There can be no question that he wins the debates he takes part in, while being wrong on nearly every count (and I am sure we can prove that in many instances he is either deliberately so or can’t understand the science). You get a feel for Monckton’s persuasive powers by visiting WUWT –snip– (self censored!) and read the adulation he draws. I expect his theatre audiences feel the same way, “Don’t ya know?”
I look forward to part 3 and perhaps the subsequent comments might include some pest control suggestions. - Measurements show Earth heating up, think tanks & newspapers disagree
Minkie41 at 14:19 PM on 3 February, 2012
Elsa!
I believe I know what Lovelock meant.This is from Paul Edwards's A Vast Machine,MIT Press,page 439,and is not to be taken lightly.The other reference is to M.R. Allen & D.J.Frame in "Call Off The Quest," Science 318,no5850 (2007):582.
The discussion involves climate sensitivity,and the idea that doubling CO2 may lead to a temperature rise of perhaps greater than 6 degrees C;which is a lot higher than the IPCC's forecast,and Hansen et al's.
"Once the world has warmed by 4 degrees C," Myles Allen and David Frame wrote,"conditions will be so different from anything we can observe today (and still more different from the last ice age)that it is inherently hard to say when the warming will stop."If that is true,the search for mopre precise knowledge has little hope of success.Worse,implicit in the quest for precision is the notion that there is some "safe" level of greenhouse gases that would "stabilise" the climate.Allen and Frame's point is that we do not know this,we cannot find out wether it is true--and we now have good reason to suspect it is NOT true"
We need a Churchill of a leader now!All this childish bickering over things like time series anomalies has long gone beyond the ridiculous.
Peter Cummins
New Zealand - Quantifying Extreme Heat Events
Chris G at 07:13 AM on 3 January, 2012
There is a high risk of me over-interpreting this information, but I'd like to toss out some thoughts and see what/if anyone else thinks of them.
The areas where 3-sigma events are most commonly occurring seem to be clustered in three bands, the equator, and two bands roughly 30-40 degrees north and south. On the north and south bands, I'm wondering if the temperature anomalies are, at least in part, a result of Hadley cell circulation encroaching on regions previously under Ferrel cells.

This would be consistent with GCMs that predict, and actual observations of, Hadley cell expansion in a warmer climate.
Second SWAG (scientific wild-ass guess): If you project the increase forward, by somewhere around 2020 about 20% of the globe will be under a 3-sigma event in any given year. I wonder what people's memory is for events like Texas, Southern Europe, and the Moscow region. If events like these are happening about every 5 years in any area, will that finally get through to the general population that we are better off doing something about it than not? - A thoughtful conservative perspective on climate
scaddenp at 09:20 AM on 1 January, 2012
A Rocha is active in NZ with a no-nonsense approach to climate change as this. Backed by evangelical luminaries like John Stott and Eugene Peterson. - Medieval project gone wrong
markx at 01:03 AM on 28 December, 2011
Are we saying there was no MWP? Comments on the papers below would be appreciated.
“….the current warming trend over Tasmania is still a significant event when viewed in the context of multi-decadal variability covering the past 2000 years. In that period it remains the warmest event to a marginal degree, although a much longer warm period is indicated in the AD 900±1500 interval…..)
But that is the 50 years low pass reconstructed temperature, the ‘temperature reconstruction' indicates many peaks exceeding modern warming. (fig 7)
Warm-season temperatures since 1600 BC reconstructed from Tasmanian tree rings and their relationship to large-scale sea surface temperature anomalies E. R. Cook á B. M. Buckley á R. D. D'Arrigo M. J. Peterson Climate Dynamics (2000) 16:79-91
Likewise, Liu Y, et al. also see a relatively warm period from 950 to about 1100 with no extreme cool periods until about 1200 (fig 1 and fig 5). (Though not as warm as current temperatures in the region) The LIA is evident too.
Amplitudes, rates, periodicities and causes of temperature variations in the past 2485 years and future trends over the central-eastern Tibetan Plateau
LIU Yu, CAI QiuFang, SONG HuiMing, AN ZhiSheng & Hans W. LINDERHOLM Liu Y, et al. Chinese Sci Bull October (2011) Vol.56 No.28-29
)“….This record is the longest yet produced for New Zealand and shows clear evidence for persistent above-average temperatures within the interval commonly assigned to the MWP……”)
Evidence for a ‘Medieval Warm Period’ in a 1,100 year tree-ring reconstruction of past austral summer temperatures in New Zealand Edward R. Cook Jonathan G. Palmer Rosanne D. D’Arrigo
For the Northern hemisphere, Actual temperature records from UK dating back to about 900 AD, show the average temperature (in the UK) from about 1100 to 1250 AD was more than 0.5 C warmer than today. (Lamb 1965) - (Fahrenheit) 451 ppm
skept.fr at 04:54 AM on 14 December, 2011
Sphaerica : Absolutely, yes. But that basis can no longer be fossil fuels. Unfortunately, the investment and infrastructure for fossil fuels is so entrenched in our civilization that it will take many decades to replace it all... unless we try to do so in a too-rapidly painful way that will be as disruptive as climate change itself.
Oh nice, we perfectly agree on that and so was my main point ! When you speak of a ‘painful’ and ‘disruptive’ decarbonization, that is exactly what I mean by ‘human evaluation of climate change’. You accept the fact that a part of the climate change is tolerable because a too abrupt energy change would be comparatively less tolerable. By doing so, you evaluate what is (more or less) good or bad for human society exactly as I suggest we should do. This does’nt mean you consider climate change as good in itself, but better (or not worse if you prefer) than an abrupt energy shortage.
About climate, you’re projecting death and suffering in a possible and future world, but when it comes to human welfare, I’m personally speaking of death and suffering in our present and real world, for which certainty is 100% from observations, not X% from models. I confess that I‘m suspicious (and often irritated) toward climate-centered views that seem to ignore or relativize the other problems of humanity, the orders of magnitude of human needs in our world, the potentially damaging conflict between climate goals and energy supply, as I gave a concrete example with Indian dilemmas after Durban. But if your position is a realistic one, as it seems to be with this quote, there’s no problem : we agree.
When it comes to solution, you must note that even if OECD divides by two its carbon emissions, what I hope we’ll do as fast at possible but what will already be a great challenge, this leave us with a 2 PgC decrease each year : but this quantity is what is henceforth added to annual emissions from developing countries in less than 10 years (see Peters et al 2011 in the carbon discussion) and this development is just the beginning of the great leap forward modernization of their societies. So let’s be clear : if we don’t want a ‘disruptive’ and ‘painful’ carbon plan, it will be very difficult to prevent a CO2 doubling.
That’s why the very first priority is to ease the access to non-carbon energy everywhere it is possible, to reinforce the R&D in that domain and before all to price carbon externalities so as to give the good signal and improve RE competitiveness. At least I prefer this kind of clear way that to lose precious years with discussions around an unrealistic world 450 ppm target, not even mentioning the 350 ppm Hansenian ideal.
PS : You point out the risk of fossil ‘near exhaustion’ : I suggest this could be another very good argument for a huge effort in decarbonization – and perhaps the future deus ex machina for a rapid (but if so difficult) energy transition. Tom Curtis seems to be very optimistic about fossil reserves, when suggesting in #44 we’ve enough for CO2 4600 ppmv, and CO2 1000 ppmv in this century. These ‘geologic’ quantities from USGS Survey (or ‘cornucopian’ estimates of Lomborg’s style) are IMO far from the real quantities we can extract and use at a sustainable cost for our economy. But we'll check that point well before 2050, or even 2030. - The Monckton Maneuver
chriskoz at 15:53 PM on 7 December, 2011
I'd like to bring again this comment by John Hartz quoting Donald Brown, Professor of Environmental Ethics, Science, and Law at Penn State, comparing the climate change disinformation campaign to "A New Kind of Assault on Humanity".
Clearly, we are dealing with the person very intelligent and outspoken as Christopher Monckton appears to be; with the degree of journalism, so surely understanding the manipulative mechanisms he employs. We have a perfect case of the assault prof Brown is talking about, with plenty of evidence gatherred by Peter in this this bunkum series. And the harm done by Monckton is also very high: i.e. his testimony in the Congress is a very high profile disinformation, targetted at most influential policy makers.
Shouldn't someone name those practices and bring justice to the evidently guilty perpetrators?
In Australia, Monckton labels policy makers trying to deal with climate change as 'fascists' here. Well, if he regards the debate about climate change in such terms, then he is simply asking for that himself: to be treated as he is treating others. If prof Brown's teaching turned into law soon, and if law could work backwards, we would have a perfect criminal to watch, as we had them in Hague some half century ago... - Extreme Events Increase With Global Warming
Norman at 15:40 PM on 19 November, 2011
muoncounter @ 63
Here is a quote from the NASA link:
"A series of connected changes begin because clusters of blocking events can divert the normal track of the storms crossing the Atlantic, which in turn can alter the twisting motion that the wind has on ocean waters, or wind curl. Depending on how wind curl works, it can speed up or slow down the large, circulating currents in the ocean known as gyres. When a blocking event reverses the rotation of the wind curl, the winds push against the direction of the whirlpool-like North Atlantic subpolar gyre, slowing its rotation. A slower, weaker gyre allows subtropical waters that would normally be trapped in the whirlpool-like flow to escape and move northward.
"These warmer and more saline waters then invade the subpolar ocean and cause a series of impacts," said Peter Rhines, an oceanographer at the University of Washington, Seattle, and co-author of the new study. "They erode the base of glaciers, contributing to the melting of the Greenland ice sheet. And the change in temperature and freshness of the waters can alter subpolar ecosystems, too."
The blocking pattern allows for warmer tropical water to move up north. The warmer water does not cause the blocking pattern.
Your point: "It's not clear from that whether blocking causes warming or warming causes blocking."
From my reading it seems it is farily clear that the blocking causes the warming. The enhanced warming may intensify the blocking but I can't find articles which make the case that warming is the cause of the blocking.
Articles on blocking make the claim that a high or low pressure gets stalled by jet stream pattern. A high pressure system that stalls in an area will prevent clouds and rain from entering an area. Sunshine will dominate, the ground will dry and the temperature will rise above the normal.
Do you have any links or articles that would support the possible idea that a heat wave causes a blocking pattern and not visa versa? - Bad, Badder, BEST
Dennis at 23:24 PM on 26 October, 2011
I think Peter Sinclair's video is excellent, except I agree he should have left off the "Junior Woodchucks" and similar comments. It simply gives places like WUWT a reason to deflect their response (if they do respond) away from the science -- where they are getting increasingly incomprehensible and contradictory -- towards complaints about ad hominen attacks from the "warmists." - Review of Rough Winds: Extreme Weather and Climate Change by James Powell
Norman at 13:31 PM on 15 October, 2011
skywatcher @208
In the Peterson (2008) paper, I am wondering if you could explain figure 16 trend line. There is a monster peak in the early 1980's but the trend line barely goes up for the 5-day maximum and actually goes down for the 1-day precipitation even though this frame is by far the greatest amount of precipitation anomalies. Then in the early 1990's the dip downward is the greatest since 1956 but the trend line is going up. Without an understanding of how this trend line works or what it is showing, I am not sure how the author concludes that preciptiation has been increasing. - 2010 - 2011: Earth's most extreme weather since 1816?
Tom Curtis at 10:04 AM on 4 July, 2011
Norman @225, please follow the logical steps:
1) Increased temperature implies increased specific humidity;
2) Increased specific humidity implies more water condenses as a result of cooling due to updrafts or frontal systems;
3) More water condensing implies more latent heat released;
4) More latent heat released implies a stronger updraft generated which:
4a) Results in greater cooling, with more water released; and
4b) Results in more air being drawn into the updraft, carrying more water with it.
Please note that there is no contradiction between 4 and 4a. Although more heat is released, the updraft cools the air rapidly as it rises.
The consequence is that where updrafts form, the moister the air, the stronger the thunderstorms that result, as in stronger winds as more air is drawn into the updraft, more intense rainfall as more water is precipitated out in a single column, more hail as precipitated water is carried to a greater height by the strong updraft before falling, and larger drops (and hence hail) as condensation is more rapid so fewer seeds are used, and more drops coalesce by collision.
That is an observable pattern in weather systems quite independently of any considerations of global warming. It also makes the prediction of more, and more intense thunderstorms a straightforward consequence of global warming. There are complications relating to changes in weather patterns making some areas drier. There are also complications relating to the spawning of the most damaging convective storms, ie, tornadoes and hurricanes/typhoons/cyclones.
The increased strength of convection is why the increased rainfall for the most intense 5% or 1% of rainfall events is expected to be much larger than 4% for a 4% increase in specific humidity.
Turning to your height analogy, which I like, but which should be used cautiously; if the average height increases but variability remains unchanged, then the occurrence of more extremely tall people by the old definition of extremely tall will increase. Indeed, this effect will occur for any definition of "extremely tall" which is greater than the increase in average height. Consequently it does not matter whether you use a definition of 2 SD deviations above the original mean height, or 4 SD. Both are expected to increase. The only significant difference is that the 2 SD definition gives you a larger sample of "extreme tallness" to test for any increase.
That is a crucial point. The effect of insisting on the more extreme definition is only to reduce your sample size, and hence make the data noisier.
As it is, weather bureaus have definitions of "extreme weather" based on a simple metric - is the weather such that people should be warned about a risk of loss of life or property. If it is, its extreme. If it isn't, it isn't. That is a low bar in terms of return periods, but it is very practical for people receiving forecasts. Somebody receiving an "extreme weather warning" does not care how many standard deviations from the mean, or what the return interval is. They care about whether they should get their car under cover, or whether they are at risk from flash flooding. Well, global warming predicts that "at risk" episodes due to weather will increase.
That is the hypothesis. For statistical convenience for some types of events (precipitation, thunderstorms) it is convenient to look at changes in return intervals to test that theory. For others (tornadoes and hurricanes), you just count the tornadoes and hurricanes and their relative intensity.
Given that global warming predicts an increase of "at risk" episodes, defining "extreme" to mean "at risk of major catastrophe" episodes only reduces your statistical sample. It is a ploy to hide from the evidence. Nothing more.
And on a side note, I (and I suspect Bérenyi Péter) are not experts in statistics (although Bérenyi is certainly much more competent than I am in that area). In contrast, Dikran is a genuine expert on statistics. To the extent that I am expert on anything (which I do not claim for anything) it would be logic and the use of words to convey meaning (philosophy of language). - 2010 - 2011: Earth's most extreme weather since 1816?
Norman at 06:24 AM on 4 July, 2011
Dikran Marsupial @ 213
"A warmer world means that the atmosphere can hold more water vapour, and thus there will be a strengthening of the hydrological cycle. A consequence of that is likely to be an increase in extreme weather in some places. Thus an increase in weather extremes is what you would expect to see if AGW is ocurring, but it isn't poof. If you think that is not good science, then it is your understanding that is at fault."
What you describe it the first stage of science. It is a hypothesis (educated guess). Inceasing the water vapour in the atmosphere should increase the normal rainfall amounts and you should see an upward rise for these measurements. I do not know how this would lead to a necessary increase in extreme weather in some places. I guess it comes down to how "extreme weather" is defined. There is a nice ongoing debate between you, Tom Curtis and Eric (skeptic) about what is an extreme weather or climate event. As of my post reading so far, it does not seem the issue is yet resolved.
Here is an analogy to consider.
On the Wikipedia explanation of Standard Deviation
Standared Deviation.
They give an example of Standard Deviation: "A slightly more complicated real life example, the average height for adult men in the United States is about 70", with a standard deviation of around 3". This means that most men (about 68%, assuming a normal distribution) have a height within 3" of the mean (67"–73") — one standard deviation — and almost all men (about 95%) have a height within 6" of the mean (64"–76") — two standard deviations. If the standard deviation were zero, then all men would be exactly 70" tall. If the standard deviation were 20", then men would have much more variable heights, with a typical range of about 50"–90". Three standard deviations account for 99.7% of the sample population being studied, assuming the distribution is normal (bell-shaped)."
The first point is what is a good definition of extreme height for an American male? Two standard deviations above the normal is 6 feet 3 inches (sorry for English terms or 1.95 meters). This is not an extreme height in my opinion. Tall yes, but not extreme. So extreme is in the "eye of the beholder". I will think 6' 8" (2.03 meters) would be an extreme height (like the Moscow heatwave "Take for example the Moscow heat wave of 2010, with an expected return interval, which lay just above 4 standard deviations above the mean for July temperatures" From Tom Curtis at 214).
That is the groundwork of this analogy. Now we have a population that wants to get taller so as a group they all begin to take a growth hormone which will raise the average height by 4% (the amount of water vapor that has increased in our atmosphere due to warming). 4% of 70 inches is 2.8 inches. Our entire population is 4% taller, some are more or less affected but the average increase is 4%. Will this 2.8" in average height now mean we have a noticeable increase in 7 foot tall men from this growth hormone? It may well do this. I would need some proof of it. No doubt if you keep increasing the moisture content you will reach a point where exterme events will be more likely (extreme based upon previous levels). I am not convinced, at this time, 4% is enough to push us to the new normal.
The statistical experts that post on this thread (Tom Curtis or Berenyi Peter) may be able to demonstrate a 4% increase would make it noticeably more likely to effect the far ends of the normal curve. I am not sure. There would be calculations for this. - 2010 - 2011: Earth's most extreme weather since 1816?
Norman at 09:46 AM on 29 June, 2011
adelady @95
I checked your Scientific American link and did not see what I was hoping to see. What do they call a climate disaster, what is the criteria, where are they taking place, is it as Tom Curtis states...they take one huge tornadic event that might destroy multiple sites and call this one disaster?
Here is all the link provided. "Researchers at the company, which obviously has a keen financial interest in trends that increase insurance risks, add 700 to 1,000 natural catastrophes to the database each year, explains Mark Bove, senior research meteorologist in Munich Re's catastrophe risk management office in Princeton, N.J. The data indicate a small increase in geologic events like earthquakes since 1980 because of better reporting. But the increase in the number of climate disasters is far larger. "Our figures indicate a trend towards an increase in extreme weather events that can only be fully explained by climate change," says Peter Höppe, head of Munich Re's Geo Risks Research/Corporate Climate Center: "It's as if the weather machine had changed up a gear." - 2010 - 2011: Earth's most extreme weather since 1816?
KR at 08:59 AM on 29 June, 2011
Norman - From adelady's excellent reference:
Munich Re, one of the world's largest reinsurance companies, has compiled the world's most comprehensive database of natural disasters, reaching all the way back to the eruption of Mount Vesuvius in A.D. 79.
That's an enviable database.
"Our figures indicate a trend towards an increase in extreme weather events that can only be fully explained by climate change," says Peter Höppe, head of Munich Re's Geo Risks Research/Corporate Climate Center: "It's as if the weather machine had changed up a gear."
You have (several times, now) tried to counter this evidence with claims based on US only, Omaha only, and other subset (i.e., cherry-picked) data - given the global data, you are entirely incorrect.
It's important to note that nobody can become expert in all things, and that it's therefore on occasion necessary to rely on others for information, such as in the global disaster/extreme weather case. Unless you (Norman) have the time, data access, and statistical background to truly investigate this topic, your personal opinion will still be less accurate than those who have made this their life's work. - Oceans are cooling
Tom Curtis at 12:33 PM on 20 May, 2011
Charlie A @67, I do not think anyone on this forum has accused you of Cherry Picking because of your graph with its start point in 1980. Nor is there anything wrong with that graph beyond the fact that it labels the OHC of the 0 to 700 meter layer as being the OHC simpliciter (a fault of the source of the graph, but not the sources documentation).
Tamino's graph was produced in one of two recent posts pointing out, and rebutting denier cherry picking. It is not a rolling five year average as DB's initial comment might suggest, but a plot of successive non-overlapping five year averages with the penultimate point being the mean of the years 2005-2009, and the last datum being an average of the data from January 2010 to present. (See the comment by Ned.) I personally think Tamino should have made the years 2006-2010 the final datum to not compare apples and oranges, but that is a minor point and would not make a substantive difference to the graph.
I say it makes no substantive difference because the mean of 2001-2005 would clearly be less than the mean of 2006-2010. Indeed, based on your plot of the running 21 quarter mean, it would be about 2.5*10^22 Joules less, which suggests that Tamino's use of just over a years data for the final datum under estimates the trend rather than over estimates it.
The red line on Tamino's graph plots a lowess smooth of the original data (not the means). In this case it overstates the final trend in the data, but in another example it understates it, so clearly Tamino is not fiddling with the smooth to exaggerate the trend.
When I say Tamino was rebutting cherry picking, I mean examples like this from Bob Tisdale:
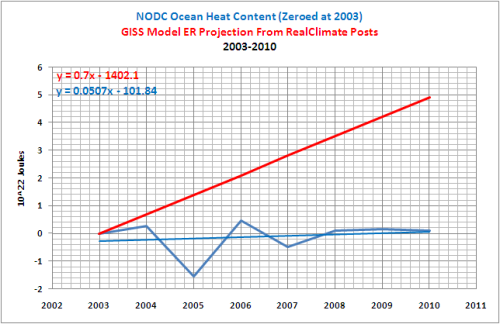
(Copied from Tamino)
Or this recent example by Berényi Péter in a comment on Skeptical Science:

In the later case, Berényi Péter simply wants to treat all pre-2003 data as void. That is, of course, absurd. The pre-2003, indeed, the pre-2005 OHC data is rightly suspect for determining inter-annual variability. It is, however, fairly robust for determining the decadal trend. As I have pointed out above, assuming the pre-2003 trend to be significantly different from that recorded implies a multitude of bizzare, and unsubstantiated hypotheses. (BP's effort was, of course, a double cherry pick in that he selects the 0-700 meter data when 0-2000 meter data was readily available.)
In Bob Tisdale's case, the cherry pick involves picking the year with the largest departure above the trend line as a start point for the prediction. This has the straight forwardly dishonest effect of displacing the "predictions" above the trend line so that even should data follow the trend, they will still be seen to be below the doctored "predictions".
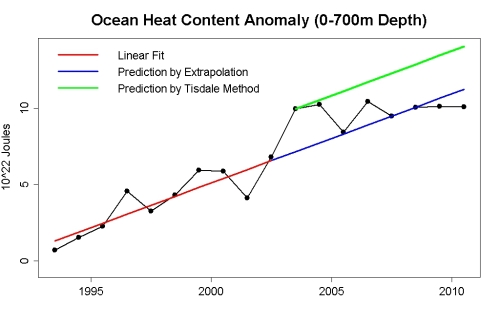
(From Tamino)
From your 66 above, it is plain that you are not trying to cherry pick in any such fashion. That makes it rather surprising that you chose to defend Pielke's rather straightforward cherry pick in 2007. Contrary to your claim, both Willis et al 2004 (which Pielke references) and Lyman, Willis and Johnson 2006 (which, surprisingly, he does not) show 2003 as the highest datum point, and indeed, 2003 lies above the long term trend in both. Despite this, in the true spirit which Tidale later copied), Pielke makes the 2003 the start point of his "prediction" for future OHC as a test case for AGW.
Finally there is nothing wrong with choosing 2003 (or better 2005) as a start year for an analysis of OHC. What is wrong is suggesting that previous measurements of the OHC trend are some how invalid because they predate the "Argo era". There are certainly issues in resolving annual variability in OHC prior to 2005, but that is not the same as issues resolving decadal trends. On this point I will let Willis have the last word:
"Second, This estimate only goes back to 2005. The reason for this is that Argo still has a number of floats for which no PI has responsibility for quality control of the data. For early incarnations of these floats, this could mean that significant (albeit correctable) biases still exist in the pressure data. Normally, these biases are corrected by the PI, but since these floats are sort of homeless, they have not yet been corrected. It is also difficult (or in many cases impossible) for the end user to correct these pressure data themselves. Argo is still trying to figure out how to deal with these data and I sure they will receive bias corrections eventually, but for the moment we need to exclude them. So, for this reason I am still not comfortable with the pre-2005 estimates of heat content.
Anyway, the consequence of this is that we still do not have a good estimate of ocean heat content changes from about 2002 to 2005, when the dominant data source for ocean heat content went from XBTs to Argo floats. For this reason, I remain a bit skeptical of any heat content estimates during that period. That said, however, I do think that longer-term estimates like those of Levitus et al., Domingues et al., and Lyman et al. are robust with respect to the long-term heat content increases. The issue with the 2002-2005 period is that the uncertainty during this period is still much larger than any year-to-year fluctuations that may exist."
(From an email to Roger Pielke Snr) - Lindzen Illusion #1: We Should Have Seen More Warming
Bob Lacatena at 07:04 AM on 23 April, 2011
61, Peter Freeman,
You can discuss the IPCC here only where you can directly tie it to Lindzen.
Your understanding of the leaked e-mails is incorrect. There are a variety of threads on that topic. You can use the search box at the upper left (just type in IPCC) to find them and learn more.
Concerning your anger... let me describe mine to you. Unlike you, I thoroughly understand the science. I invested a great portion of my life, starting in grade school, to understanding math and science. This equipped me well to understand climate science today.
I've since spent much time in the past years specifically studying climate science. I began as a true skeptic. There was a time, a period of about six months, where I vacillated between accepting and refuting climate change theory, as I came across what appeared to be one good argument one way, and then a refutation and argument the other way. I went back and forth and back and forth.
After a great amount of research and effort I came to recognize that current climate science is very, very solid, and all of the denial positions are built on misrepresentations and misinterpretations. Not some of them -- all of them.
Which leads me to my anger. I have a 16 year old daughter. Beyond her, I have a healthy respect for humanity, and those billions of people whom I will never meet who share this world with me, and must live with the consequences of climate change after I'm gone, when it will be both too late for me to act, and too late to even say "I'm sorry."
( - Snip - )
The effort to combat climate change, meanwhile, is actually minimal. It will not hurt economies. It will not cost jobs. It will take time, and if we start too late, it will cost more and take longer than it should.
So I, and many others here, get angry at people like Lindzen. I feel anger towards people like yourself, who get angry at the wrong problem, one that doesn't even really exist (i.e. the evil scientist cabal bent on one-world-socialist-government).
Climate change is serious. You owe it to your own stated respect for other people to research the issues further, and to take the time to learn whatever it is you need to learn to make sure that you have a valid and correct position on the issue.
Whether you are right or wrong isn't going to change what the planet does in the next twenty years, but you are going to have to shoulder your portion of the blame if we could do something but don't because of people who are ignorant of the science, and yet venomously vocal about the politics.
So... weigh your anger against mine. You can doubt my position, if you feel you are informed enough to do so, but you cannot doubt my intentions, or my right to my own anger, any more than you doubt your right to your own.
But in the end, whether one is right or wrong, anger is always an obstacle that must be overcome in order to do the right thing. - Christy Crock #4: Do the observations match the models?
Alec Cowan at 22:08 PM on 20 April, 2011
Again:
Can anyone comment on Johnston (substantiating it by citing Bender et al 2006, one of only 3)
GCMs may be biased towards more warming by overestimating the Earth's albedo[from: http://www.johnstonsarchive.net/environment/gw.html ---not linked intentionally]
Don't forget he is a PhD in Physics claiming to be "a research physicist in the field of space physics"
Feel free to compare that phrase with Bender 2010 "Planetary albedo in strongly forced climate, as simulated by the CMIP3 models", who says in the abstract:
In an ensemble of general circulation models, the global mean albedo significantly decreases in response to strong CO2 forcing. In some of the models, the magnitude of this positive feedback is as large as the CO2 forcing itself.
C'mon! Don't be shy!
Don't you feel there's a lot of quacks out there?
I also want to thank Berényi Péter for promoting one change in me and a tiny little bit of epiphany. First, owing to the analysis that his/her words incited me to do, I have now a much higher respect for models and modeling. If one of those 20 models can use the following grid:
and yet obtain values that resemble the real ones, I only can say "Chapeau!". The image is taken of some internal paper dealing with the the details of their model, publicly available in their website. I'm telling which one by saying it was made in the terre des nos aïeux.
The little bit of epiphany is that Bender et al 2006, precisely by means of the implications of the image dropped here by Berényi Péter and by settling the question above in this message, it all provided me with a very real case of what James Wight says in this post, that is, "And where they do diverge from climate models, the observations are usually even more alarming." - Christy Crock #4: Do the observations match the models?
Alec Cowan at 07:53 AM on 20 April, 2011
@Berényi Péter #37
So your epistemology doesn't reject my model and roughly the epistemological path proposed is accepting or rejecting a model depending on who did it or whether it was included in some other work?
The first 6 models in your conjunction pretty much coincide with ERBE and don't exclude each other in one sole backwards rendition of one dependent variable. The first 11 models in it match ERBE al least in the queues. So if the AR included just 11 models your objections would be less, and if it included 6 models, your words fall [It all indeed does to what really is in Bender's]. So 20 models are not included to provide the widest variety of approaches and to illustrate the state of the art of something but just to show redundantly the clumsiness of what is behind so the Berényi Péters of the world can shine, even when they descend to the use of pictures?
Your "conclusions" are too much dependent on keeping control on which is included in the story and how the story is told. Add just marshmallows and a bonfire. - From The Halls of Montezuma
arch stanton at 03:28 AM on 9 April, 2011
I agree with Peter about the blood alcohol analogy. This part of his presentation seems geared towards new recruits rather than the somber crowd he seems to be addressing. OTOH his basic premise is that a “small” change of something minuscule can indeed make a big difference is true.
While we’re talking about presentation…I would not say that 390ppmv is too dangerous and needs to be reduced (at least until some energy efficient, low cost form of C sequestration is developed) for 2 reasons:
1) I don’t believe it. We are indeed flirting with danger (we could argue about the definition of “flirting with danger” vs “dangerous” but regardless I put it as a lower danger than you seem to despite similar CO2 levels. Humans are adaptable, Pliocene time scales are vast.
2) More importantly: It feeds the fourth stage of denialism*: The attitude that all is lost so we may as well party on.
Related to my point #1…Although we all know that that the sun was dimmer half a million years ago, I have never seen anyone quantify the earth’s core heat flux changes due to the decay of radio nucleotides. Has anyone here seen a paper or discussion addressing this factor? Is it significant?
Thanks, arch
*(1=”It’s not happening” 2=”It’s happening but it is not bad” , 3=”It’s bad but we are not causing it” 4="It’s happening, it’s bad, we are causing it but there is nothing we can do about it”). - Climate myths at the U.S. House Hearing on climate change
Steve L at 01:45 AM on 7 April, 2011
I am struck by the multiple references to the "1970s Global Cooling" myth. It really resonates somehow with these people. It's wrong on so many levels! But I'd like to pick on one aspect that I don't think has been thoroughly discussed here before.
Sure Peterson, Connolley, & Fleck found 42 of 68 papers from "Global Cooling" literature predicted warming vs only 10 predicting cooling. But how did they come to their conclusions? Which were merely extrapolations of short term statistical trends? Which were based on physical models of the climate system? I have a strong suspicion that this comparison would show models predicting warming.
What models would predict cooling? Given the uncertainties in aerosol forcing more than 30 years later, I can't imagine very strong confidence back then. I suspect the predictions of cooling were based primarily on either natural caused cooling (orbital forcing) or other natural cycling (phases of oceanic state) or continuing of recent trends. In 2011, ocean cycles and recent trends are the two things still faithfully put forward by 'skeptics' for predicting the future.
Which approach was better 30 years ago? The physical models that they so distrust! - Dana's 50th: Why I Blog
citizenschallenge at 17:19 PM on 28 March, 2011
Dana, Congratulations on fifty excellent posts and on your fiftieth post!!
It did a very nice job of summing up the story. And I always love those relevant hot links.
I have benefited from reading your posts and look forward to many more.
peter - Interactive animation of the climate change impact on agriculture
Albatross at 03:41 AM on 11 March, 2011
Folks, how about we defer to the experts on this? Here is what Dr. Peter Reich had to say in response to Monckton's misinformation (similar to what is being perpetuated by "skeptics" on this thread) on this issue (from here):
"The best evidence from state-of-the-art free-air carbon dioxide enrichment experiments is inconsistent with the notion of major sustained increases in crop yield in a world of doubled atmospheric CO2. Quantitative analyses and syntheses of those experiments indicate that the direct effects of elevated CO2 will increase crop yields by 13% (on average for those with the C3 photosynthetic pathway, such as wheat, soybeans, rice) or 0% (on average for those with the C4 photosynthetic pathway, such as corn, sugar cane, and sorghum); not the 40% Lord Monc[k]ton suggests. Moreover, these estimates ignore (1) indirect effects of CO2 as a greenhouse gas on future temperatures,
precipitation, and their variability, and hence on future crop yields and (2) other consequences of fossil fuel burning such as rising ozone pollution that will reduce crop yields. The bottom line for crop yields: combined effects of fossil-fuel burning (rising CO2, rising O3, climate change) are uncertain but at least as likely to be negative as positive, and shifting increasingly towards the negative the higher that CO2 concentrations rise."
Dr. Peter Reich: Regents Professor and Distinguished McKnight University Professor, University of Minnesota’s Department of Forest Resources. His teaching and research focus on ecology, global change, and the sustainability of managed and unmanaged terrestrial ecosystems. Regionally, his interests lie in the forests and grasslands of mid-North America and globally on terrestrial ecosystems in aggregate.
I'm going with the science and Dr. Reich on this one. - The Good, The Bad and The Ugly Effects of Climate Change
Tom Curtis at 03:05 AM on 7 March, 2011
Berényi Péter @84, this study shows that the ideal temperature (for the Dutch) is 16.5 degrees C, with mortality increasing 1.75 times as fast for each degree over as it does for each degree under (on average) but still showed more deaths from cold than from heat. Presumably this is because in Holland, the coldest days are much further below the safe level than the hottest days are above it, although different heat responses to different diseases may also be relevant.
Similar studies in England and the US show varied effects. In England the cold related mortality is higher, whereas in the US, with a mixture of temperate and subtropical cities, it was found that there are no cold related deaths in subtropical cities, although there are heat related deaths. There are both heat and cold related deaths in temperate cities.
The obvious conclusion is, firstly, that you estimate that 26.74 degrees C is the temperature that minimizes temperature related effects on mortality is in significant error. Even if it were not, such temperatures are typical of mean summer temperatures in the tropics. Further, for the majority of the world's population (who live in the tropics and subtropics) heat is a potential killer, but cold is not. Your equation that we should go for higher temperatures to reduce mortality only makes sense if the deaths of people of the tropics and subtropics is inconsequential compared to those of people in temperate zones.
Even in temperate Holland, Business As Usual scenarios will raise temperatures sufficiently as to turn around the proportion of those killed, so that heat becomes the major killer rather than cold. Arguably, the reduction in cold related deaths will compensate for the increase in heat related deaths. But in that case the equation for increased temperatures is no significant change in temperature related deaths in temperate zones; but a significant increase of them in the tropics and sub tropics.
We conducted the study described in this paper to investigate the impact of ambient temperature on mortality in the Netherlands during 1979–1997, the impact of heat waves and cold spells on mortality in particular, and the possibility of any heat wave- or cold spell-induced forward displacement of mortality. We found a V-like relationship between mortality and temperature, with an optimum temperature value (e.g., average temperature with lowest mortality rate) of 16.5°C for total mortality, cardiovascular mortality, respiratory mortality, and mortality among those ≥ 65 year of age. For mortality due to malignant neoplasms and mortality in the youngest age
group, the optimum temperatures were 15.5°C and 14.5°C, respectively. For temperatures above the optimum, mortality increased by 0.47, 1.86, 12.82, and 2.72% for malignant neoplasms, cardiovascular disease, respiratory diseases, and total mortality, respectively, for each degree Celsius increase above the optimum in the preceding month. For temperatures below the optimum, mortality increased 0.22, 1.69, 5.15, and 1.37%, respectively, for each degree Celsius decrease below the optimum in the preceding month. Mortality increased significantly during all of the heat waves studied, and the elderly were most effected by extreme heat. The heat waves led to increases in mortality due to all of the selected causes, especially respiratory mortality. Average total excess mortality during the heat waves studied was 12.1%, or 39.8 deaths/day. The average excess mortality during the cold spells was 12.8% or 46.6 deaths/day, which was mostly attributable to the increase in cardiovascular mortality and mortality among the elderly. The results concerning the forward displacement of deaths due to heat waves were not conclusive. We found no cold-induced forward displacement of deaths. Key words: cold spells, heat waves, mortality, mortality displacement, Netherlands, temperature. Environ Health Perspect 109:463–470 (2001). [Online 3 May 2001] - Roy Spencer’s Great Blunder, Part 2
Riccardo at 22:09 PM on 2 March, 2011
As for the problem of the rising of the emission level above the tropopause (Peter Offenhartz #8), the height of the tropopause depends on temperature. An increased GHG absorption will move both the tropopause and the emission level upward.
In equilibrium and at wavelengths where the atmosphere is optically thick, the emission level will roughly be that corresponding to the effective temperature of the planet of about 220 K. In reality, the absorption coefficient depends on the number concentration of CO2 (number of molecules per meter squared), not relative concentration (ppm), and hence on pressure and altitude. Detailed calculation are required. - A Swift Kick in the Ice
muoncounter at 16:33 PM on 19 February, 2011
Rob: Better to say 'Arctic amplification' than 'polar' for the current context, as the South seems to respond dramatically differently.
Serreze et al 2009 is a key paper describing what's happening in the Arctic.
As the climate warms, the summer melt season lengthens and intensifies, leading to less sea ice at summer’s end. Summertime absorption of solar energy in open water areas increases the sensible heat content of the ocean. Ice formation in autumn and winter, important for insulating the warm ocean from the cooling atmosphere, is delayed. This promotes enhanced upward heat fluxes, seen as strong warming at the surface and in the lower troposphere. This vertical structure of temperature change is enhanced by strong low-level stability which inhibits vertical mixing.
Peter Hogarth did an excellent post on this as well. - The Dai After Tomorrow
Riccardo at 19:59 PM on 18 February, 2011
Berényi Péter #8
"The statement above is actually a coward one."
You're talking a-scientific here and a bit insulting. I'm sure you know very well that hardly any absolute certainty can be found in cutting edge science. Your accusation of cowardice is really a shame and inappropiate here. - CO2 lags temperature
chris at 15:44 PM on 4 February, 2011
Berényi Péter at 12:04 PM on 4 February, 2011
"I do realize it is a community of climate policy makers who try to do some science in their spare time, as they are posting there regularly in office hours. Check the timestamps."
Oh dear Peter, your prejudices are showing!
The RealClimate "community" are extraordinarily productive scientists. We could look at the first two on RickG's list just above, for example, and find that Gavin Schmidt has published since 2005 more than 40 papers (in real science journals) which have been cumulatively cited well over 1000 times, and that Michael Mann has published over 40 papers since 2005 that have been cited around 800 times....
these are truly impressive records of scientific productivity during the period they (and others) have been running RealClimate.org.
I wonder whether you misunderstand the nature of science in the modern world. Every grant application we write, for example, must include descriptions on how our research results will be disseminated, and the enhancement of public understanding is a fundamental element of the scientists role.
Schmidt and Mann and the "community" at RealClimate illustrate how a straightforward and honest application to obtaining and disseminating knowledge go hand in hand. And while their "timestamps" indicate that they may fulfill some of their public understand roles during office hours (and why not?) you can be sure that like most scientists that work in the public sphere, they will be doing science outside of office hours too!
Peter, do we really want our scientists to be "office drones"? Of course not...we want them to be insightful and productuve and their work to be useful and influential....rather like the "community" at RealClimate - The Queensland floods
Tom Curtis at 10:54 AM on 14 January, 2011
Berenyi Peter @52, if you look at the trend map for precipitation over the same period, you will see that simply taking an Australian average hides a lot of devil in the detail

In particular, the increase in average rainfall in the north of Western Australia and the Northern Territory clearly dominates the average, but that does not free Queensland and Victoria from their recent trend towards droughts in most years, nor Perth from its ongoing drought even in this wetest ever of Australian years. - Renewable Baseload Energy
KR at 01:54 AM on 4 December, 2010
Ned - well put.
I've frequently expressed my opinion that increasing nuclear will be part of the forward energy mix. I suspect breeder reactors of some type (including thorium cycle) will be needed.
But treating this issue as an Either/Or proposition, ignoring valid and honestly asked questions, pooh-poohing renewable data sources while using nuclear sources uncritically, and denigrating and insulting those you disagree with, well - that doesn't add to the discussion, or to my willingness to put up with such nonsense.
Peter Lang - You've made some good points about relative costs. You've made some bad ones about site distribution of renewables and the backup load requirements of uncorrelated sites (if sufficiently uncorrelated sites are available in Australia, which I regard as an open question in the absence of a decent wind/solar survey).
I just wish you would drop the arrogance. And actually add to the discussion with what information you have. - Renewable Baseload Energy
swieder at 09:54 AM on 2 December, 2010
@Peter Lang
You quote me not completely: my point was that of 500 GWp renewable (which is 30% of the estimated need for China in 2020 if you read the report i linked to), 200GWp is non-hydro. So the 200 GWp is already over your artificial 10% threshold you are willing to neglect. I say the 200 GWp is large enough in order that baseload-ability has to be considered.
Also, I am looking forward to the rest of my points in #207 and not only the first 5 lines. - Renewable Baseload Energy
archiesteel at 02:29 AM on 2 December, 2010
@moderator: so sorry, I only now saw your requests (that's what happens when you go through "Recent Comments" instead of the actual threads...). I'll refrain from pushing the subject further here. Anyway, I've pretty much said everything I needed to say about Peter's aggressive sales pitch. I can't stand his not-so-veiled insults towards those who *dare* think renewables also have a place in the future energy mix.
As for their links, at this point it should be considered blogspam for Brave New Climate. When pretty much all of one's references come from a couple of web sites, it's usually a sign you're pushing some sort of agenda... - Climategate: Impeding Information Requests?
Marcus at 18:16 PM on 27 November, 2010
Camburn, the fact that the long-term trend is "down" over the last 8,000 years doesn't mean a thing-its exactly what we'd expect from our position in the current Milankovitch cycle. The fact is, though, that this downward trend is infinitesimally small-properly measurable only on a multi-century time scale. Similarly, the upward trend since 1850 actually petered out around the 1930's-1940's, & was driven by a massive increase in solar activity. Yet this upward trend was still less than *half* the speed of the trend we've seen in the last 30 years (in spite of falling sun-spot numbers). So, yes, the climate has changed before-but did so according to well known *Natural* forcings-& occurred at a much slower pace than what we're seeing now. Also, if the current rate of climate change persists, we could end up with global temperatures *higher* than during the Holocene Climatic Optimum. - What should we do about climate change?
kdkd at 08:07 AM on 7 November, 2010
Peter Lang #368
My hot water heater may not be an electricity generation system, but as it replaced an immersion heater, it certainly has a substantial impact on demand (reduced our household consumption by about one third).
I'm concerned that your argument is geared towards confirming your assumptions. That is, you're aggressively arguing your case, without examining if the assumptions of your argument hold up to scrutiny. If you start making the assumption that some of the premises of your argument are incorrect, and use that to test the quality of your argument, then I'm going to be in a much better position to accept the veracity of your position.
For example, what effect would a smart grid have on peak demand if 'discretionary' heating and cooling activities could be moderated through demand side management? What synergistic effects would this have if wind and solar sites were placed to reduce the problems of intermittency? And so on.
Right now, I see you agressively defending your own argument with no evidence that you've challenged your own assumptions.
Once the small scale safe nuclear stuff is clearly viable, and commercially available, I will be writing to my politicians by the way. - What should we do about climate change?
Daniel Bailey at 09:19 AM on 4 November, 2010
Re: gallopingcamel (272), Barry Brook (277), Peter Lang (254, et al)
Apologies for not attending to this earlier (still Internet-access-challenged for a few more days).
Several posters upthread had queried Peter as to his position on AGW (for various reasons I, which I won't dwell on here). Curious, I asked Peter myself in my comment at 249. My reasoning for doing so was stated there.
Peter was kind enough to respond to me in his comment at 254, wherein he spelled out what he would talk about INRE: Co2"I’ll talk about cutting CO2 emissions, costs of doing so, security of supply etc, and leave others to join the dots in the way they want to."
But he again declined to specify a position on AGW. Very curious. Why have CO2 emissions reductions as an area of concern when Peter won't even acknowledge the veracity of the science behind it (which says it's a profound problem)? And if he is indeed truly pro-AGW on other websites, why the sudden reticence here?
I do not dispute his knowledge on NP (far in excess of mine). Heck, I agree that NP should be a primary (short term and long term) replacement for fossil fuels. But, given the current prevailing public sentiments towards NP, pragmatism dictates an inclusionist perspective at the "lets replace fossil fuels as energy sources" dinner table party. I was not dictating any specific mix, but in my response at 267 I did specify that NP should be central to the equation.
So, why does Peters silence on AGW matter? It revolves around the fundamental crux of education. Without acknowledgement of a need to change, change cannot readily take place. For example, alcoholics will not begin to recover until they admit they have a problem. Our world has a problem with excess CO2 emissions. That is what the science tells us. The role of educating the world on the dangers of excess CO2 has to be filled somehow, by someone or something. That is the role for SkS: convincing those who will convince the world of the need to leave fossil fuels in the ground, where they can do no further damage to the world on which all of us depend.
Given success in that educational path, a replacement stategy for coal as a source for energy production has to then be developed and sold to the public. In that area, Peter's knowledge and expertise would be valuable. But if he's unwilling to be transparent about potential conflicts of interests and motivations here, among a more friendly and receptive audience, how much sway will he have convincing the public at large?
One more thing: even if a full-NP solution is implemented, rollout will take time. Without the education to convince areas without NP to replace fossil fuels, do you really think people won't continue to burn what they have? Even a full-blown implementation of everything we have, solar, hydro, tidal, geothermal, wind, NP...all will take years to roll out and implement. During which CO2 will still be injected into the carbon cycle. How much is too much? How much time do we have? At some point, where do we cross that line in the feedback process where methane clathrate/hydrate releases from permafrost go from a remote possibility to a real possibility? To an eventuality? Can anyone say that we haven't already crossed that line? Bueller?
Disaster planners speak of planning for the worst possibility, not the worst expectation. A PETM-style methane release from permafrost hydrate/clathrate stores is still just a possibility at the moment (from my understanding of the literature). But given the uncertainties, to avoid a shift into it becoming a probability, every effort to avoid more CO2 releases by humans should be undertaken wherever and whenever possible.
This experiment we are in the middle of can only be done once. There are no do-overs. No extra lives. Who amongst you feels differently? On what knowledge do you base this? Please do share, if so.
Peter, I care about my children, my neighbors, my countrymen, my race. As I'm sure you do as well. I respect your obvious knowledge and expertise on NP. I feel NP must occupy a central role in weaning the world off fossil fuels, with time of the essence. But I don't need you compromising your potential role in the upcoming educational process with the public, which must take place, because you feel reluctant to take a stand on AGW here, among a friendlier audience than you'll find in the world at large. I need you to step up here, for me, my children and yours. And everyone else.
The Yooper - What should we do about climate change?
CBDunkerson at 23:09 PM on 3 November, 2010
Peter Lang #282: "At the same time they are forcing governments to waste extraordinary amounts of money and national wealth on subsidising renewables. For no significant benefit. That is the political and policy environment we are in."
None of this seems remotely accurate to me. Subsidies on renewable energy have been tiny. If you add it all up renewable power gets LESS public funding than nuclear... and those two combined are insignificant compared to the subsidies fossil fuels have received.
If you've got a study which says otherwise I'd love to see it because every one I've ever looked at makes it very clear that this claim that renewables get the most funding is pure nonsense. The closest I've seen on that would be studies showing that R&D subsidies for renewables are about the same as those for fossil fuels (but about HALF the R&D subsidies for nuclear) or studies that look at current subsidy amounts divided by the total energy production of each energy type... which is misleading since it ignores all the past subsidies which went into developing the massive fossil fuel infrastructure.
"My position is I want to see an economically rational level playing field."
No objections there... we just need to base 'economically rational' on actual costs vs fictional costs.
"1. coal generates about 80% of Australia’s electricity. Baseload amounts to about 75% of our electricity consumption."
I've read alot more about US, European, and global energy use than I have Australian so that may be part of the disconnect. Has the Australian government provided inordinate amounts of support to renewable energy? I wouldn't know. Seems unlikely given the strength of the 'global warming is a myth' contingent in Australian government. That said... Australia has huge amounts of sun drenched little used land in the interior. I believe the south coast also has decent wind power potential. So what would be wrong with developing such resources in the areas they are viable?
"3. Nuclear and pumped hydro could meet all our requirements now. That would provide very low emissions electricity, and at the least cost (if we removed the impediments)."
Consider for a moment a small isolated community in central Australia. They have low electricity needs, but they are far away from any large waterway or existing electrical grid. Which is going to be least expensive:
1: Building them their own nuclear power plant.
2: Building the electrical grid out from a major population center hundreds of miles away to their small community.
3: Building a small solar thermal power plant outside town.
If you didn't say 3 then you are lying to yourself. If you did then you must see that 'nuclear and hydro would be least expensive' is false... there are situations where other power sources will clearly cost less. There are many isolated mountain communities around the world where the same issues make wind power the best choice. Ditto islands all over the world. Then add in all the places which will refuse nuclear power. You may not like it, but it is REALITY. Refusing to accept reality is a poor foundation for any plan of action.
"4. Solar and wind cannot provide baseload power. They are unlikely to be able to for a very long time, if ever. I doubt solar will ever be viable for baselod generation."
Simply not true. Setting aside space based solar and high altitude wind as technologies not yet ready for the mainstream (like thorium reactors for instance) it is still entirely possible for wind and solar to provide stable baseload power. This can be accomplished by storing energy during peak generation periods for use during peak demand periods and/or by having a large enough grid with enough excess capacity to meet demand even during low production periods.
How can you advocate pumped hydro and not see how that, amongst MANY other options (e.g. molten salts, graphite heat sinks, compressed air, actual batteries, et cetera), can solve the supposed 'baseload problem'? Wind blows more than needed somewhere on the electrical grid... the excess is directed towards pumping water uphill... some part of the grid later doesn't have enough power... that pumped water is allowed to run downhill through a hydro power station... required energy is supplied. No amazing new technology or massive investment required. Simple application of existing technologies. - Greenland ice mass loss after the 2010 summer
mspelto at 23:37 PM on 1 November, 2010
Icesat which is a separate data set is showing a loss of a similar magnitude to the GRACE data set, that is indicating the result is robust. From a submitted paper Sørensen et al (2010) "We find an annual mass loss of the Greenland ice sheet of 210 ± 21 Gt yr−1 in the period from October 2003 to March 2008. This result is in good agreement with other studies of the Greenland ice sheet mass balance, based on different remote sensing techniques". This year for northwestern Greenland the snowline's were quite high from early in the melt season. This is one of the factors that raised the vulnerability of the Petermann Glacier. Going forward it will raise the vulnerability of Ryder Glacier and others. - What should we do about climate change?
CBDunkerson at 19:45 PM on 30 October, 2010
Peter #175: So... your evidence that solar, wind, and hydro power are NOT safer than nuclear is that nuclear is safer than coal.
Who could argue with such logic?
BTW, the report you cite... doesn't cover solar at all, but finds hydro and wind to be safer than nuclear.
And that's despite a ridiculously pro-nuclear bias, limiting the study area to exclude all previous nuclear disasters, and defining 'safety' based on what HAS happened in the past rather than what COULD happen in the future.
In short... you're wrong and even a study biased towards your position STILL says you're wrong. - What should we do about climate change?
archiesteel at 15:08 PM on 30 October, 2010
@Peter Lang: "I do not have any personal stake in nuclear power."
I didn't say you, I said you sounded like you did - and your insistence on nothing but nuclear is bound to turn people off of it.
It is the unfounded belief and advocacy of renewables that is political.
And yet, as the German example shows up (and I notice you didn't reply to that part), it *is* possible to have a significant power supply from renewables. Why are you ignoring the great opportunity Solar and Wind offer to small client/producers?
"Ann, you seem to be arguing for anything but nuclear. I wonder why? What is your real reason?"
It is you who are insisting that nuclear is the only way forward. Any strategy that puts all of the eggs in the same basket is doomed to fail.
I'm sorry, but your posts really sound like ads for the Nuclear Industry. You'll get more traction if you start selling Nuclear as *part* of the solution, rather than the only way to go.
"The wind industry, like most industry organisations, presents the most favourable view possible of its industry."
Like the Nuclear industry as well, right? The criticism of wind not prevent CO2 emissions can also be applied to Nuclear.
Again, I'm not opposed to nuclear power as part of the alternative to fossil fuels, but the pro-nuclear bias in your messages seems a bit extreme. - DMI and GISS Arctic Temperatures: Hide the Increase?
Klaus Flemløse at 06:57 AM on 25 October, 2010
Peter Hogarth at 06:30 AM on 25 October, 2010
Thank you Peter Hogarth
This is what I whant to see.
Looking forward to read the excel sheet with DMI data.
Regards
Klaus Flemløse - CO2 lags temperature
Tom Dayton at 06:01 AM on 25 October, 2010
mistermack, you are incorrect that runaway warming was happening but something else stopped it. Positive feedbacks that are not of the runaway variety never can run away. They are self-limiting. Each little bout of positive feedback is just that--a little, short-lived bout that inherently, by its fundamental nature, will die out. They do not strain toward running away. They are introspective. Belly button "innies" rather than "outies."
In our current era, there is a lot for us to worry about despite the lack of the runaway variety of positive feedback, because we keep adding greenhouse gases; our addition of greenhouse gases is a forcing. The non-runaway positive feedback amplifies the effects of those additions. If we suddenly stopped adding greenhouse gases and all other emissions, temperature would continue to rise for several years due to the Earth working toward equilibrium, but then the temperatures would fall. If we continued to emit but at a constant rate instead of an increasing rate, temperature would continue to rise for longer but then would asymptote.
Tying all that back into the topic of this post: Those past CO2 positive feedbacks also were not of the runaway variety. So they, too, inherently would peter out. Unlike the human-caused addition of CO2, there was no forcing by independent addition of CO2. CO2 was instead acting as a non-runaway feedback. Other, forcing and feedback, factors needed to keep stimulating the system and thereby prompting more (non-runaway) positive feedback from CO2. Most prominent among those factors was orbital cycles, but there also were effects of changes in vegetation, dust, snow and ice cover,....
So your question "what made the temperature rise stop" is ill posed. The better question is "what made the temperature continue to rise as long as it did?" - DMI and GISS Arctic Temperatures: Hide the Increase?
Klaus Flemløse at 05:18 AM on 25 October, 2010
Peter Hogarth,
Thank you for your remarks.
Frank Lanser has been so kind as to produce an excel sheet with the data behind his temperature graph. You can find it below:
http://hidethedecline.eu/media/BLANDET/DMIIS.xls
I understand from your latest remarks that you have access to the corresponding data from DMI.
I would be pleased if you could provide Skeptical Science readers with the DMI data in excel format.
I am looking forward to doing a reconciliation of the two datasets.
Regards
Klaus Flemløse - DMI and GISS Arctic Temperatures: Hide the Increase?
FLansner at 22:33 PM on 23 October, 2010
Hi Peter!
At first glimpse your work appears brilliant, i will dig into it as soon as i get a little time.
I just want to comment fast: The general picture, that the dive in DMI data might be caused by my pixel counting is flat wrong. Just check out years in the DMI link:
http://ocean.dmi.dk/arctic/meant80n.uk.php
1991, 1993-4 shows temperatures above average in the melting period while 2010 shows temperatures clearly below average. So the essence here has nothing to do with my pixel counting that could lead to a little marginal error in both directions.
So therefore as i said earlier, either DMI´s data in melt season are pretty useless or else we have had a cooling in the meltperiod 80N-90N from 1991 and foreward.
And both options to me are surpricing and "hard to swallow". If you are correct above, then i believe that DMI´s presentations contains rather fundamental errors.
It simply doens make sence to present melting temperatures warmer than average in 1991 and colder than average in 2010 if this has nothing to do with reality.
I think i will forward your work to DMI, perhaps?
K.R. Frank Lansner - DMI and GISS Arctic Temperatures: Hide the Increase?
FLansner at 08:16 AM on 23 October, 2010
archiesteel at 07:33 AM on 23 October, 2010
"Also, you have been asked repeatedly: could you provide the data you used to generate your graphs?"
Archiesteel, i have really been extreeeemly busy, so my comments here have been written in time i dont have.
And i think you can see, that i have had plenty of comments that i should considder in this and other blogs.
Im not sure what you look for, as my results as described on my site is not 100% accurate.
Here are yearly values:
http://hidethedecline.eu/media/BLANDET/DMIIS.xls
But as i understood Peter Hogarth, he has actually got his hands on DMI numbers up to 2009 and alittle beyond.
And Peter i would like very much to see those data :-)
THen, Archiesteel you write: "...and yet both GISS and DMI show the same warming trend, as demonstrated above. How do you respond to this?"
?? Are you back to yearly numbers again or???
Please, I have shown trends 80N-90N in summer months DMI (ERA-40) data:
http://hidethedecline.eu/media/GlobalIceExtend/fig1.jpg
VS GISS 80N-90N summer data:
http://hidethedecline.eu/media/GlobalIceExtend/fig2.jpg
So 80N-90N, summer data does NOT show a match between GISS and DMI. You must be thinking of yearly data whoch was not what my article was about. Please lets move forward now.
you write "Your site is under attack because the science presented on it is of shoddy quality"
Well, feel free to argument on any topic mentioned whereever and whenever you want. until then, its very easy for you just to come with claims like that out of thin air.
Im in for a debate on ANY topic in the climate debate.
K.R. Frank - DMI and GISS Arctic Temperatures: Hide the Increase?
Ned at 12:47 PM on 21 October, 2010
Your [Peter's] carefully researched postings really raise the level of discussion.
Yes. This is a really nicely done post. Like michael sweet, I really look forward to new comments or posts by Peter Hogarth. - DMI and GISS Arctic Temperatures: Hide the Increase?
Peter Hogarth at 09:04 AM on 21 October, 2010
Berényi Péter at 01:53 AM on 21 October, 2010
The first data you cite is ocean flux buoy data (ocean temperature data) which is not quite relevant to surface temperature, but the second linked data set is recent and pertinent. The snippet of data in the link very nicely shows the Summer 0 degrees C clipping effect. I will try to get the complete high resolution time series updated (given time) as I have the earlier buoy data. If we look at slightly less up to date buoy data as in Polyakov 2002, where: “The datasets of monthly surface air temperature and sea level pressure used in this study contain data from land stations, Russian NP stations, and drifting buoys operated by the International Arctic Buoy Programme (IABP)”. We see again GISS correlates well over the buoy data period. Below I have plotted the Polyakov Arctic annual values with publicly available GISS annual Arctic zonal values. The buoy data is used from around 1950 onwards in Polyakov.

More than 100 comments found. Only the most recent 100 have been displayed.
More than 100 comments found. Only the most recent 100 have been displayed.


THE ESCALATOR

(free to republish)