


 Arguments
Software
Resources
Comments
The Consensus Project
Translations
About
Support
Arguments
Software
Resources
Comments
The Consensus Project
Translations
About
Support
![]()
![]()
![]()
![]()
![]()
![]()
![]()
![]()
![]()
![]()


![]()


Latest Posts
- At a glance - Clearing up misconceptions regarding 'hide the decline'
- Pinning down climate change's role in extreme weather
- 2024 SkS Weekly Climate Change & Global Warming News Roundup #17
- Fact Brief - Is Antarctica gaining land ice?
- Simon Clark: The climate lies you'll hear this year
- Skeptical Science New Research for Week #17 2024
- Water is at the heart of farmers’ struggle to survive in Benin
- At a glance - The difference between weather and climate
- India makes a big bet on electric buses
- 2024 SkS Weekly Climate Change & Global Warming News Roundup #16
- EGU2024 - An intense week of joining sessions virtually
- Skeptical Science New Research for Week #16 2024
- How extreme was the Earth's temperature in 2023
- At a glance - Is the science settled?
- What is Mexico doing about climate change?
- 2024 SkS Weekly Climate Change & Global Warming News Roundup #15
- Fact Brief - Did global warming stop in 1998?
- Skeptical Science New Research for Week #15 2024
- EGU2024 - Picking and chosing sessions to attend virtually
- At a glance - The Pacific Decadal Oscillation (PDO) is not causing global warming
- Climate Adam: Is Global Warming Speeding Up?
- 2024 SkS Weekly Climate Change & Global Warming News Roundup #14
- Gigafact and Skeptical Science collaborate to create fact briefs
- Skeptical Science New Research for Week #14 2024
- How can I make my retirement plan climate-friendly?
- At a glance - Global warming and the El Niño Southern Oscillation
- A data scientist’s case for ‘cautious optimism’ about climate change
- 2024 SkS Weekly Climate Change & Global Warming News Roundup #13
- Skeptical Science New Research for Week #13 2024
- You can start applying for the American Climate Corps next month
Comment Search Results
Search for lessons from past climate predictions
Comments matching the search lessons from past climate predictions:
- Models are unreliable
Bob Loblaw at 05:02 AM on 5 September, 2022JohnCalvinNYU:
I"m really not sure just what definition of "accurate" you are using. If you are expecting it to be "perfect", then prepare to be disappointed. Science (and life in general) does not produce perfect results. Any scientific prediction, projection, estimate, etc. comes with some sort of range for the expected results - either implicitly, or explicitly.
You will often see this expressed as an indication of the "level of confidence" in a result. (This applies to any analysis, not just models.) In the most recent IPCC Summary for Policymakers, the state that they use the following terms (footnote 4, page 4):
Each finding is grounded in an evaluation of underlying evidence and agreement. A level of confidence is expressed using five qualifiers: very low, low, medium, high and very high, and typeset in italics, for example, medium confidence. The following terms have been used to indicate the assessed likelihood of an outcome or result: virtually certain 99–100% probability; very likely 90–100%; likely 66–100%; about as likely as not 33–66%; unlikely 0–33%; very unlikely 0–10%; and exceptionally unlikely 0–1%. Additional terms (extremely likely 95–100%; more likely than not >50–100%; and extremely unlikely 0–5%) are also used when appropriate. Assessed likelihood is typeset in italics, for example, very likely. This is consistent with AR5. In this Report, unless stated otherwise, square brackets [x to y] are used to provide the assessed very likely range, or 90% interval.
So, the logical answer to your question of why models are constantly being updated or improved is so that we can increase the accuracy of the models and increase our confidence in the results. Since nothing is perfect, there is always room for improvement - even if the current accuracy is good enough for a specific practical purpose.
Models also have a huge number of different outputs - temperature, precipitation, winds, pressure - basically if it is measured as "weather" then you can analysis the model output in the same way that you can analyze weather. A model can be very accurate for some outputs, and less accurate for others. It can be very accurate for some regions, and less accurate for others. It can be very accurate for some periods of geological time, and less accurate for others. The things it is accurate for can be used to guide policy, while the things we have less confidence in we may want to hedge our bets on.
Saying "none of the climate catastrophes predicted in the last 50 years" is such a vague claim. If you want to be at all convincing in your claim, you are going to have to actually provide specific examples of what predictions you are talking about, and provide links to accurate analyses that show these predictions to be in error. Climate models have long track records of accurate predictions.
Here at SkS, you can use the search box (upper left" to search for "lessons from past climate predictions" and find quite a few posts here that look at a variety of specific predictions. (Spoiler alert: you'll find a few posts in there that show some pretty inaccurate predictions from some of the key "contrarians" you might be a fan of.)
As for Lomborg: very little he says is accurate. Or if it is accurate, it omits other important variables to such an extent that his conclusions are inaccurate. I have no idea where I would find the article of his that you mention, and no desire to spend time trying to find it. If that is your source of your "none of the climate catastrophes" claim, then I repeat: you need to provide specific examples and something better than a link to a Lomborg opinion piece.
There have been reviews, etc. posted here of previous efforts by Lomborg, such as:
https://skepticalscience.com/open-letter-to-wsj-scientist-response-to-misleading-lomborg.html
https://skepticalscience.com/lomborg-WSJ-debunk-CSRRT.html
https://skepticalscience.com/lomborg-detailed-citation-analysis.html
...and Lomborg has a page over at DesmogBlog.
In short, you're going to have to do a lot better if you expect to make a convincing argument.
- CO2 is not the only driver of climate
Tom Curtis at 08:46 AM on 28 May, 2016billev @43:
"I also am of the opinion that once the current EL Nino ends then the pause will reassert itself and continue until about 2032. I base that opinion upon the pattern of previous temperature change since 1880."
Crucially for Billev, it is an untested opinion. It is only be not testing his opinion against data that he is able to retain it.
In fact, several people have already made proposals of a similar nature to Billev's claim that the pattern of temperature will repeat themselves. Specifically, Don Easterbrook has argued for a near repetition of the pattern; Akasofu has argued more abstractly that the temperature pattern is a gradually rising trend modulated by a sine function and short term variations; and Loehle and Scafetta have argued for a repeating, rising temperature pattern accelerated since 1970 by global warming. As the linked articles show, none of these projections of temperature based on a cyclical pattern have been successful.
Billev's own theory is indistinct. He clearly rejects any forcing effect from CO2, and so cannot accept Loehle and Scafetta's projection. He thinks the "cooling pattern" that he expects to repeat from 2000 onwards was evidenced in the "early 1940s" which does not align with the repetition from 1945 used by Easterbrook. It is possible that he accepts a view similar to Akasofu's, but he is not explicit enough to be sure. Regardless, neither a repetition of the 5 year running mean from 1940 (to match the early 1940s projection) or the Akasofu cyclical function matches the post 2000 temperature function:

Billev's theory is a bust - something he does not know because he never quantified it and checked it against the data. That is, he used feels to develop his theory, not reasoning, and certainly not scientific method.
As Billev seems to have dropped discussion of the role of CO2 as a climate forcing, his remaining thesis is not on topic in this thread. I would highly recommend that if he wants to defend his busted theory, discussion be moved to the theory that he thinks most closely resembles his (from the three links above), or failing that, to the general discussion of different projections here.
- Models are unreliable
scaddenp at 11:06 AM on 25 February, 2016Rerunning the actual climate models is not a trivial process. Serious computer time for version 4 and 5 models. Hassles with code for pre-CMIP days. However, outputs can be scaled for actual forcings. "Lessons for past climate predictions" series do this. Eg for the FAR models, see http://www.skepticalscience.com/lessons-from-past-climate-predictions-ipcc-far.html
However, I am very doubtful about the possibility of changing the minds of the wilfully ignorant. It seems to outsider, that in USA in particular, climate denial is part of right-wing political identity.
- Models are unreliable
scaddenp at 12:25 PM on 24 February, 2016Good points. If you want to look at how past model "predictions" of the future have gone, then you could of course look at how, say, one of the earliest models, Manabe and Weatherall 1975, used by Wally Broecker, is doing now. See here. It would be nice to update this chart. There are other predictions (eg FAR) also in the "Lessons from past climate predictions" series that are worth looking at. Of course any serious evaluation has to compare actual forcings against what the prediction assumed if you want to assess skill at climate modelling rather than guessing emission rates. Broecker overestimated emissions but also looks to have underestimated sensitivity.
- 2015 SkS Weekly Digest #36
KR at 00:24 AM on 11 September, 2015Ignaz - I strongly suggest that you take discussions of Cook et al to one of the relevant threads, where your rather poor attempt to reframe the data has already been discussed and (correctly) dismissed. I will in passing note that the abstract survey ratings were in fact more than supported by querying the authors of the full papers. Bzzzt.
Your claim that projections have been lowered is, in fact, not correct, see the discussion of the 1990 FAR projections here, versus AR5 here (in particular, Fig. SPM 6), which projects 2C by 2100 for RCP6.0, just the median value seen in FAR. Your claim is therefore unsupportably wrong.
---
You've posted quite a bit of nonsense on SkS over the last few weeks, on multiple threads and in multiple directions, echoing many of the climate change denial blogs - none of which seems to hold up under examination. IMO your comments are just noise.
- It's El Niño
Tom Dayton at 03:04 AM on 1 June, 2015Don Sage, for more insight to the errors (and "errors"--ahem) in Don Easterbrook's claims, see Dana's other Easterbrook post, "It's PDO," "It's the Sun," and "Climate's Changed Before." Many Skeptical Science posts have Basic, Intermediate, and Advanced tabbed panes; read them all. Also, be sure to post comments only on the relevant threads. You can monitor all comments on all threads by clicking the "Comments" link in the horizontal blue bar at the top of every page.
- Republicans have one option to eliminate EPA carbon regulations
KR at 01:23 AM on 5 February, 2015Runrig - I've replied on the more appropriate thread. Long story short, the rescaling was entirely justified by updated forcing information, and Doug Bell is engaging in conspiracy ideation.
- Republicans have one option to eliminate EPA carbon regulations
Mighty Drunken at 23:59 PM on 4 February, 2015Hi Runrig,
It is best to keep comments on topic, here SkS has a relevant article, FAR Prediction. Assuming Doug has not messed up his baselines the answer is probably found in the linked article, the actual forcing being less than the BAU projection and we are tracking on one of the lower climate sentivity projections. His analysis seems a bit subjective, for instance he claimes, "At the 2035 mark the lowest prediction is around 1.7°C". My eyeballing puts it closer to 1.6C.
- IPCC overestimate temperature rise
KR at 07:37 AM on 14 November, 2014bcglrofindel - CO2 forcings are on the low side of the FAR projections, CFCs are also lower, and see my previous comment on the updated effective CO2 forcings.
Again - the only 'prediction' from the GCMs is the relationship between emissions and climate change, the only appropriate test against observations is to take those models and run them with actual forcings. Old economic projections are useful tools for exploring the envelope of the GHG/temperature relationship, and that relationship can be tested, can be disproven if wrong, even if the emission scenarios are nowhere near actual emissions.That relationship quite frankly passes testing.

Yes, folks can complain about almost anything. But that doesn't mean they have a leg to stand on.
- IPCC overestimate temperature rise
Tom Curtis at 03:31 AM on 14 November, 2014Given bcglrofindel's comments @38, I am tempted to let him totter of with his stick to the gun fight. However ...
While the two graphs shown by KR @34 are excellent for their purpose, that purpose is not the comparison of post 1990s trends. As the comparison of temperature changes post 1990 is the "purpose" of the pseudo-skeptical interest in the FAR projections, the graphs are not suitable for the underlying purpose. Used as such, a competent* pseudo-skeptic will point out that:
1) The graph shows a multi year average of the GISS temperature record, thereby eliminating (by regression to the mean) some of the lower temperature values in the twenty first century;
2) The graph has no clearly defined baselining procedure (and natural candidates are excluded by relative values); and (most importantly)
3) By taking the change in temperautre from 1880, the graph allows the accumulated relative difference over 110 years to distract from the very different rates of change between observations and IPCC FAR projections post 1990 (and particularly post 2000).
Please note that these are only problems when the graphs are used, contrary to their original purpose, to compare changes in temperature post 1990. Further, note that, with regard to point (2), although the baselining method is not specified, a perfectly valid baselining technique may have been used (and probably was given that Dana constructed the graph). However, if you do not know what it is, you cannot defend its reasonableness, or correct for it if you think it unreasonable.
Because the graphs are not suitable for comparison of post 1990 changes in temperature, the original article included a graph for just that purpose:
Note, however, that for that graph, the IPCC "projection" was adjusted to reflect actual (rather than projected) changes in GHG forcings.
So, once again we return to the same points. A proper comparison requires understanding the difference between projections and predictions, and not expecting the IPCC to "predict" the fall of the former Soviet Union (among other things).
(* The incompetent pseudo-skeptics tend to simply reject such graphs out of hand on the sole basis that they come from Skeptical Science.)
- IPCC overestimate temperature rise
KR at 02:30 AM on 14 November, 2014bcglrofindel - I had forgotten about that earlier FAR specific post; SkS really contains a lot of information. If you're interested in other predictions that have been examined here, the Lessons from Predictions button in the left margin is quite useful.
I'm afraid that much of the strength of the reaction to your questions was based on past experiences - I cannot count how many times someone has commented here and on other climate blogs claiming despite the evidence that mismatches between specific projections and observed temperatures somehow invalidate all climate modeling, despite the projected emissions not matching actuals. The pattern for those 'skeptics' is one of starting out with what sems like a reasonable question, then not accepting the explanations, degenerating into denial, libertarian fantasies, and conspiracy theories while asserting counterfactuals, before their politeness finally expires and moderation kicks in. But it's difficult to distinguish between such people and the genuinely curious early in the exchange.
Note to everyone - As bcglrofindel points out, such a strong reaction can be quite offputting. Save the sarcasm for people who have demonstrated the need for heavy implements in clue delivery.
- IPCC overestimate temperature rise
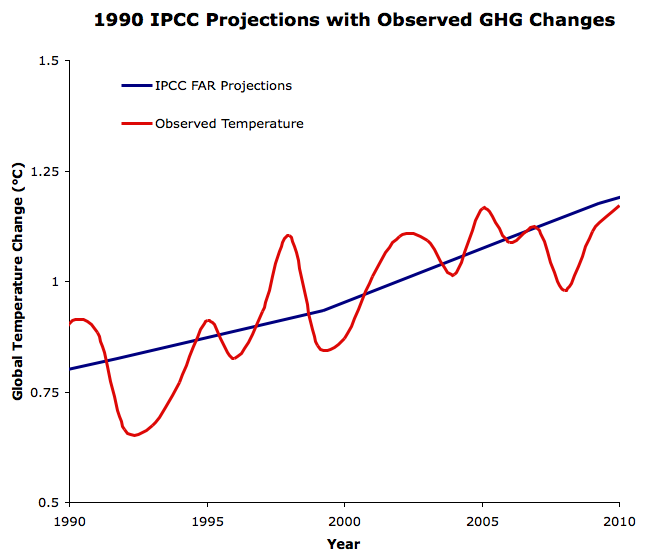
KR at 05:21 AM on 13 November, 2014bcglrofindel - If you recall, I gave you a graph of temperatures vs. projections earlier in the thread, including the 1990 FAR. More specifically in the collection of SkS threads examining past projections is a direct FAR comparison here:

Far more relevant are FAR models using actual greenhouse emissions to present (which didn't exactly match any of the scenarios), as the various scenarios were just that, scenarios, not looking-glass prophetic visions of future economies:
The FAR models were quite simple - but all in all did a reasonable job.
In short: The FAR projections were not exact matches to observed history, but the models they used appear to be in the right range for predicting trends vs. GHG emissions.
I believe that is a sufficient response for the naysayers.
- Models are unreliable
michael sweet at 12:04 PM on 3 June, 2014Razo,
Calibration of Global Climate Models is difficult. I understand that they are not calibrated to match the temperature trend (either for forcast or hindcast). The equations are adjusted so that measured values like cloud height and precipitation are close to climatological averages for times when they have measurements (hindcasts). The temperature trends are an emergent property, not a calibrated property. This also applies to ENSO. When the current equations are implemented ENSO emerges from the calculations, it is not a calibrated property.
Exact discussions of calibration seem excessive to me. In 1894, Arrhenius calculated from basic principles, using only a pencil, and estimated the Climate Sensitivity as 4.5C. This value was not calibrated or curve fitted at all— there was no data to fit to. The current range (from IPCC AR5) is 1.5-4.5C with a most likely value near 3 (IPCC does not state a most likely value). If the effect of aerosols is high the value could be 3.5-4, almost what Arrhenius calculated without knowing about aerosol effects. If it was really difficult to model climate, how could Arrhenius have been so accurate when the Stratosphere had not even been discovered yet? To support your claim that the models are not reliable you have to address Arrhenius' projection, made 120 years ago. If it is so hard to model climate, how did Arrhenius successfully do it? Examinations of other model predictions (click on the Lessons from Past Predictions box to get a long list) compared to what has actually occured show scientists have been generally accurate. You are arguing against success.
A brief examination of the sea level projections in the OP show that they are too low. The IPCC has had to raise it's projection for sea level rise the last two reports and will have to significantly increase it again in the near future. Arctic sea ice collapsed decades before projections and other effects (drought, heat waves) are worse than projected only a decade ago. Scientists did not even notice ocean acidification until the last 10 or 20 years. If your complaint is that the projections are too conservative you may be able to support that.
- Climate Models Show Remarkable Agreement with Recent Surface Warming
Tom Dayton at 02:46 AM on 31 March, 2014Matzdj, climate models are not intended for predicting the forcings (greenhouse gas emissions volcanic emissions, solar energy hitting the Earth, etc.), nor does anyone use them for that. Instead, climate models are intended for, and used for, "predicting" the climate response to one particular "scenario" of forcings. I put "predicting" in quotes, because the model run is not a genuine claim that that climate will come to pass, because there is no claim that that scenario of forcings will come to pass. Instead, the term "projecting" often is used instead of "predicting," to indicate that that climate is predicted to come to pass only if that particular scenario of forcings comes to pass. Those scenarios of forcings are the model "inputs" that other commenters have mentioned in their replies to you.
For each scenario of forcings that someone thinks might come to pass, that person can use those forcings as inputs to climate models to predict the resulting climate. To cover a range of possible scenarios, people run the climate models for each scenario to see the resulting range of possible climates. You can see that, for example, in Figure 4 in the post about Hansen's projections from 1981. You can also see it in the post about Hansen's projections from 1988. To learn about the forcings scenarios being used in the most recent IPCC reports, see the three-post series on the AR5 Representative Concentration Pathways.
To judge how well the climate models predict climate, we must input to those models the actual forcings for a given time period, so that we can then compare the models' predictions to the climate that actually happened in the real world where those particular forcings actually came to pass. That is the topic of the original post at the top of this whole comment stream.
To judge whether climate models will predict the climate in the future whose forcings we do not yet know, we must guess at what the forcing will be. We do that for a range of forcing scenarios. The bottom line is that every single remotely probable scenario of forcings yields predictions of dangerous warming.
- Why trust climate models? It’s a matter of simple science
scaddenp at 10:50 AM on 26 October, 2013"The question was if there is a scientific principle of allowable variance from observations, before the underlying assumptions are questioned. How long can the pause be expected to continue?'
If you read up some of the threads on so-called "pause", you will understand this better (in fact read the IPCC AR5 analysis), but as I understand it, the question is more philosphical. Firstly, the models can get some things totally wrong without invalidated climate theory. Things that would invalidate climate theory would be an end to the energy imbalance; LW spectral reading in violation of theory, total ocean heat content declining etc.
The question on models though is whether they have useful skill (do better than null hypothesis that tomorrow will like today or similar). The climate modellers would be the first to tell you that climate model has no skill at decadal level projection. They do not predict internal variability well. On the other hand, if add in internal variability (eg the Foster and Rahmsdorf paper or similar efforts), then do you expect them to "hindcast" pretty well. Thus if you get an El Nino year where there temperatures are lower than previous El Nino years of similar magnitude, (or for that matter La nina years compared to earlier La Nina years) without volcanoes or similar forcings then you would say something missing from the model.
Climate models to be useful have to predict climate so 30 year trends significantly smaller than predicted would also indicate an issue - with the models but not necessarily with climate science. I would note that Manabe's primitive 1975 model allowed Broecker to predict 2010 temperatures remarkably well.
The "models are unreliable" thread has much much more.
- Making Sense of Sensitivity … and Keeping It in Perspective
scaddenp at 12:54 PM on 6 April, 2013Engineer - that was done more or less by Broecker for his remarkably accurately 1975 prediction but that is not how any modern climate model work. Instead, climate is emergent from the interaction of forcings with the various equations in the model. If you want to know what the climate sensitivity of model is, then you work backwards from the temperature at end point as calculated by model compared to CO2 forcing. Can do run the model with various forcing to see what sensitivity to say a solar forcing of same magnitude is. (see for instance ModelE results). Over a very big temperature range, there would be good reason to suppose sensitivity would change. Eg when all ice is melted from both poles, then the only only albedo feedback would be weak ones from land cover change. Preserve us from having to worry about that for the next 100 years.
- The Scientific Method
KR at 01:44 AM on 2 April, 2013Climate Newbie - "...if it disagrees with experiment it is wrong"
Indeed. With that in mind, it's interesting to see how 'skeptic' predictions fare against the IPCC (skeptic predictions fare poorly). Raymond Pierrehumbert discusses some successful predictions here, and there's an interesting overview of successful climate model predictions - dating back to Arrhenius. Not to mention that has theory has repeatedly proved out over initial (incorrect) measures such as the UAH temperatures.
'Skeptic' predictions, whether of temperature, Arctic ice, or pretty much anything else? They don't fare very well against the data; they are (so far, at least) wrong.
- What Role Did the Arctic Storm Play in the Record Sea Ice Minimum?
Kevin C at 20:56 PM on 18 October, 2012
If you are genuinely interested in the answer, head over to Neven's and go through the threads from early August to see what the predictions were - people posted a variety of predictions using a variety of methods. Or check the SEARCH outlooks, which include predictions from experts and amateurs (you may want to weight them by their past reliability, see Dana's review here). Or take the data and make your own hindcast starting from before the storm.
It seems to me that volume would certainly have set a new record, and it is more likely than not that NSIDC, CT and Bremen would also have set records even ignoring anything we know about declining thickness and ice age. - Models are unreliable
scaddenp at 10:45 AM on 4 September, 2012
opd68. Your process of calibrate, predict,validate does not capture climate modelling at all well. This is a better description of statistical modelling, not physical modelling. Broadly speaking, if your model doesnt predict the observations, you dont fiddle with calibration parameters; you add more physics instead. That said, there are parameterizations used in the climate models to cope with sub-scale phenomena (eg evaporation versus windspeed). However the empirical relationship used is based on fitting measured evaporation rate to measured wind speed, not fiddling with a parameter to match a temperature trend. In this sense they are not calibrated to any temperature series at all. You can find more about that in the modelling FAQ at Realclimate (and ask questions there of the modellers).
Sks did a series of articles past predictions. Look for the Lessons from past predictions series. - Vision Prize Results
dana1981 at 04:48 AM on 21 July, 2012
Note by the way that Anthony Watts has enlisted his minions to ruin the second round of the Vision Prize. Ironically, the second round is about the Arctic sea ice decline, which is a subject on which WUWT reader predictions have an absolutely abysmal record. - An American Heatwave: The United States Glimpses its Hot Future
sauerj at 10:56 AM on 18 July, 2012
Hansen's Jan-2012 forecasts sure paned out, definitely for the US (sks article here)! Compare this to flawed contarian predictions (Easterbrook, McLean, Others)! One more for the scorebooks!
Question: This article implies El Nino will shift jet stream south and relief drought. I thought El Nino also brought on higher temps (which may only anchor the hot, high pressures even more, strengthening the drought). If the current budding El Nino intensifies (link), which seems likely, I would think this will only make next year's summer (2013) even worse (ugh!). I'm probably over simplifying El Nino impacts and year-ahead forecasts. Comments for what's in store for 2013 summer??? - Models are unreliable
scaddenp at 12:23 PM on 1 June, 2012
(snip)
As to JoNova/David Evans misinformation - well look around Skepsci for take downs, (eg hot spot and Evans (snip)
Hansen's 1984 model - yes it had sensivity wrong for well understood reasons. see Lessons from past predictions 1981 (and rest of that series for interest). And yes, climate sensitivity is still uncertain, but very unlikely to be less than 2 (or more than 4) - but claiming a past prediction is falsified by data on sensitivity doesnt fly when sensitivity wasnt a robust prediction.
(snip) - Models are unreliable
Tom Curtis at 10:38 AM on 1 June, 2012
Clyde @552 links to an atrocious analysis by David Evans, who by all accounts (particularly his own) is an expert in computer modeling. Evans criticizes two models which are supposedly representative of IPCC model predictions, the 1988 prediction by Hansen, and the projections by the IPCC First Assessment Report (FAR). He says of them:
"The climate models have been essentially the same for 30 years now, maintaining roughly the same sensitivity to extra CO2 even while they got more detailed with more computer power."
Oddly, in the IPCC Third Assessment Report (TAR) we read:
"IPCC (1990) and the SAR used a radiative forcing of 4.37 Wm-2 for a doubling of CO2 calculated with a simplified expression. Since then several studies, including some using GCMs (Mitchell and Johns, 1997; Ramaswamy and Chen, 1997b; Hansen et al., 1998), have calculated a lower radiative forcing due to CO2 (Pinnock et al., 1995; Roehl et al., 1995; Myhre and Stordal, 1997; Myhre et al., 1998b; Jain et al., 2000). The newer estimates of radiative forcing due to a doubling of CO2 are between 3.5 and 4.1 Wm-2 with the relevant species and various overlaps between greenhouse gases included. The lower forcing in the cited newer studies is due to an accounting of the stratospheric temperature adjustment which was not properly taken into account in the simplified expression used in IPCC (1990) and the SAR (Myhre et al., 1998b). In Myhre et al. (1998b) and Jain et al. (2000), the short-wave forcing due to CO2 is also included, an effect not taken into account in the SAR. The short-wave effect results in a negative forcing contribution for the surface-troposphere system owing to the extra absorption due to CO2 in the stratosphere; however, this effect is relatively small compared to the total radiative forcing (< 5%).
The new best estimate based on the published results for the radiative forcing due to a doubling of CO2 is 3.7 Wm-2, which is a reduction of 15% compared to the SAR. The forcing since pre-industrial times in the SAR was estimated to be 1.56 Wm-2; this is now altered to 1.46 Wm-2 in accordance with the discussion above. The overall decrease of about 6% (from 1.56 to 1.46) accounts for the above effect and also accounts for the increase in CO2 concentration since the time period considered in the SAR (the latter effect, by itself, yields an increase in the forcing of about 10%)."
(My emphasis)
A 15% reduction in estimated climate sensitivity is not "roughly the same sensitivity". What is more, early climate models included very few forcings. Evan's comment on that in his video saying (falsely) that they only include CO2, and do not include natural forcings. However models used in the Third and Fourth Assessment reports most certainly used natural forcings, as well as a wide range of anthropogenic forcings. Therefore the claim that "[t]he climate models have been essentially the same for 30 years now" is simply false.
More troubling is the graphic Evan's uses:

First we have the label indicating the projections dependent on CO2 emissions as if CO2 was the only forcing modeled by Hansen. Indeed, in the video, Evans explicitly states just that, ie, that CO2 was the only modeled forcing. In fact Hansen included five different anthropogenic gases in each model run, so checking just CO2 emissions does not check how well reality conformed with any particular scenario.
Far worse, he labels scenario A as "CO2 emissions as actually occurred". What actually occurred, and entirely unpredicted by Hansen, was that the Soviet Union collapsed resulting in a massive reduction of very polluting Soviet Block industry, with a consequent massive reduction of CO2 emissions from the Soviet Block:

As a result, current CO2 levels (ignoring seasonal variation) are only 390.5 ppmv, which compares to the 391 ppmv projected by Hansen for 2011 in scenario B. In other words, Evans is claiming that CO2 emissions followed scenario A whereas in reality they have not yet caught up to scenario B.
Here are the current concentrations of the other GHG used in Hansen's model:
Gas | Actual__ | Hansen (Scenario)
___CH4 | 1810 ppb | 1920 (Scenario C)
___NO2 | _323 ppb | _330 (Scenario B)
_CFC11 | _240 ppt | _275 (Scenario C)
_CFC12 | _533 ppt | _961 (Scenario B)
So, for every gas modeled, the actual 2011 concentration is greater than the projected scenario B concentration, often much greater. In two cases, even the scenario C projected concentration is greater than the actual concentration; yet Evans says that Scenario A emissions is what happened.
Given the size of the discrepancies, there are only two possibilities. Either Evans did not bother looking up the data before making his assertion - an assertion he has made repeatedly while strongly emphasizing his expertise. Or he is flat out lying.
Seeing Clyde introduced Evans' rubbish to this discussion, he now needs to answer several questions:
Do experts make assertions about data which they have not bothered looking up?
Do they lie?
And why, given that they are supposedly so skeptical, have no fake "skeptics" picked up on these errors and criticized Evans for them?
Finally, for a proper analysis of those predictions, I recommend the posts by Dana on Hansen's 1988 predictions, and on the predictions of the First Assessment Report. I don't think Dana claims to be an expert on climate modeling, but at least he treats the data with integrity. - Wall Street Journal 'Skeptics' Misrepresent the IPCC
Tom Curtis at 19:38 PM on 3 March, 2012
Anteros @36, the original SkS post on the FAR contains the word "predictions" twice - once in the title and again when referring to "Broecker's 1975 prediction".
Your original claim was,
"Now, my point was that you never mentioned [any] of this in your article. You never mentioned the word "prediction" once."
Clearly that claim is false. Grow a set and admit error. - Wall Street Journal 'Skeptics' Misrepresent the IPCC
mdenison at 04:17 AM on 3 March, 2012
It may help those following Anteros' link from real climate to "Lessons from Past Climate Predictions: IPCC FAR" if the older post had an update linking it to this post. - Monckton Misrepresents Scientists' Own Work (Part 1)
dana1981 at 12:14 PM on 22 February, 2012
Lessons from Past Predictions: Wallace Broecker may help elsa's understanding on this issue. - 2011 Sea Ice Minimum
Dikran Marsupial at 23:44 PM on 30 September, 2011
I thought today would be a good day to make a statistical prediction of September 2011 sea ice extent ;o)
I obtained from data for Arctic sea ice extent from 1979-2009 (the NSIDC data archive appears to be down at the moment, that was the best I could find). I then fitted a Gaussian process model, using the excellent MATLAB Gaussian Processes for Machine Learning toolbox (the book is jolly good as well). I experimented with some basic covariance functions, and chose the squared exponential, as that gave the lowest negative log marginal likelihood (NLML). The hyper-parameters were tuned by minimising the NLML in the usual way.
Here is a pretty picture:

Note the credible interval gets wider the further you extrapolate from the data, which is a nice feature of Bayesian models. Other highlights include:
prediction for 2010 = 4.927226 (+/- 1.069078)
prediction for 2011 = 4.772309 (+/- 1.096537)
prediction for 2012 = 4.614637 (+/- 1.128915)
ice free summer unlikely prior to 2027
ice free summer probably after 2041
I haven't checked to see how accurate the first two "predictions" actually are. This isn't really a serious attempt at a prediction, I just wanted to try out the regression tools in the GPML toolbox, but when I can get some up-to-date data, I can update the projections for 2012 and onwards. Hopefully I won't end up being the subject of a lessons from predictions post. ;o)
Caveat lector: This is a purely statistical prediction, so it is less reliable than physics, but hopefully better than chimps & buckets. - Lessons from Past Climate Predictions: IPCC AR4 (update)
Tom Curtis at 08:45 AM on 25 September, 2011
There has been some discussion of an apparent contradiction in Dana's summary. I say "apparent" because there is no actual contradiction in Dana's conclusion. Accuracy is not bivalent like truth. Something is either true, or it is not - but things can be more or less accurate.
Indeed, Dana clearly states that the AR4 results meet one (vague) standard of accuracy, they are "reasonab[ly] accura[te]", but it is impossible to tell as yet whether they meet another, more stringent standard of accuracy. Because different levels of accuracy are being considered, there is no contradiction.
To illustrate the point, we can compare the AR4 projections to predictions analyzed earlier in this series, in this case the one by Don Easterbrook in 2008:

The image was formed by overlaying Zeke's version of Dana's fig 3 graph above with figure 3 from Dana's discussion of Easterbrook's prediction (link above). The heavy Red line is a running mean of Gistemp, the heavy blue and green lines two of Easterbrook's three projections (the third declining even faster.
Even the best of Easterbrook's projections (heavy green line) performs poorly. From the start it rapidly declines away from the observed temperature series. Briefly in 2008 (the year of the prediction) it is closer to the observations than is the A2 multimodel mean, but then falls away further as temperatures rise so that in the end it is further away from the observations than the A2 projections ever are. Given that 2008 was a strong La Nina year and in the middle of a very deep solar minimum, we would expect it to be below, not above and projected trend. But regardless of that subtlety, Easterbrook's projection performs far worse than the AR4 A2 projection. It is not reasonably accurate, although it may not yet be falsified.
However, despite the fact that the conclusion contains no contradiction, I would suggest rewording it, or appending a clarifying update to the bottom of the post. As it stands it is an invitation to misunderstanding by those (apparently including Lucia) who think "accuracy" is an all or nothing property. It is also an invitation to the creative misunderstanding some deniers attempt to foster. - Lessons from Past Climate Predictions: IPCC AR4 (update)
Charlie A at 06:01 AM on 24 September, 2011
Perhaps Dana used the same baseline adjustment technique he used for the FAR model comparison: "All I did was offset the SAR projection in 1990 to match the GISTEMP 5-year running average value in 1990 (approximately 0.25°C)."
Lessons from Past Climate Predictions: IPCC SAR
In other words, he matched the start of projections with the 5 year running average in the start year. In that comparison, he also adjusted the slope or scale factor of the projections. Not surprisingly, with after-the-fact adjustments of both slope and offset, the projections were a good match for observations. - Lessons from Past Climate Predictions: IPCC AR4
dana1981 at 13:09 PM on 23 September, 2011
lucia, if you read the next line in Charlie's comment, he's referring to the text in the AR4 stating that the trend from 2000 to 2020 is 0.2°C per decade.
I will say that if I'm misinterpreting Charlie's comments, and if he was saying the trend from 2000 to 2010 in Figure 2 looked closer to 0.2°C per decade, then he was approximately right (and if that's the case, he's got some impressive eyesight). That's just not how I read his comments, but I could be wrong.
As I note in the updated post, our digitization of the graph was unfortunately not very accurate, due to the small scale of Figure 2. That's my mistake - I should have thought to look for a data file, since the AR4 was published so recently, rather than relying on the digitization. Mea culpa on that one, and again, thanks to you and Zeke for pointing me to the data. - Lessons from Past Climate Predictions: IPCC SAR
dana1981 at 08:13 AM on 2 September, 2011
Chris G -"To be fair, you should compare the accuracy of models predicting warming as CO2 increases with models that don't."
Actually we've done that. Click the button at the top of the post to see all our entries thus far in the 'Lessons from Past Climate Predictions' series. Easterbrook's cooling prediction is probably the most relevant. We also compared his prediction to Wallace Broecker's 1975 warming prediction in the Broecker post in the series.
The purpose of this series is to fairly examine each warming or cooling prediction we can find and see where each went wrong and what we can learn from them. I'm also writing a book/booklet on the same subject. - Models are unreliable
scaddenp at 14:46 PM on 20 August, 2011
For Anthony Mills - you might like to consider that you can make useful prediction with even very simple models. eg Broecker's model
However, it is also fair to say that climate models have no skill at short period prediction, not even decadal, for reasons that include your concerns. - Lessons from Past Climate Predictions: William Kellogg
dana1981 at 01:45 AM on 23 July, 2011
The site is Skeptical Science - we're real skeptics. Although it had a strong physical basis, Kellogg's prediction had some problems which are useful to learn from. Those who don't learn from past mistakes are doomed to repeat them. Easterbook comes to mind.
James Wight is going to try and work on a post detailing the various measures of climate sensitivity this weekend. - 2010 - 2011: Earth's most extreme weather since 1816?
Albatross at 05:08 AM on 8 July, 2011
Re "This is precisely as pointed out previously when the maximum gradient between warm and cold air occurs."
No, not always. You and others, once again, insist on making sweeping and gross generalizations when severe thunderstorms are very much about the details.
And Re #299,
This is such a site, pity you fail to recognize that. But as you volunteered on another thread, you are not particularly interested in the importance of physics. So I find your hyperbole and innuendo uncalled for, it only goes to show the weakness of your alleged 'arguments'. - Lessons from Past Climate Predictions: Syun-Ichi Akasofu
Bern at 11:00 AM on 7 July, 2011
Icarus: Very good point.
I liken this sort of 'LIA Recovery = linear upward trend' argument, to a man standing on the beach at mid-tide, screaming in panic because the water is rising and soon the entire world will be flooded...
Although I'm sure there will be plenty of deniers who would twist that around the other way when talking about climate science, the obvious point is that a model based on curve-fitting a short period of data can give you very bad results, while a model based on an understanding of the physical mechanisms that drive the tide will tell you to walk five paces up the beach and relax.
The difference now, of course, is that the curve-fitters are the ones telling us to relax, while the folks looking at the physical mechanisms driving climate have got seriously worried looks on their faces... - Websites for Watching the Arctic Sea Ice Melt
skywatcher at 06:14 AM on 1 July, 2011
Eric, you love to set goals far into the future, don't you? Just like in the comments for this thread, you want us to sit back and wait over two decades before you'll decide the evidence is sufficient.
You're picking numbers out of thin air and calling them 'hard'. That's not too scientific. I agree with Dikran - the second para is particularly woeful - every climate projection includes contributions from all major forcings, not just CO2. The continuing CO2 trend is clearly visible in every temperature dataset when the other forcings are removed, and is right in line with what the physics tells us. It's not about to start, it's already here and continuing. Pretending that there is some kind of middle ground is just another form of denial, and not in agreement with physics. - Lessons from Past Climate Predictions: Don Easterbrook
Bern at 17:30 PM on 30 June, 2011
stefaan: Yes, you can add more and more cycles, sub-cycles, and epi-cycles until your simulation provides quite an accurate reproduction of past behaviour. Such models almost invariably fail the prediction test - which I believe was one of the key reasons for the downfall of the geocentric model of the solar system - as time went by, more and more sub-cycles were needed to account for the variance between model and reality, until the whole house of cards collapsed, to be replaced by the heliocentric model which was described by a few (relatively) simple equations, and which allows fairly accurate prediction centuries into the future.
I think the term 'house of cards' is accurate in that example, as it was all based on, and completely relied on, one fundamental assumption, that the Earth was the centre of the universe. Observation showed that fundamental assumption was incorrect, and additional complexities were added in to the model (with no basis in physical science whatsoever) in order to account for that error.
In the climate science field, however, there are multiple foundations (e.g. CO2 absorption spectra, black body radiation, conservation of energy) which are so thoroughly tested by experiment and observation that it would be very improbable for any of them to be overturned at this point in time.
Tamino has a good post covering another 'skeptic' prediction that turned out to be not-so-good - this time from the 2009 NIPCC report regarding arctic sea ice. The last graph is a cracker - especially when you consider most of that data was available at the time the NIPCC report was written! - Climate's changed before
scaddenp at 10:21 AM on 9 June, 2010
"I reiterate that no such proof appears in any IPCC publications."
This is dealt with exhaustively in chapter 9 of WG1. What you are looking for is called "attribution". Read the chapter then take up the argument piece at a time. (in the appropriate thread - this is about past climate change). See also an excellent article at On Attribution.
"You are too proud to watch the video I suggested". I watched - more case of teach your grandmother to suck eggs. I frankly resent the implication that this contains lessons that scientists didnt know.
"you don't actually understand my question." Of this I agree. In part because it keeps changing. You asked for empirical evidence but it seems there is trouble understanding why this is empirical evidence. Trouble understanding the nature of scientific proof, trouble understanding past climate change. We are trying to help. The reason climate science has confidence that anthropogenic gases is causing change is based on multiple supporting lines of evidence. See ch 9.
Look, consider instead an alternative hypothesis. eg. the sun causes most of the warming. Run the model and make some predictions. These would include:
There should be more energy from sun reaching TOA.
Tropics (closer to sun) should be hotter
Warming should be more pronounced in daytime rather than night.
Stratospheric should be warming
etc.
Check this against reality - whoops. Next hypothesis. See how it works? Increasing GHGs is the one that matches our reality.
As to your link. How about some skepticism of this to match that of your skepticism of scientists? As far as I can see, its motley collection of long-debunked denialist talking points without a look at the real evidence at all.


THE ESCALATOR

(free to republish)