


 Arguments
Software
Resources
Comments
The Consensus Project
Translations
About
Support
Arguments
Software
Resources
Comments
The Consensus Project
Translations
About
Support
![]()
![]()
![]()
![]()
![]()
![]()
![]()
![]()
![]()
![]()


![]()


Latest Posts
- Why India is key to heading off climate catastrophe
- 2024 SkS Weekly Climate Change & Global Warming News Roundup #18
- Skeptical Science New Research for Week #18 2024
- At a glance - Clearing up misconceptions regarding 'hide the decline'
- Pinning down climate change's role in extreme weather
- 2024 SkS Weekly Climate Change & Global Warming News Roundup #17
- Fact Brief - Is Antarctica gaining land ice?
- Simon Clark: The climate lies you'll hear this year
- Skeptical Science New Research for Week #17 2024
- Water is at the heart of farmers’ struggle to survive in Benin
- At a glance - The difference between weather and climate
- India makes a big bet on electric buses
- 2024 SkS Weekly Climate Change & Global Warming News Roundup #16
- EGU2024 - An intense week of joining sessions virtually
- Skeptical Science New Research for Week #16 2024
- How extreme was the Earth's temperature in 2023
- At a glance - Is the science settled?
- What is Mexico doing about climate change?
- 2024 SkS Weekly Climate Change & Global Warming News Roundup #15
- Fact Brief - Did global warming stop in 1998?
- Skeptical Science New Research for Week #15 2024
- EGU2024 - Picking and chosing sessions to attend virtually
- At a glance - The Pacific Decadal Oscillation (PDO) is not causing global warming
- Climate Adam: Is Global Warming Speeding Up?
- 2024 SkS Weekly Climate Change & Global Warming News Roundup #14
- Gigafact and Skeptical Science collaborate to create fact briefs
- Skeptical Science New Research for Week #14 2024
- How can I make my retirement plan climate-friendly?
- At a glance - Global warming and the El Niño Southern Oscillation
- A data scientist’s case for ‘cautious optimism’ about climate change
Comment Search Results
Search for temperature adjustment
Comments matching the search temperature adjustment:
- Climate Adam: Is Global Warming Speeding Up?
MA Rodger at 17:19 PM on 12 April, 2024ubrew12,
Tamino subsequently posted an OP titled 'Accelerations' which features this NOAA adjusted data (the last two graphics) showing a pair of break-points in the rate of warming, 1976 & 2013, with the pre-2013 rate being quoted as +0.165ºC/decade and the post-2013 rate measuring a rather dramatic +0.4ºC/decade. But that said, there will be very big 'error bars' on that last value. Additionally Tamino's adjustments did result in 2023 temperature being increased (by +0.02ºC) which, given the cause of the "absolutely gobsmackingly bananas" 2023 temperatures remain unresolved, may be very wrong.
- Is Nuclear Energy the Answer?
scaddenp at 14:26 PM on 15 August, 2023I know next to nothing about nuclear reactors but I know coal-fired power stations well. When less power is needed then less coal is fed into furnace (making a mile of other adjustments especially to air flow and feedwater as well), so steam output is reduced. I would assume nuclear similarly slows output by slowing the nuclear reaction. To me, a partial shutdown is stopped one or more generation units not reducing steam output.
All steam plants have to reject heat back into the environment to convert steam back to water, usually by cooling towers. High summer temperatures play havoc with this especially if there are restrictions on temperature of cooling water going back into rivers. This usually means easier (and more efficient) to generate at night. If close to limit, then you have to reduce power as the day warms up.
- How big is the “carbon fertilization effect”?
daveburton at 15:36 PM on 13 July, 2023Rob wrote elsewhere, "greening is now turning into 'browning.' ... fertilization [has now been] overwhelmed by other effects... In other words, the greening has now stopped," and here, "You were making the claim that natural sinks were removing more of our emissions, and that is not the case by any stretch of the imagination.""
Here's AR6 WG1 Table 5.1, which shows how natural CO2 removals are accelerating:
https://www.ipcc.ch/report/ar6/wg1/downloads/report/IPCC_AR6_WGI_Chapter_05.pdf#page=48
Here it is with the relevant bits highlighted:
https://sealevel.info/AR6_WG1_Table_5.1.png
Or, more concisely:
https://sealevel.info/AR6_WG1_Table_5.1_annot1_partial_carbon_flux_comparison_760x398.png
: 2.0 ⇒ 2.6 ⇒ 2.9 ⇒ 3.4 PgC/yr")
(Note: 1 PgC = 0.46962 ppmv = 3.66419 Gt CO2.)
As you can see, as atmospheric CO2 levels have risen, the natural CO2 removal rate has sharply accelerated. (That's a strong negative/stabilizing climate feedback.)
AR6 FAQ 5.1 also shows how both terrestrial and marine carbon sinks have accelerated, here:
https://www.ipcc.ch/report/ar6/wg1/downloads/report/IPCC_AR6_WGI_Chapter05.pdf#page=99
Here's the key graph; I added the orange box, to highlight the (small) portion of the graph which supports your contention that, "greening is now turning into 'browning.' ... fertilization [has now been] overwhelmed by other effects... In other words, the greening has now stopped."
https://sealevel.info/AR6_FAQ_5p1_Fig_1b_final2.png
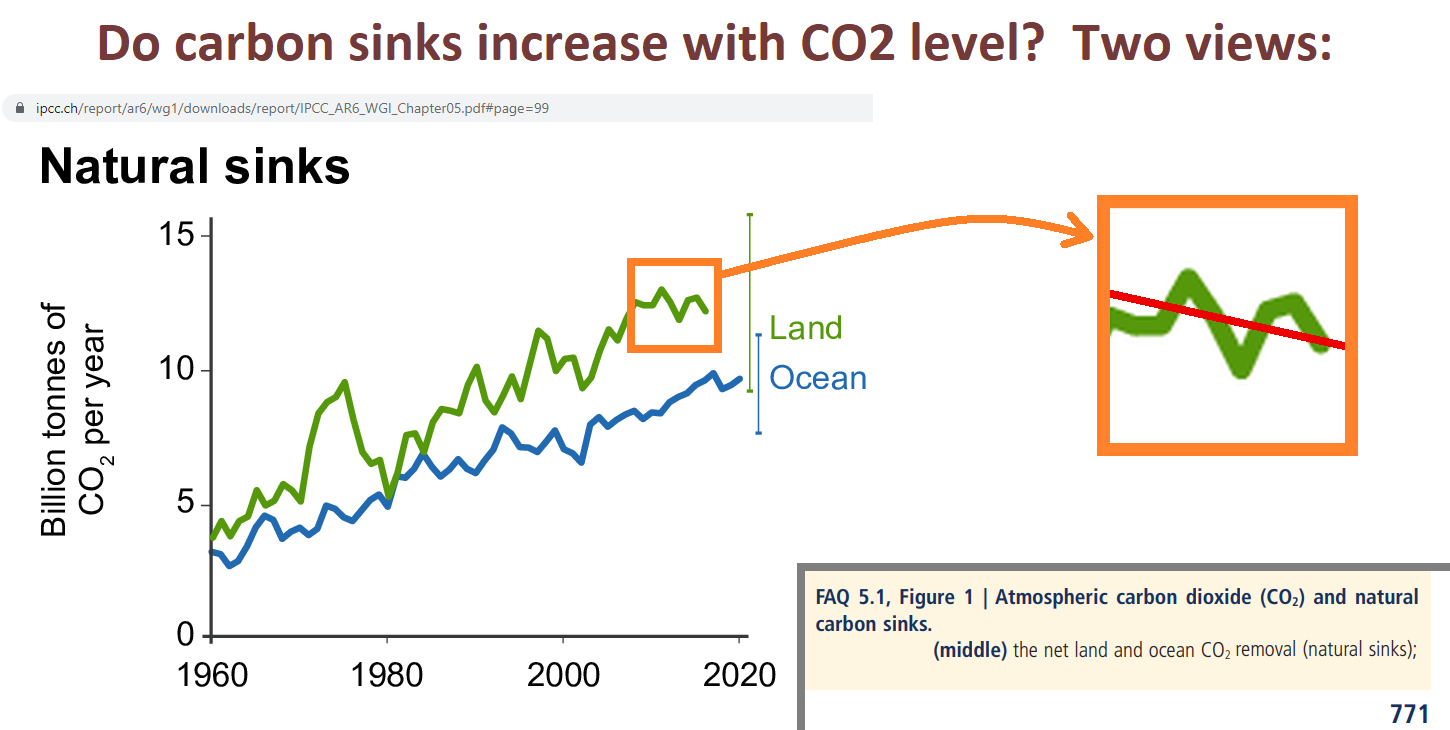
Here's the caption, explicitly saying that natural removal of carbon from the atmosphere is NOT weakening:

The authors did PREDICT a "decline" in the FUTURE, "if" emissions "continue to increase." But it hasn't happened yet.
What's more, the "decline" which they predicted was NOT for the rate of natural CO2 removals by greening and marine sinks, anyhow. Rather, if you read it carefully, you'll see that that hypothetical decline was predicted for the ratio of natural removals to emissions.
What's more, their prediction is conditional, depending on what happens with future emissions ("if CO2 emissions continue to increase").
Well, predictions are cheap. My prediction is that natural removals of CO2 from the atmosphere will continue to accelerate, for as long as CO2 levels rise.
The "fraction" which they predict might decline, someday, doesn't represent anything physical, anyhow. (It is one minus the equally unphysical "airborne fraction.") Our emission rate is currently about twice the natural removal rate, so if emissions were halved, the removal "fraction" would be 100%, and the atmospheric CO2 level would plateau. If emissions were cut by more than half then the removal "fraction" would be more than 100%, and the CO2 level would be falling.
I wrote elsewhere, "This recent study quantifies the effect for several major crops. Their results are toward the high end, but their qualitative conclusion is consistent with many, many other studies. They reported, "We consistently find a large CO2 fertilization effect: a 1 ppm increase in CO2 equates to a 0.4%, 0.6%, 1% yield increase for corn, soybeans, and wheat, respectively.""
If you recall that mankind has raised the average atmospheric CO2 level by 140 ppmv, you'll recognize that those crop yield improvements are enormous!
Rob replied, "If you actually read more than just the abstract of that study you find this on page 3: 'Complicating matters further, a decline in the global carbon fertilization effect over time has been documented, likely attributable to changes in nutrient and water availability (Wang et al. 2020).'"
Rob, I already addressed Wang et al (2020), but you might not have seen it, because the mods deemed it off-topic and deleted it. Here's what I wrote:
Rob, it's possible that your confusion on the greening/browning point was due to a widely publicized paper, with an unfortunately misleading title:
Wang et al (2020), "Recent global decline of CO2 fertilization effects on vegetation photosynthesis." Science, 11 Dec 2020, Vol 370, Issue 6522, pp. 1295-1300, doi:10.1126/science.abb7772
Many people were misled by it. You can be forgiven for thinking, based on that title, that greening due to CO2 fertilization had peaked, and is now declining.
But that's not what it meant. What it actually meant was that the rate at which plants remove CO2 from the atmosphere has continued to accelerate, but that its recent acceleration was less than expected. (You can't glean that fact from the abstract; would you like me to email you a copy of the paper?)
What's more, if you read the "Comment on" papers responding to Wang, you'll learn that even that conclusion was dubious:
Sang et al (2021), "Comment on 'Recent global decline of CO2 fertilization effects on vegetation photosynthesis'." Science 373, eabg4420. doi:10.1126/science.abg4420
Frankenberg et al (2021), "Comment on 'Recent global decline of CO2 fertilization effects on vegetation photosynthesis'." Science 373, eabg2947. doi:10.1126/science.abg2947
Agronomists have studied every important crop, and they all benefit from elevated CO2, and experiments show that the benefits continue to increase as CO2 levels rise to far above what we could ever hope to reach outdoors. Perhaps surprisingly, even the most important C4 crops, corn (maize) and sugarcane, benefit dramatically from additional CO2. C3 plants (including most crops, and all carbon-sequestering trees) benefit even more.
Rob also quoted the study saying, "While CO2 enrichment experiments have generated important insights into the physiological channels of the fertilization effect and its environmental interactions, they are limited in the extent to which they reflect real-world growing conditions in commercial farms across a large geographic scale."
That's a reference to the well-known fact that Free Air Carbon Enrichment (FACE) studies are less accurate than greenhouse and OTC (open top container) studies, because in FACE studies wind fluctuations unavoidably cause unnaturally rapid variations in CO2 levels. So FACE studies consistently underestimate the benefits of elevated CO2. Here's a paper about that:
Bunce, J.A. (2012). Responses of cotton and wheat photosynthesis and growth to cyclic variation in carbon dioxide concentration. Photosynthetica 50, 395–400. doi:10.1007/s11099-012-0041-7
The issue is also explained by Prof. George Hendrey, here:
"Plant responses to CO2 enrichment: Much of what is known about global ecosystem responses to future increases in atmospheric CO2 has been gained through Free-Air CO2 Enrichment (FACE) experiments of my design. All FACE experiments exhibit rapid variations in CO2 concentrations on the order of seconds to minutes. I have shown that long-term photosynthesis can be reduced as a consequence of this variability. Because of this, all FACE experiments tend to underestimate ecosystem net primary production (NPP) associated with a presumed increased concentration of CO2."
Rob wrote, "It does seem that you're claiming CO2 uptake falls with increasing temperature.""
That is correct for uptake by water. Or, rather, it would be correct, were it not for the fact that the small reduction in CO2 uptake due to the temperature dependence of Henry's Law is dwarfed by the large increase in CO2 uptake due to the increase in pCO2.
Rob wrote, "But it's unclear to me how you think this plays into the conclusion that CO2 levels would 'quickly normalize' over the course of 35 years" and also, "You also claimed CO2 concentrations would quickly come down (normalize) once we stop emitting it. This is also not correct unless you're using 'normalize' to mean 'stabilize at a new higher level'."
Perhaps you've confused me with someone else. I said nothing about CO2 levels "normalizing."
I did point out that the effective half-life for additional CO2 which we add to the atmosphere is only about 35 years. I wrote:
The commonly heard claim that "the change in CO2 concentration will persist for centuries and millennia to come" is based on the "long tail" of a hypothetical CO2 concentration decay curve, for a scenario in which anthropogenic CO2 emissions go to zero, CO2 level drops toward 300 ppmv, and carbon begins slowly migrating back out of the deep oceans and terrestrial biosphere into the atmosphere. It's true in the sense that if CO2 emissions were to cease, it would be millennia before the CO2 level would drop below 300 ppmv. But the first half-life for the modeled CO2 level decay curve is only about 35 years, corresponding to an e-folding "adjustment time" of about fifty years. That's the "effective atmospheric lifetime" of our current CO2 emissions.
Rob wrote, "Dave... The fundamental fact that you disputed is that oceans take up about half of our emissions."
That reflects two points of confusion, Rob.
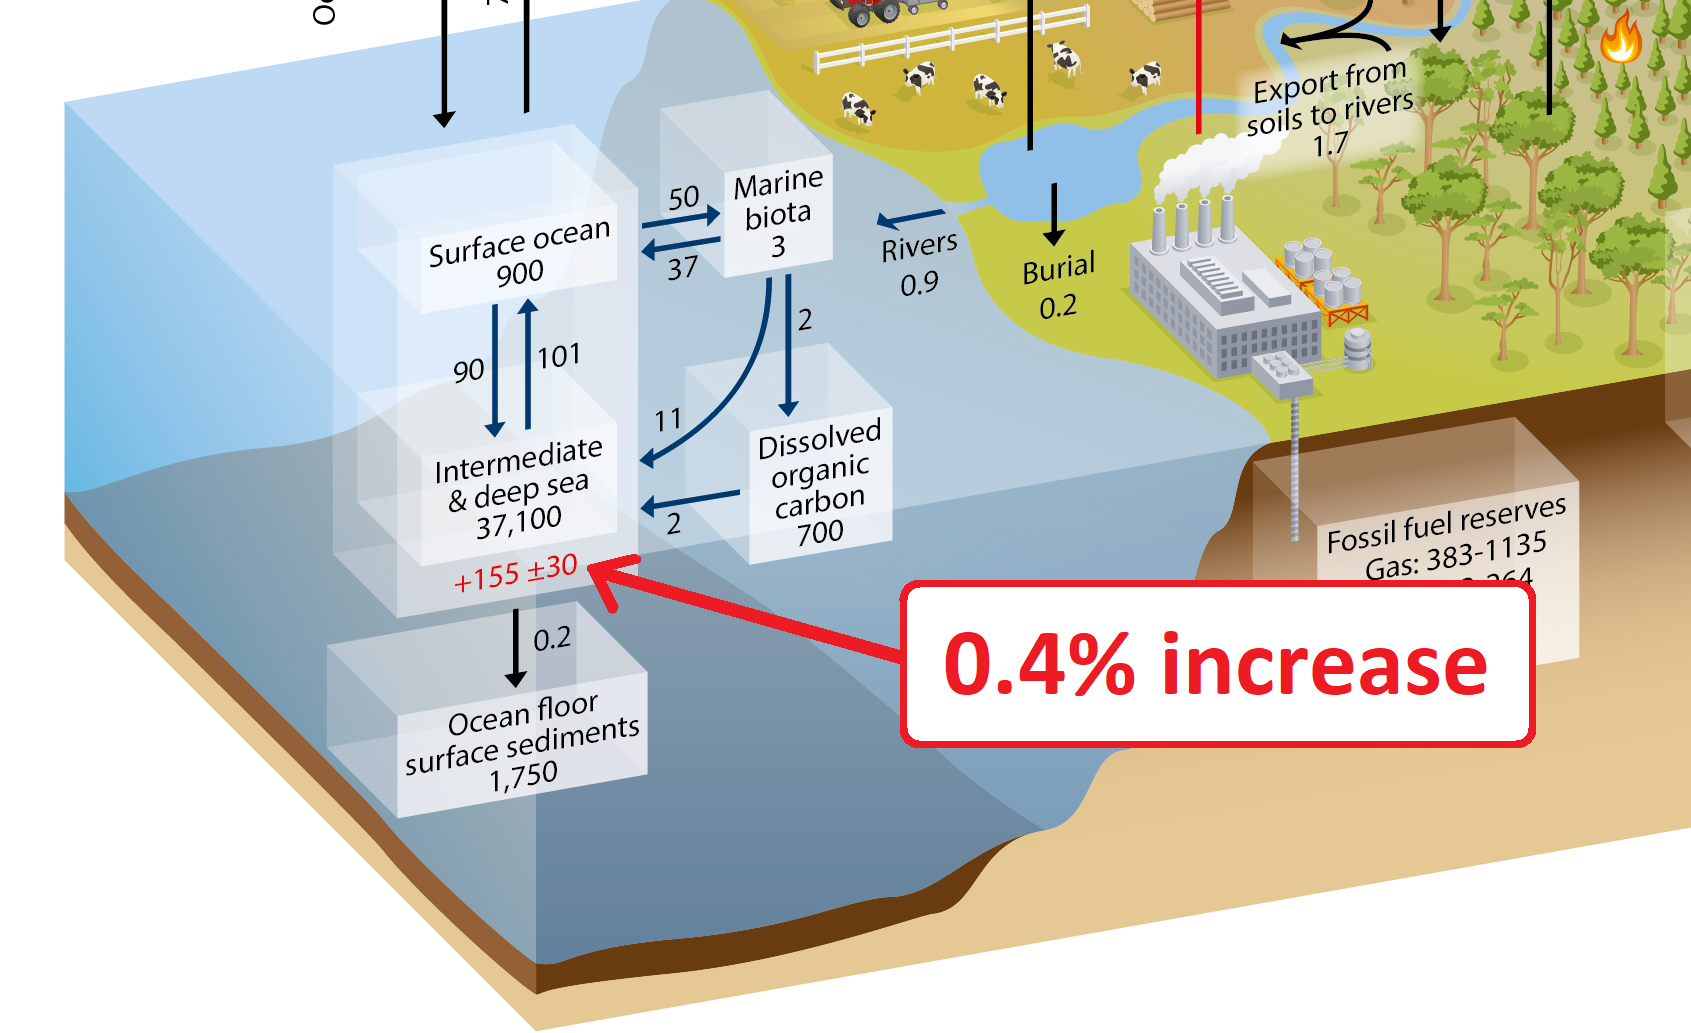
In the first place, our emissions are currently around 11 PgC/year (per the GCP). The oceans remove CO2 from the atmosphere at a current rate of a little over 2.5 PgC/year. That's only about 1/4 of the rate of our emissions, not half.
More fundamentally, the oceans are not removing some fixed fraction of our emissions. None of the natural CO2 removal processes do. All of them remove CO2 from the bulk atmosphere, at rates which largely depend on the atmospheric CO2 concentration, not on our emission rate. If we halved our CO2 emission rate, natural CO2 removals would continue at their current rate.
Because human CO2 emissions are currently faster than natural CO2 removals, we've increased the atmospheric CO2 level by about 50% (140 ppmv), but we've increased the amount of carbon in the oceans by less than 0.5%, as you can see in AR5 WG1 Fig. 6-1.
Sorry, this got kind of long. I hope I addressed all your concerns.
- The Dynamics of The Green Plate Effect
Bob Loblaw at 10:58 AM on 30 June, 2023The bucket analogy does relate to the greenhouse effect in terms of reducing the rate of loss, which requires an adjustment of the bucket level. The reason the bucket reaches a new equilibrium is that as the water level rises, the pressure increases (a linear function of the height of water above the hole), and that increased pressure succeeds in forcing enough water through the smaller hole. We need to remember that there is a pressure term that drives the flow.
The increased pressure in the bucket is an analogy to the increased surface temperature creating a larger temperature difference between the surface and the ubiquitous 255K emitting IR to space in the greenhouse effect.
On the other hand, the Green Plate effect is intended as a specific counterargument to the "cold object can't cause a warm object to heat up" myth. It does not need any reference to the greenhouse effect at all to demonstrate that this "cold object/warm object" myth about the 2nd law is wrong.
If the "cold object/warm object violates 2nd law" argument was correct, then the argument would have to show an error in the Green Plate scenario. If any hard-core denier want to continue with that argument here, they are going to have to do it without any reference to the greenhouse effect. If they can't "disprove" the Green Plate effect, then there is no way that they will be able to apply the [lack of] logic to the more complex greenhouse effect.
- 2023 SkS Weekly Climate Change & Global Warming News Roundup #19
nigelj at 06:21 AM on 15 May, 2023Regarding: "Climate scientists first laughed at a ‘bizarre’ campaign against the BoM – then came the harassment by Graham Readfearn , Guardian, May 7th 2023" (Where the Australian bureau of meterology was essentially falsely accused of introducing a warm bias into the temperature records).
New Zealand had a similar campaign against climate scientists as follows:
Case against NIWA (Summary)
On 5 July 2010, The New Zealand Climate Science Education Trust (NZCSET), associated with the New Zealand Climate Science Coalition, filed a legal case against the National Institute of Water and Atmospheric Research (NIWA) claiming that the organisation had used a methodology to adjust historic temperature data that was not in line with received scientific opinion.[53] The Coalition lodged papers with the High Court asking the court to rule that the official temperatures record of NIWA were invalid. The Coalition later claimed that the "1degC warming during the 20th century was based on adjustments taken by Niwa from a 1981 student thesis by then student Jim Salinger...[and]...the Salinger thesis was subjective and untested and meteorologists more senior to Salinger did not consider the temperature data should be adjusted."[54] The case was dismissed, with the judgement concluding that the "plaintiff does not succeed on any of its challenges to the three decisions of NIWA in the issue. The application for judicial review is dismissed and judgment entered for the defendant."[55] On 11 November 2013, the Court of Appeal of New Zealand dismissed an appeal by the Trust against the award of costs to NIWA.[56][57][58] NIWA Chief Executive John Morgan said the organisation was pleased with the outcome, stating that there had been no evidence presented that might call the integrity of NIWA scientists into question.[59]
There was concern in 2014 that the New Zealand Climate Science Education Trust had not paid the amount of $89,000 to NIWA as ordered by the High Court, and this was a cost to be borne by the taxpayers of New Zealand. Trustee Bryan Leyland, when asked about its assets, said: "To my knowledge, there is no money. We spent a large amount of money on the court case, there were some expensive legal technicalities...[and that]...funding had come from a number of sources, which are confidential".[60] Shortly after that, the New Zealand Climate Science Education Trust (NZCSET) was put into formal liquidation.[61] On 23 January 2014, Salinger stated that this "marked the end of a four-year epic saga of secretly-funded climate denial, harassment of scientists and tying-up of valuable government resources in New Zealand."[62] He also explained the background to the issue around the Seven-station New Zealand temperature series (7SS)[63] and how he felt this had been misrepresented by the Trust.[62]
https://en.wikipedia.org/wiki/Jim_Salinger
(My comments) I recall that during the case NIWAS methodology was also peer reviewed by an independent climate organisation in Australia and they endorsed the methods used. One of the other issues I recall was the judge dismissed the climate denialists expert witnesses because they were not qualified to give evidence on climate science. Details in this article:
hot-topic.co.nz/cranks-lose-court-case-against-nz-temperature-record-niwa-awarded-costs/
More details and link to the full ruling.
www.sciencemediacentre.co.nz/2012/09/07/niwa-climate-record-court-decision-experts-respond/
www.nzherald.co.nz/nz/sceptics-lose-fight-against-niwa-temperature-data/WJJJVHPQLYM5XP6QO3KWST463E/
- CO2 effect is saturated
Bob Loblaw at 00:58 AM on 21 November, 2022Charlie_Brown:
One minor clarification. You say "Radiant energy intensity as a function of wavelength depends only upon the composition and temperature of the emitting source."
Yes, this is correct for radiant energy emitted locally, but when it comes to measuring radiant energy at a point, you get both the locally-emitted energy plus any energy at that wavelength that was emitted elsewhere and has been transmitted through the atmosphere to that point - i.e., it has not been absorbed by the intervening atmosphere. At some wavelengths, where atmospheric absorption is large, it will be mostly locally-emitted. At wavelengths where atmospheric absorption is small, it will be mostly transmitted from elsewhere.
The complication that you refer to in terms of what is seen at any particular height in the atmosphere is that it includes both components (local emission plus transmission). From measurements of radiant energy alone you cannot know how much is from each. For that, you need models that incorporate temperature, all gases and their emission spectra, etc.
And, as you state, models such as MODTRAN will do that for you - but they are not energy balance models. You need to specify the temperature profile (and cloud profile, and gases) and then you can get the profile of radiative energy (upward and downward fluxes, absorption and emission rates).
If that radiative energy transfer does not balance (local absorption and emission are not equal), then locally you will have either heating or cooling. At that point, you can iteratively warm or cool that layer (and all other layers), recalculate the temperature profile, recalculate the radiative transfer, etc until you find a temperature profile that is at equilibrium.
And people have done this. Classic early references are from roughly 60 years ago (and have been linked to earlier in this long comments thread).
If you only consider radiatve transfer, the atmosphere would stabilize at a much steeper temperature gradient than exists. If you adjust for this (Manabe et al's "convective adjustment") you get a very good fit to actual global mean temperature. Figure 1 from Manabe and Strickler shows these two scenarios clearly, as well as the iterative process of radiative calculations, determining heating/cooling, radiative calculations, etc:

An interesting paper appeared in BAMS earlier this month, looking at the historical importance of this early work by Manabe.
Certain stubbornly-ignorant self-proclaimed experts that have repeatedly invaded this thread seem to lose sight of the fact that the atmosphere also emits radiation in the wavelengths that are strongly-absorbed. It's easy to deny that the Greenhouse Effect exists if you deny that CO2 is a strong emitter as well as a strong absorber.
- 2022 SkS Weekly Climate Change & Global Warming News Roundup #45
Bob Loblaw at 12:54 PM on 15 November, 2022Now, to expand a little on that zero-d model from comment # 21. I mentioned that a gradual increase in radiative forcing wlil be different from an instananeous step change of 4W/m2. We can look at that using the same model. We will do three new simulations, to add to the Ocean Mixed Layer one from comment #21, making four simulations:
- The original instantaneous 4 W/m2 step change.
- A scenario where we gradually increase the radiative forcing over 2500 days.
- A scenario where we increase it over 5000 days
- A scenario where we increase it over 10000 days
In each case, we keep the same heat capacity (ocean 60m depth - middle line from comment #21). We also keep the same final radiative forcing: 4 W/m2 at the end of the "ramping up" period (1, 2500, 5000, or 10000 days).
Here is the temperature evolution:

...and here is the radiative imbalance:

Note that the temperature evolution over the 10,000 day period is quite different if we spread the forcing over a longer period. In the fourth line, when full radiative forcing is not reached until day 10,000, we still have a ways to go before reaching equilibrium. The system has responded fully to the forcing that was added 30 years ago, but not to the recent forcing.
You will note that the imbalance graph only reaches 4W/m2 for the 1-day (instantaneious) step change. That is the difference between the radiative forcing and the radiative imbalance - they are not the same thing.
- The forcing is an input, and is always expressed relative to the pre-change conditions (day 0).
- The imbalance is the net difference between the forcing and any adjustments in the outgoing radiation related to how the system has heated up. Since we do not reach 4W/m2 forcing until day 2500 (or 5000, or 10000), the system has had a chance to adjust to the forcing that happened before that day.
In the 5000-day ramp-up, we reach 4W/m2 of forcing on day 5000, but the system has already achieved about 2.4W/m2 of adjustment, leaving only 1.6 W/m2 imbalance.
Again, the temperature evolution over time is different. You need to consider this when interpreting the temperature evolution with respect to time lags, forcing etc.
- No, a cherry-picked analysis doesn’t demonstrate that we’re not in a climate crisis
Bob Loblaw at 06:13 AM on 9 October, 2022Eric:
From the first paragraph of the link to the COOP web page you provide (emphasis added):
COOP data usually consist of daily maximum and minimum temperatures, snowfall, snow depth, and 24-hour precipitation totals.
Next question:
How did your analysis determine 1-hour and 6-hour totals from that data?
Hint: the COOP network involves manual reading of data. Temperature from a max/min thermometer (once per day), and precipitation total from a rain gauge that sits and collects rainfall for 24 hours, and is emptied manually and the quantity measured (once per day).
Side note: this is the network that requires the time of day adjustment for temperature trends.
- 2nd law of thermodynamics contradicts greenhouse theory
grindupBaker at 03:06 AM on 15 July, 2022The underlying heat-adjustment effect works like this:
---------
"GREENHOUSE EFFECT", TRYING TO WARM IF THE QUANTITY INCREASES
- The "greenhouse effect" in Earth's troposphere operates like this: Some of the "LWR" aka "infrared" radiation heading up gets absorbed into cloud above instead of going to space so that's the "heat trapping" effect of a cloud. The top portion of the cloud radiates up some of the LWR radiation that's manufactured inside the cloud but it's less amount than the LWR that was absorbed into the bottom of the cloud because the cloud top is colder than below the cloud and colder things radiate less than warmer things. That is PRECISELY the "greenhouse effect" in Earth's troposphere. It's the "greenhouse effect" of liquid "water" and solid "ice" in that example. You can see that "greenhouse effect" of liquid "water" and solid "ice" for all the various places on Earth from CERES satellite instrument at https://www.youtube.com/watch?v=kE1VBCt8GLc at 7:50. It's the pink one labelled "Longwave....26.2 w / m**2" so cloud globally has a "greenhouse effect" of 26.2 w / m**2.
- Solids in the troposphere have the exact same effect as the "cloud greenhouse effect" above for the exact same reason.
- Infrared-active gases in the troposphere (H2O gas, CO2, CH4, N2O, O3, CFCs) have the exact same effect as the "cloud greenhouse effect" above for the exact same reason. Non infrared-active gases in the troposphere (N2, O2, Ar) have no "greenhouse effect" because their molecule is too simple to get the vibrational kinetic energy by absorbing a photon of LWR radiation or by collision. The "greenhouse effect" really is that simple, and it's utterly 100% certain.
---------
SUNSHINE REFLECTION EFFECT, TRYING TO COOL IF THE QUANTITY INCREASES
- Clouds (liquid "water" and solid "ice") absorb & reflect some sunlight and the "reflect" part has an attempt-to-cool effect, which has nothing whatsoever to do with the "greenhouse effect". You can see that "sunlight reflection attempt-to-cool effect" of liquid "water" and solid "ice" for all the various places on Earth from CERES satellite instrument at https://www.youtube.com/watch?v=kE1VBCt8GLc at 7:50. It's the blue one labelled "Shortwave....-47.3 w / m**2" so cloud globally has a sunshine reflection effect of 47.3 w / m**2.
- Solids in the troposphere absorb & reflect some sunlight and the "reflect" part has an attempt-to-cool effect, which has nothing whatsoever to do with the "greenhouse effect".
- Infrared-active gases in the troposphere (H2O gas, CO2, CH4, N2O, O3, CFCs) do not absorb or reflect any sunlight (minor note: except a tiny portion in the high-frequency ultraviolet where O2 & O3 has absorbed most of it already in the stratosphere above the troposphere).
---------
NET EFFECT OF THE 2 ENTIRELY-DIFFERENT EFFECTS DESCRIBED ABOVE
- The net result of the 2 entirely-different "cloud" effects is that clouds have a net cooling effect of 21.1 w / m**2 as seen in the blue-hues pictorial at left on screen at either of my 2 GooglesTubes links above.
- The net result for solids in the troposphere is a net cooling effect because the change in this effect by humans is the "global dimming" atmospheric aerosols air pollution effect and that's a cooling effect (separate from its cloud change effect).
- The net result for infrared-active gases in the troposphere (H2O gas, CO2, CH4, N2O, O3, CFCs) is a warming effect because their 2nd effect above is negligible, essentially zero.
---------
Cartoons or text that describe a "greenhouse effect" in which photons from the surface are absorbed by infrared-active gas molecules and then are re-emitted with 50% of it going down and warming the surface are incorrect because they do not include a tropospheric temperature lapse rate which is an absolute requirement. Explanations of the "greenhouse effect" which include phrases like "the radiation from the surface does not directly heat the atmosphere" are incorrect because there are simple laboratory experiments which prove that infrared radiation does indeed heat the CO2 infrared-active gas and its surroundings (which means, of course, that molecular vibrational kinetic energy is converted on collision to molecular translational kinetic energy before it happened to "thermally relax" and emit a photon and thus no photon was "re-emitted" in that case).
++++++++++
Cloudy winter nights don't cool as much as clear-sky winter nights. It is PRECISELY the "greenhouse effect" in Earth's troposphere which causes that. - It's albedo
Bob Loblaw at 12:52 PM on 9 September, 2021Coolmaster:
Little of your most recent comment has passed moderation. In what little remains, you double-down on your claim of a strong cooling effect for clouds. Let's examine some actual science.
Note that in comment 70, although I said that the diagrams you provided in comment 69 were "a useful expansion", I also noted that "summary diagrams are summary diagrams - not detailed models."
First, you claimed in #71 that 1% increase in evaporation will lead to a 1% increase in clouds, and you have repeatedly claimed that increasing cloud has a cooling effect. You also said "I look forward to your criticism and assessment", so let's see if you really mean that.
We will start with the consequences of an increase in evaporation, and we'll limit it to the land surface you have talked about (although it doesn't really make any difference to what I will present). What happens when we manipulate surface conditions to increase evaporation?
- Atmospheric water vapour will increase above that surface.
- The atmosphere will probably move that water vapour away from the surface, either vertically (convective mixing) or horizontally (advection due to wind)..
- If conditions are suitable, that extra water vapour may rise to the point where it condenses to form cloud, but this is not always the case. If it does form cloud, the location may be local, but it is more likely to be a long way away.
- As a consequence of increasing evporation, the location where the evaporation occurs will also see less thermal energy transfer to the atmosphere, so temperatures are also affected. As a result, we see changes in both temperature and humidity, and these changes will be carried downwind.
- Downwind, the changes in temperature and humidity will affect the energy fluxes in those other locations - possibly suppressing evaporation (because the overlying air is now cooler and more humid).
Now, if the additional water vapour forms cloud, we have to ask "what kind of cloud?". That depends on where and how the lifting of the air occurred which led to cooling and cloud formation. Cloud types vary a lot. Wikipedia has a nice discussion, and gives us this nice diagram:
")
So, will this "extra" humidity cause more cloud? Maybe. Maybe not. Maybe it will lead to a different cloud type. Maybe it wll lead to a similar cloud type, but at a different altitude. All of this will affect how radiation fluxes will be affected.
Coolmaster's argument then depends on claims that cloud cover will increase, and that the diagrams he has provided show the radiatove flux changes. Let us consider some of the possible radiative changes.
- A change in horizontal extent - but no change in any other cloud characteristics - will affect the ratios between clear sky and cloudy sky. This is easy to estimate.
- We may not have the same cloud type, though. Different cloud types have different radiative properties. High clouds tend to be thin, transparent, and let a lot of solar radiation through. They also may not behave as blackbodies for IR radiation.
- Low clouds are much less transparent. For IR radiation, two properties are important: cloud top temperature controls the IR emitted upward, while cloud base temperature controls the downward flux. Change the vertical temperature profile, or change the bottom or top heights of the clouds, and you change the IR radiation fluxes. This is not determined by cloud area.
None of these details are covered in the diagrams or discussion presented by coolmaster. I will repeat what I said before: summary diagrams are summary diagrams - not detailed models.
Can we find models that do include thse sorts of effects? Yes. I will dig back into two early climate change papers that were key developments in their day. They covered basics that more recent papers do not repeat, so they provide useful diagrams.
The first is Manabe and Strickler, 1964, JAS 21(4), Thermal Equilibrium of the Atmosphere with a Convective Adjustment.
Their figure 7a shows model results that cover different cloud assumptions:

Note that cloud type and height both have significant effects on the modelled radiative equilibrium. (Follow the link to the paper if you need more context.)
The 1964 paper was followed by another in 1967: Manabe and Wetherald, 1967, JAS 24(3) Thermal Equilibrium of the Atmosphere with a Given Distribution of Relative Humidity
They give two figures of interest: 20 and 21:

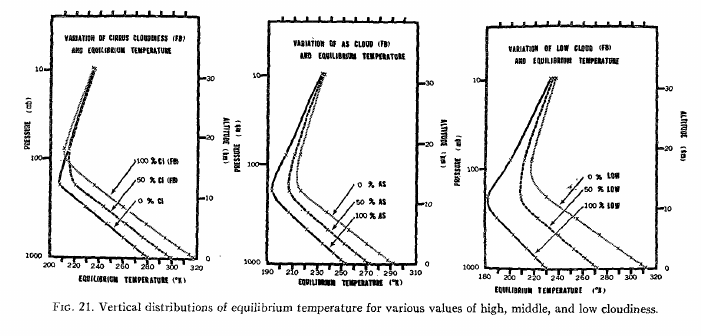
Again, follow the link to the paper for context (and perhaps larger views of the graphs).
These two figures show responses to changes in cloud amounts, for several different cloud types in their model.
- In figure 20, low and middle cloud have negative slopes (temperature as a function of cloud amount), while high cloud has a positive slope. Increasing high cloud has a warming effect.
- In figure 21, we see three diagrams of equilibrium temperature, for the same three cloud types. Each diagram shows the results for three different cloud amounts (0, 50, and 100%). The diagram on the left is for high cloud, and we see warmer tropospheric temperatures for higher cloud amounts. This is the opposite for middle and low cloud, where increasing cloud amount causes cooling.
So, we can see that climate science has know for over 60 years that different cloud types and heights have significant differences in their role in radiation transfer. The papers I have cited used a one-dimensional radiative-convective model, which is simple by modern standards. Current three-dimensional general circulation models incorporate even more vertical cloud processes, and add the horizontal dimensions that include the horizontal transport of water vapour I mentioned at the start of this comment. They generate cloud internally, based on physics, rather than assuming specific distributions - but the key message is the same:
Cloud amount, cloud type, cloud height, horizontal distribution - all are important in properly assessing the radiative effect of clouds.
Coolmaster's diagrams are nice pictures that help illustrate a few aspects of the complexity of clouds and atmospheric radiation transfer, but they are totally unsuited to the sort of predictive analysis he is trying to perform.
- The New Climate War by Michael E. Mann - our reviews
Nick Palmer at 09:33 AM on 23 June, 2021Just in case you lot are still resisting the idea that the politics relating to climate science have become extremely polarised - in my view to the point where ideologues of both the left and right think it justified to exaggerate/minimise the scientific truths/uncertainties to sway the democratically voting public one way or the other - here's a video blog by alt-right hero and part of the original Climategate team who publicised the emails, James Delingpole basically saying that 'the left' have infiltrated and corrupted the science for the purpose of using political deception to seize power for themselves.
https://www.youtube.com/watch?v=866yHuh1RYM
Deconstruct or follow up Delingpoles' rhetoric elsewhere and you will find a helluva lot of intelligent articulate people who believe that the public's environmental consciences are being exploited by closet socialist forces to deceive them, using 'fear porn', into voting for policies which they otherwise wouldn't consider voting for, in a dark strategy to bring in some form of latter day Marxism. They insinuate this has got its tentacles into climate science which they assert has led to the reality of the science, as presented to the public, being twisted by them for political ends. It's absolutely not just Greenpeace, as I already said, who've 'gone red' to the point where it has 'noble cause' corrupted their presentations of environmental matters and, crucially, the narrow choice of solutions they favour - those which would enable and bring on that 'great reset' of civilisation that they want to see. It's much, much bigger than that.
I think we are seeing a resurgence and a recrystallisation of those who got convinced by Utopianist politics of the left and free market thinkers of the right taught at University - Marxist-Leninism, Ayn Rand, Adam Smith etc. Most of those students eventually 'grew up' and mellowed in time, leaving only a small cadre of incorrigible extremists but who are now, as the situation is becoming increasingly polarised politically, revisiting their former ideologies. In essence 'woking' up. I submit that the real battle we are seeing played out in the arena of climate matters is not between science and denialism of science - those are only the proxies used to manipulate the public. The true battle is between the increasingly polarised and increasingly extreme and deceitful proponents of the various far left and right ideologies and their re-energised followers.
It is now almost an article of faith, so accepted has it become, amongst many top climate scientists and commentators, that 'denialism' is really NOT motivated by stupidity or a greedy desire to keep on making as much money as possible but is rather a strong resistance to the solutions that they fear are just 'chess moves' to bring about the great Red 'reset' they think the 'opposition' are secretly motivated by.
Here's an excellent article by famous climate scientist Katharine Hayhoe identifying those who are 'solutions averse' as being a major factor in denialism. It touches on the 'watermelon' aspect. You can turn a blind eye to what I am saying if you want, but in that case you should also attack Hayhoe too - but don't expect many to applaud you...
https://theecologist.org/2019/may/20/moving-past-climate-denial
Also try this: https://www.thecut.com/2014/11/solution-aversion-can-explain-climate-skeptics.html
https://today.duke.edu/2014/11/solutionaversion
I think some people who fight climate science denialism still have the naive idea that just enlessly quoting the science to them, and Skepticalscience's F.L.I.C.C logical fallacies, will make denialists fall apart. I too used to think that if one would just keep hammering away, eventually they would give up. Anyone who tries this will find that it actually does not work well at all. Take on some of the smarter ones and you will rapidly find that you are, at least in the eyes of the watching/reading/listening public, who are the only audience it's worthwhile spending any time trying to correct, outgunned scientifically and rhetorically. That's why I don't these days much use the actual nitty-gritty science as a club with which to demolish them because the smarter ones will always have a superficially plausible, to the audience at least, comeback which looks convincing TO THE AUDIENCE. Arguing the science accurately can often lose the argument, as many scientists found when they attempted to debate such notorious, yet rhetorically brilliant sceptic/deniers such as Lord Monckton.
I haven't finished trying to clarify things for you all but right back at the beginning, in post#18, I fairly covered what I was trying to suggest is a more realistic interpretation of the truth than the activist's simplistic 'Evil Exxon Knew' propaganda one. In short, most of you seem to believe, and are arguing as if, the science was rock solid back then and that it said any global warming would certainly lead to bad things. This is utterly wrong, and to argue as if it was true is just deceitful. As I have said, and many significant figures in the field will confirm, I've been fighting denialism for a very long time so when denialists present some paper or piece of text extracted from a longer document as 'proof' of something, I always try and read the original, usually finding out that they have twisted the meaning, cherry picked inappropriate sentences or failed to understand it and thereby jumped to fallacious conclusions - similarly I read the letters and extracts that Greenpeace used and, frankly, either they were trying deliberately to mislead or they didn't understand the language properly and jumped to their prejudiced conclusions and then made all the insinuations that we are familiar with and that nobody else seems be questioning much, if at all. The idea that Exxon always knew that anthropogenic climate change was real (which they, of course, did) AND that they always knew that the results of that would be really bad and so they conspired to cover that bad future up is false and is the basis of the wilful misreading and deceitful interpretation of the cherry picked phrases, excerpts and documents that has created a vastly worse than deserved public perception of how the fossil fuel corporations acted. Always remember that, at least ideally, people (and corporations) should be presumed innocent until proven beyond reasonable doubt to be guilty. Greenpeace/Oreskes polemics are not such proof. Their insinuations of the guilt of Big Oil is just a mirror image of how the Climategate hackers insinuated guilt into the words of the top climate scientists.
Here's a clip from my post#18
NAP: "When activists try to bad mouth Exxon et al they speak from a 'post facto' appreciation of the science, as if today's relatively strong climate science existed back when the documents highlighted in 'Exxon knew' were created. Let me explain what I think is another interpretation other than Greenpeace/Oreskes'/Supran's narratives suggesting 'Exxon knew' that climate change was going to be bad because their scientists told them so as far back as the 70s and 80s. Let me first present Stephen Schneider's famous quote from 1988 (the whole quote, not the edited one used by denialists).
S.S. "On the one hand, as scientists we are ethically bound to the scientific method, in effect promising to tell the truth, the whole truth, and nothing but – which means that we must include all doubts, the caveats, the ifs, ands and buts. On the other hand, we are not just scientists but human beings as well. And like most people we’d like to see the world a better place, which in this context translates into our working to reduce the risk of potentially disastrous climate change. To do that we need to get some broad based support, to capture the public’s imagination. That, of course, means getting loads of media coverage. So we have to offer up scary scenarios, make simplified, dramatic statements, and make little mention of any doubts we might have. This “double ethical bind” we frequently find ourselves in cannot be solved by any formula. Each of us has to decide what the right balance is between being effective and being honest. I hope that means being both.""
Stephen Schneider, as a climate scientist, was about 'as good as it gets' and he said that in 1988. Bear in mind that a lot of the initial framing to prejudice readers that 'Exxon knew' used was based on documents from considerably longer ago, so what are the activists who eagerly allowed themselves to be swept up in it until no-one questioned it turning a blind eye to? It's that the computer models of the time were extremely crude because computer technology back then was just not powerful enough to divide Earth up into enough finite element 'blocks' of small enough size to make model projections of much validity, in particular projections of how much, how fast and how bad or how good... Our ideas of the feedback effects of clouds and aerosols back then was extremely rudimentary and there were widely differing scientific opinions as to the magnitude or even the direction of the feedback. The scientific voices we see in Exxon Knew tend to be those who were suggesting there was lot more certainty of outcome than there actually was. That their version has been eventually shown to be mostly correct by a further 40 years of science in no way means they were right to espouse such certainty back then - just lucky. As I pointed out before, even as late as the very recent CMIP6 models, we are still refining this aspect - and still finding surprises. To insinuate that the science has always been as fairly rock solid as it today is just a wilful rewriting of history. Try reading Spencer Weart's comprehensive history of the development of climate science for a more objective view of the way things developed...
ExxonMobil spokesperson Allan Jeffers told Scientific American in 2015. “The thing that shocks me the most is that we’ve been saying this for years, that we have been involved in climate research. These guys (Inside Climate News) go down and pull some documents that we made available publicly in the archives and portray them as some kind of bombshell whistle-blower exposé because of the loaded language and the selective use of materials.”
Look at the phrases and excerpts that were used in both Greenpeace's 'Exxon Knew' and 'Inside Climate News's' exposés. You will find they actually are very cherry picked and relatively few in number considering the huge volumes of company documents that were analysed. Does that remind you of anything else? Because it should. The Climategate hackers trawled through mountains of emails - over ten years worth - to cherry pick apparently juicy phrases and ended up with just a few headline phrases, a sample of which follow. Now, like most of us now know, there are almost certainly innocent and valid explanations of each of these phrases, and independent investigations in due course vindicated the scientists. Reading them, and some of the other somewhat less apparently salacious extracts that got less publicity, and comparing them with the 'presented as a smoking gun' extracts from Greenpeace/Oreskes/Supran etc I have to say, on the face of it, the Climategate cherry picks look more evidential of serious misdeeds than the 'Exxon Knew' excerpts. Except we are confident that the Climategate hackers badly misrepresented the emails by insinuating shady motives where none were. Why should we not consider that those nominally on the side of the science did not do the same? Surely readers here are not so naive aas to believe that everyone on 'our side' is pure as the driven snow and all those on the 'other side' are evil black hats?
Here's a 'top eight'
1) Phil Jones "“I’ve just completed Mike’s [Mann] Nature trick of adding in the real temps to each series for the last 20 years (i.e. from 1981 onwards) and from 1961 for Keith’s [Briffa] to hide the decline.”
2) “Well, I have my own article on where the heck is global warming…. The fact is that we can’t account for the lack of warming at the moment and it is a travesty that we can’t.” [Kevin Trenberth, 2009]
3) “I know there is pressure to present a nice tidy story as regards ‘apparent unprecedented warming in a thousand years or more in the proxy data’ but in reality the situation is not quite so simple." Keth Briffa
4) Mike [Mann], can you delete any e-mails you may have had with Keith [Trenberth] re AR4? Keith will do likewise…. Can you also e-mail Gene and get him to do the same? I don’t have his e-mail address…. We will be getting Caspar to do likewise.” [Phil Jones, May 29, 2008]
5) “Also we have applied a completely artificial adjustment to the data after 1960, so they look closer to observed temperatures than the tree-ring data actually were….” [Tim Osborn, Climatic Research Unit, December 20, 2006]
6) “I can’t see either of these papers being in the next IPCC report. Kevin [Trenberth] and I will keep them out somehow, even if we have to redefine what the peer-review literature is!” [Phil Jones, July 8, 2004]
7) “You might want to check with the IPCC Bureau. I’ve been told that IPCC is above national FOI Acts. One way to cover yourself and all those working in AR5 [the upcoming IPCC Fifth Assessment Report] would be to delete all e-mails at the end of the process. Hard to do, as not everybody will remember it.” [Phil Jones, May 12, 2009]
8) “If you look at the attached plot you will see that the land also shows the 1940s warming blip (as I’m sure you know). So, if we could reduce the ocean blip by, say 0.15 deg C, then this would be significant for the global mean—but we’d still have to explain the land blip….” [Tom Wigley, University Corporation for Atmospheric Research, to Phil Jones, September 28, 2008]
Please at least consider the possibility that Greenpeace, who have been deceiving the public about the toxicity and carcinogenicity of this, that and the other for decades (ask me how if you want to see how blatant their deceit or delusion is... showing this is actually very quick and easy to do) were, in a very similar way, and motivated by their underlying ideology, deliberately (or delusionally) misrepresenting innocent phrases to blacken names excessively too.
- Why does land warm up faster than the oceans?
Bob Loblaw at 00:08 AM on 9 February, 2021AerosGreen:
Regarding ocean temperature gradients, I think you are missing the aspect that ocean circualtion at depth is also driven by salinity differnces (which cause density differnces)
On an annual basis, land temperature cycles only influence the top 10m or so. The ocean mixed layer depth (mixed by surface winds - ie.. interacting more closely with the atmosphere) is more like 60-100m. So increased heat capacity plus much more volume.
TIme constant for the mixed ocean layer is decades.
For deeper oceans, we're talking hundreds of years for circulation patterns to run their course - so adjustment to surface changes is very slow.
- More CO2 in the atmosphere hurts key plants and crops more than it helps
One Planet Only Forever at 03:26 AM on 25 December, 2020ubrew12,
Tragically many people only look for a 'personal positive' to allow them to dismiss or out-weigh any other information about the negatives of something they want to benefit from. That happens regarding lots of issues. It is self-interest encouraged to become harmful selfishness by competition for status, especially when harmful misleading cheaters can get away with winning.
The latest Human Development Report (2020) presents the improved understanding of the need to consider the value of the natural environment (non-renewable resources as well as renewable biodiversity) when evaluating 'development progress'. The majority of HDR 2020 is regarding climate change impacts, including impacts on biodiversity due to climate change. Understanding that evaluation of human development sustainability needs to consider 'these externalities to human-centric considerations' is only now potentially becoming more of 'the Norm'. That more holistic evaluation on starting to be 'more of the norm' shows how harmfully biased the 'norms of the richest people and the supposedly most advanced nations with the most influence on how things are investigated and perceived' have developed to be.
An important addition to understanding in HDR 2020 is the modification of the Human Development Index to reduce the evaluated level of 'measures of human progress' by accounting for CO2 Emissions per capita and Material Footprint per capita (including counting impacts that happen in other nations but are imported - imported impacts of production that happen in another nation). That simple Common Sense adjustment punts many of the 'supposedly most advanced nations many levels down the ranks (Canada drops from 16th to 56th, USA drops from 17th to 67th, Australia drops from 8th to 80th, New Zealand rises from 14th to 8th).
It is important to understand the fuller story like the presentation in the HDR 2020. That can help argue against many possible claims of 'positive results from climate change (or any other harmful activity)'.
I try to make the point that it is incorrect to believe that a 'positive benefit' can be justified by comparing the 'positive' with any 'negatives' and deciding that the 'positives' out-weight the 'negatives' (that evaluation is really only valid for things like medical interventions where the person 'potentially harmed' is the person 'potentially helped'. Much more consideration is involved to justify comparing 'positives for Some People' with 'negatives for Others' - positives for desperately poor have to out-weigh concerns for reduced wealth of the wealthiest that still has the wealthiest as the wealthiest).
I also try to point out that a 'positives for some' vs. 'negatives for Others' comparison is hard to make 'fairly' because current day people, especially higher status people, are likely to have biased perceptions of "Their Positives" vs. "Future Negatives". And there is the constant problem in current day populations of people being biased about "Their Group's Benefits" vs. "Harm Done to Others" (which is the same problem as the current day vs. future when future people are considered to be Others).
Also, the restriction of the evaluations to what currently counts in Human Economic Activity is also a very harmful way to evaluate things. What is not yet know about the harm being done by human activities 'argued to be progress' can be very tragic for the future of humanity.
An example of how a biased person could interpret the HDR 2020 content would be focusing on the bits of 'positives'. One of those 'bits of positive' in the report is the reference to evaluations that indicate that global warming by 2100 will likely reduce the number of extreme temperature days in the Rich Northern nations. The measure is simply the expected yearly change of number of extremely hot or cold days without any consideration of the magnitude of the temperature change (if there are fewer extra extreme hot days than the reduction of the number of extreme cold days the measure is a 'drop in extreme days'). That 'Positive' perception misses the fact that the same report indicates the number of extreme days in a year will be increasing in most of the rest of the nations. And it dismisses any consideration of all the other harmful consequences of unsustainable development pursuing 'improvements' that erroneously can consider harmful over-development of conditions for the richest today to be 'worth it' because the evaluated improvements by and for the richest exceed the perceptions by the richest of the 'lack of improvement' for the future generations or for the less-rich portions of the population (those Others).
- 2020 SkS Weekly Climate Change & Global Warming News Roundup #25
Eclectic at 20:06 PM on 22 June, 2020Lawrie @9 , Slarty Bartfast maintains that there is no global warming of any significance at a statistical level or at a physical planetary level. So to him, albedo is irrelevant.
Being more than 24 hours since his last posting, it seems unlikely that Slarty will return to attempt rebuttal of criticisms of against his many positions. But we can hope he will return, to give a grand explication of his apparent errors and inconsistencies.
In order to save the valuable time of SkS readers, I have looked further into Slarty's blog of May / June 2020 , and I have pulled out some points of interest. Slarty's statistical/mathematical skills are (IMO) far exceeding his climate science knowledge . . . and somehow I am reminded of the very emeritus & climatically-challenged Ivar Giaever !
I have taken some care not to misrepresent or quote-mine Slarty. And please note that Slarty, in his blog, describes himself as: physicist / socialist / evironmentalist.
1. Sea level rise cannot be more than slight , because there is no CO2-AGW or CO2-led Greenhouse effect. And so our coastal cities have zero danger of submersion.
2. What little CO2-greenhouse effect is present now, is produced by CO2 reflecting IR back to the planetary surface.
3. Weather stations fail to give valid planetary data because they are far too few, and (just as importantly) they are not evenly spaced.
4. "temperature records just aren't long enough ... to discern a definite trend ... you need at least 50 years."
5. "[land ice] In Antarctica (and Greenland) this is virtually all at altitude (above 1000 m) where the mean temperature is below -20 C, and the mean monthly temperature NEVER gets above zero, even in summer. Consequently, the likelihood of any of this ice melting is negligible."
6. AGW forcing does not supply enough heat to melt ice at the poles [he seems to include the Arctic, too].
7. The Arctic is not warming. [Presumably news to those alarmist Inuit who live there.]
8. Berkeley Earth Study repeats the sins of Hadley/ NOAA / etc but in a more transparent way ~ and BEST generates a falsely-positive warming trend through its misuse of Breakpoint Adjustments (rather than using raw data).
9. Slarty's oceanic thermal expansion calculations are wrong [as pointed out by MA Rodger].
And there's more !
- YouTube's Climate Denial Problem
nigelj at 11:15 AM on 6 April, 2020dudo39 @8
Your comments are mostly misguided. Sorry about that, you will get over it.
We already know and accept water vapour is a greenhouse gas, but you have to be able to explain why its increased in the atmosphere in recent decades, and the IPCC has determined this is because of the CO2 forcing causing evaporation. The proven underlying thing driving the warming is CO2, with water vapour as a feedback. We know the spectral properties of the water molecule so know how much warming this water vapour causes in comparison to the C02 molecule.
The one area of doubt is the effect of clouds, but most published research finds they have a slightly positive warming effect overall or are neutral. They cannot be sharply negative or there would be no warming.
You do not need one million argo floats to sufficiently sample ocean temperatures. And ocean temperature trends are broadly similar to atmospheric and land based trends which you would expect so this provides evidence there are more than enough argo floats, and that 'drift' is not a significant issue.
The issue with weather stations in northern Russia obviously has little significance for global temperatures, and you provide no link to back up your assertions about Russia. The urban heat island effect is taken into consideration and temperatures are adjusted downwards where its an issue. And research has determined its not a huge issue anyway.Regarding temperature adjustments, Read this article.
Since you are so conerned about facts, the global temperature dataset as a whole has been adjusted down because of a known issue with ships buoy issues. This is the reality, and is the complete opposite of the false denialist claims that global tempertaures have been adjusted upwards. Read this article.
Now go away and spread your useless, badly informed doubt somewhere else preferably in a hole in the ground.
- I had an intense conversation at work today.
nigelj at 12:59 PM on 15 January, 2020TomJanson @24, the point of the thread is Taminos article at the top which points out how these fires are different from the 1970's and how they are being influenced by warming.
Your comments are disgraceful. People have died, the fires a very much in urban areas, billions of animals have died. People wont forget that in a hurry.
Your claims of temperature adjstments are sloganeering. But for the record the key global adjustments, done for proper reasons, adjust global temperatures down as below. So this doesn't look like much of a conspiracy to exaggerate warming now does it.
www.carbonbrief.org/explainer-how-data-adjustments-affect-global-temperature-records
As you can see from the graph down the page, most adjustments for the global record are in the early part of last century, and relate to problems with ocean measurements. The difference between raw and adjusted data since the 1980s is insignificant.
- Sea level rise is exaggerated
Daniel Bailey at 09:28 AM on 1 December, 2019Not sure what your definition of "uniformly even" is. Did you expect them to be so?
Firstly, global sea level rise is a global average and the surface of the oceans are anything but level (the surface of the oceans follow the gravitic shape of the Earth and are also subject to solar, lunar, sloshing and siphoning effects and oceanic oscillations, etc, all of which need to be controlled for).
From the NCA4, global average sea level has risen by about 7–8 inches since 1900, with almost half (about 3 inches) of that rise occurring since 1993:

From NOAA STAR NESDIS:

"Only altimetry measurements between 66°S and 66°N have been processed. An inverted barometer has been applied to the time series. The estimates of sea level rise do not include glacial isostatic adjustment effects on the geoid, which are modeled to be +0.2 to +0.5 mm/year when globally averaged."
Regional SLR graphics are also available from NOAA STAR NESDIS, here.
This is a screenshot of NOAA's tide gauge map for the Western Pacific (NOAA color-codes the relative changes in sea levels to make it easier to internalize):

Clicking on the Funafuti, Tuvalu tide gauge station we see that sea levels are rising by 3.74 mm/yr (above the global average) there, with a time series starting around 1978 and ending about 2011:

However, the time series used by your BOM link for Funafuti (1993-2019) is shorter and the BOM also does not apply a linear trend line to it like NOAA does:

Feel free to make further comparisons, but comparing a set of graphics with no trend lines vs those with trend lines is no comparison at all.
From the recent IPCC Special Report 2019 - Ocean and Cryosphere in a Changing Climate - Summary for Policy Makers, September 25, 2019 release (SROCC 2019), the portions on sea level rise:Observed Physical Changes
A3. Global mean sea level (GMSL) is rising, with acceleration in recent decades due to increasing rates of ice loss from the Greenland and Antarctic ice sheets (very high confidence), as well as continued glacier mass loss and ocean thermal expansion. Increases in tropical cyclone winds and rainfall, and increases in extreme waves, combined with relative sea level rise, exacerbate extreme sea level events and coastal hazards (high confidence).A3.1 Total GMSL rise for 1902–2015 is 0.16 m (likely range 0.12–0.21 m). The rate of GMSL rise for 2006–2015 of 3.6 mm yr–1 (3.1–4.1 mm yr–1, very likely range), is unprecedented over the last century (high confidence), and about 2.5 times the rate for 1901–1990 of 1.4 mm yr–1 (0.8– 2.0 mm yr–1, very likely range). The sum of ice sheet and glacier contributions over the period 2006–2015 is the dominant source of sea level rise (1.8 mm yr–1, very likely range 1.7–1.9 mm yr–1), exceeding the effect of thermal expansion of ocean water (1.4 mm yr–1, very likely range 1.1–1.7 mm yr–1) (very high confidence). The dominant cause of global mean sea level rise since 1970 is anthropogenic forcing (high confidence).
A3.2 Sea-level rise has accelerated (extremely likely) due to the combined increased ice loss from the Greenland and Antarctic ice sheets (very high confidence). Mass loss from the Antarctic ice sheet over the period 2007–2016 tripled relative to 1997–2006. For Greenland, mass loss doubled over the same period (likely, medium confidence).
A3.3 Acceleration of ice flow and retreat in Antarctica, which has the potential to lead to sea-level rise of several metres within a few centuries, is observed in the Amundsen Sea Embayment of West Antarctica and in Wilkes Land, East Antarctica (very high confidence). These changes may be the onset of an irreversible (recovery time scale is hundreds to thousands of years) ice sheet instability. Uncertainty related to the onset of ice sheet instability arises from limited observations, inadequate model representation of ice sheet processes, and limited understanding of the complex interactions between the atmosphere, ocean and the ice sheet.
A3.4 Sea-level rise is not globally uniform and varies regionally. Regional differences, within ±30% of the global mean sea-level rise, result from land ice loss and variations in ocean warming and circulation. Differences from the global mean can be greater in areas of rapid vertical land movement including from local human activities (e.g. extraction of groundwater). (high confidence)
A3.5 Extreme wave heights, which contribute to extreme sea level events, coastal erosion and flooding, have increased in the Southern and North Atlantic Oceans by around 1.0 cm yr–1 and 0.8 cm yr–1 over the period 1985–2018 (medium confidence). Sea ice loss in the Arctic has also increased wave heights over the period 1992–2014 (medium confidence).
A3.6 Anthropogenic climate change has increased observed precipitation (medium confidence), winds (low confidence), and extreme sea level events (high confidence) associated with some tropical cyclones, which has increased intensity of multiple extreme events and associated cascading impacts (high confidence). Anthropogenic climate change may have contributed to a poleward migration of maximum tropical cyclone intensity in the western North Pacific in recent decades related to anthropogenically-forced tropical expansion (low confidence). There is emerging evidence for an increase in annual global proportion of Category 4 or 5 tropical cyclones in recent decades (low confidence).
B3. Sea level continues to rise at an increasing rate. Extreme sea level events that are historically rare (once per century in the recent past) are projected to occur frequently (at least once per year) at many locations by 2050 in all RCP scenarios, especially in tropical regions (high confidence). The increasing frequency of high water levels can have severe impacts in many locations depending on exposure (high confidence). Sea level rise is projected to continue beyond 2100 in all RCP scenarios. For a high emissions scenario (RCP8.5), projections of global sea level rise by 2100 are greater than in AR5 due to a larger contribution from the Antarctic Ice Sheet (medium confidence). In coming centuries under RCP8.5, sea level rise is projected to exceed rates of several centimetres per year resulting in multi-metre rise (medium confidence), while for RCP2.6 sea level rise is projected to be limited to around 1m in 2300 (low confidence). Extreme sea levels and coastal hazards will be exacerbated by projected increases in tropical cyclone intensity and precipitation (high confidence). Projected changes in waves and tides vary locally in whether they amplify or ameliorate these hazards (medium confidence).
B3.1 The global mean sea level (GMSL) rise under RCP2.6 is projected to be 0.39 m (0.26–0.53 m, likely range) for the period 2081–2100, and 0.43 m (0.29–0.59 m, likely range) in 2100 with respect to 1986–2005. For RCP8.5, the corresponding GMSL rise is 0.71 m (0.51–0.92 m, likely range) for 2081–2100 and 0.84 m (0.61–1.10 m, likely range) in 2100. Mean sea level rise projections are higher by 0.1 m compared to AR5 under RCP8.5 in 2100, and the likely range extends beyond 1 m in 2100 due to a larger projected ice loss from the Antarctic Ice Sheet (medium confidence). The uncertainty at the end of the century is mainly determined by the ice sheets, especially in Antarctica.
B3.2 Sea level projections show regional differences around GMSL. Processes not driven by recent climate change, such as local subsidence caused by natural processes and human activities, are important to relative sea level changes at the coast (high confidence). While the relative importance of climate-driven sea level rise is projected to increase over time, local processes need to be considered for projections and impacts of sea level (high confidence).
Projected Changes and Risks
B3.3 The rate of global mean sea level rise is projected to reach 15 mm yr–1 (10–20 mm yr–1, likely range) under RCP8.5 in 2100, and to exceed several centimetres per year in the 22nd century. Under RCP2.6, the rate is projected to reach 4 mm yr-1 (2–6 mm yr–1, likely range) in 2100. Model studies indicate multi-meter rise in sea level by 2300 (2.3–5.4 m for RCP8.5 and 0.6–1.07 m under RCP2.6) (low confidence), indicating the importance of reduced emissions for limiting sea level rise. Processes controlling the timing of future ice-shelf loss and the extent of ice sheet instabilities could increase Antarctica’s contribution to sea level rise to values substantially higher than the likely range on century and longer time-scales (low confidence). Considering the consequences of sea level rise that a collapse of parts of the Antarctic Ice Sheet entails, this high impact risk merits attention.B3.4 Global mean sea level rise will cause the frequency of extreme sea level events at most locations to increase. Local sea levels that historically occurred once per century (historical centennial events) are projected to occur at least annually at most locations by 2100 under all RCP scenarios (high confidence). Many low-lying megacities and small islands (including SIDS) are projected to experience historical centennial events at least annually by 2050 under RCP2.6, RCP4.5 and RCP8.5. The year when the historical centennial event becomes an annual event in the mid-latitudes occurs soonest in RCP8.5, next in RCP4.5 and latest in RCP2.6. The increasing frequency of high water levels can have severe impacts in many locations depending on the level of exposure (high confidence).
B3.5 Significant wave heights (the average height from trough to crest of the highest one-third of waves) are projected to increase across the Southern Ocean and tropical eastern Pacific (high confidence) and Baltic Sea (medium confidence) and decrease over the North Atlantic and Mediterranean Sea under RCP8.5 (high confidence). Coastal tidal amplitudes and patterns are projected to change due to sea level rise and coastal adaptation measures (very likely). Projected changes in waves arising from changes in weather patterns, and changes in tides due to sea level rise, can locally enhance or ameliorate coastal hazards (medium confidence).
B3.6 The average intensity of tropical cyclones, the proportion of Category 4 and 5 tropical cyclones and the associated average precipitation rates are projected to increase for a 2°C global temperature rise above any baseline period (medium confidence). Rising mean sea levels will contribute to higher extreme sea levels associated with tropical cyclones (very high confidence). Coastal hazards will be exacerbated by an increase in the average intensity, magnitude of storm surge and precipitation rates of tropical cyclones. There are greater increases projected under RCP8.5 than under RCP2.6 from around mid-century to 2100 (medium confidence). There is low confidence in changes in the future frequency of tropical cyclones at the global scale.
Challenges
C3. Coastal communities face challenging choices in crafting context-specific and integrated responses to sea level rise that balance costs, benefits and trade-offs of available options and that can be adjusted over time (high confidence). All types of options, including protection, accommodation, ecosystem-based adaptation, coastal advance and retreat, wherever possible, can play important roles in such integrated responses (high confidence).C3.1. The higher the sea levels rise, the more challenging is coastal protection, mainly due to economic, financial and social barriers rather than due to technical limits (high confidence). In the coming decades, reducing local drivers of exposure and vulnerability such as coastal urbanization and human-induced subsidence constitute effective responses (high confidence). Where space is limited, and the value of exposed assets is high (e.g., in cities), hard protection (e.g., dikes) is likely to be a cost-efficient response option during the 21st century taking into account the specifics of the context (high confidence), but resource-limited areas may not be able to afford such investments. Where space is available, ecosystem-based adaptation can reduce coastal risk and provide multiple other benefits such as carbon storage, improved water quality, biodiversity conservation and livelihood support (medium confidence).
C3.2 Some coastal accommodation measures, such as early warning systems and flood-proofing of buildings, are often both low cost and highly cost-efficient under current sea levels (high confidence). Under projected sea level rise and increase in coastal hazards some of these measures become less effective unless combined with other measures (high confidence). All types of options, including protection, accommodation, ecosystem-based adaptation, coastal advance and planned relocation, if alternative localities are available, can play important roles in such integrated responses (high confidence). Where the community affected is small, or in the aftermath of a disaster, reducing risk by coastal planned relocations is worth considering if safe alternative localities are available. Such planned relocation can be socially, culturally, financially and politically constrained (very high confidence).
C3.3 Responses to sea-level rise and associated risk reduction present society with profound governance challenges, resulting from the uncertainty about the magnitude and rate of future sea level rise, vexing trade-offs between societal goals (e.g., safety, conservation, economic development, intra- and inter-generational equity), limited resources, and conflicting interests and values among diverse stakeholders (high confidence). These challenges can be eased using locally appropriate combinations of decision analysis, land-use planning, public participation, diverse knowledge systems and conflict resolution approaches that are adjusted over time as circumstances change (high confidence).
C3.4 Despite the large uncertainties about the magnitude and rate of post 2050 sea level rise, many coastal decisions with time horizons of decades to over a century are being made now (e.g., critical infrastructure, coastal protection works, city planning) and can be improved by taking relative sea-level rise into account, favouring flexible responses (i.e., those that can be adapted over time) supported by monitoring systems for early warning signals, periodically adjusting decisions (i.e., adaptive decision making), using robust decision-making approaches, expert judgement, scenario-building, and multiple knowledge systems (high confidence). The sea level rise range that needs to be considered for planning and implementing coastal responses depends on the risk tolerance of stakeholders. Stakeholders with higher risk tolerance (e.g., those planning for investments that can be very easily adapted to unforeseen conditions) often prefer to use the likely range of projections, while stakeholders with a lower risk tolerance (e.g., those deciding on critical infrastructure) also consider global and local mean sea level above the upper end of the likely range (globally 1.1 m under RCP8.5 by 2100) and from methods characterised by lower confidence such as from expert elicitation.
To sum:
1. Global sea levels continue to rise, with the rise itself accelerating (due to an acceleration in land-based ice sheet mass losses). This will continue, for beyond the lifespans of any now alive.
2. Beware of the eyecrometer. It will deceive you, if you allow it to.

SLR Components, from Cazenave et al 2018
- Climate Scientist reacts to Donald Trump's climate comments
MA Rodger at 06:17 AM on 26 November, 2019prove we are smart @21,
The muppet in the video simply combines a number of weak or falacious argument to support his grand "there is no AGW" delusion.
The first bit of it is feeding off this weblog at denialist site http://joannenova.com.au. There are genuine reasons for adjusting temperature data but the usual nonsense from denialists is that such adjustments are fake, or at least they are fake when the raw data is more favourble to their delusions.
The Mayor of Glen Innes featured in the denialist video says nothing about what data is used to establish AGW. I'm sure if the number of +40ºC daily maximums was how to measure AGW, we would have debunked that particular denialist argument many times before.
The Glen Innes Annual Max data for the period 1907-2012 doesn't show any significant warming trend, although when combined with the Annual Min data, the Annual Average data 1907-2012 does. And over the period 1975-2012 the Average data is running at +0.15ºC/decade although the noise reduces the statistical significance (+/- 0.12ºC/decade at 2sd). The Annual Max also shows a reasonable warming trend but the noise makes it statistically insignificant at 2sd +0.12ºC(+/-0.21)/decade.
And the various reports of cold winters are not incompatible with AGW although it is wise not to listen to other swivel-eyed climate deniers unless you are happy broadcasting fake news. So the blather about a cold winter ahead for the UK is nought but blather. "Claims that the UK is set to face the chillest winter in a century and even a white Christmas have been dismissed by the Met Office."
And arguing against a swivel-eyed loon in full flow isn't for the faint hearted. Unless you have history with the guy, or you can succinctly debunk his nonsense, I would suggest you let this Rowan Dean make a fool of himself. He appears not to always be careful with what he spouts. For instance, I see last year that he proclaimed that "A growing number of scientists now believe solar activity is the real culprit behind so-called climate change." This is the sort of nosense that can be addressed assertively. "A growing number of scientists"? What are their names? Put up or shut up!!
- 2019 SkS Weekly Climate Change & Global Warming News Roundup #27
MA Rodger at 19:08 PM on 26 July, 2019billev @30 &33,
I would agree with fellow commenters that you are demonstrating ignorance but perhaps we can rectify that situation.
Your assertion @30 that you see "no correlation between the periods of pause in temperature rise and EL Nino activity" would be reasonable if you could find your way to making clear which "periods of pause in temperature rise" you are referring to. We know you will be using NOAA data (although that is not of any significance) and will be considering only post-1959 data. And pretty-much all of that period sees global temperature "pauses" resulting from ENSO or volcanic activity, as per the Foster & Rahmstorf (2011) adjustments described @32.
The remainder of you comment @30 and the entirety of that @33 concerns IR transmission through the atmosphere. Your questions @30 are rather poorly framed. The amount of IR emitted by the surface that is absorbed within five feet will depend on the wavelength. In the 15 µm band absorbed by CO2 (which is a significant portion of the whole) 100% would be absorbed but then quickly re-emitted. Again it would be re-absorbed after a short distance. This in itself would make no significant difference to the temperature measurements or indeed the temperature as the energy does not hang about, it being very quickly re-emitted another small distance (up, down or sideways) where it will again be absorbed/re-emitted and on and on. The impact on temperature is trivial. (You will perhaps note that this is not the nub of the AGW mechanism.)
@33 you reference the "U.S. weather service." @26 you also mentioned this was a source of data you were referring to but I fear you are probably mis-citing the US Standard Atmopsphere (presumably the 1976 version) which is the work of NOAA, NASA & USAF. Can you provide your reference as in the circumstance it is good to be clear exactly what you are talking about.
Your major point @33 is that the abilities of "aircraft equipped with IR detection equipment" somehow is not compatable with the existence of a a greenhouse effect. You may find the responses @34 &35 a bit too involved. Very simply put, IR 'thermography' uses shorter IR wavelengths than the 15 micron band that is absorbed by CO2 and gives us AGW, shorter wavelengths where the atmosphere is less opaque. (These wave bands are often called 'windows'.)
- Freedom of Information (FOI) requests were ignored
Daniel Bailey at 00:21 AM on 11 March, 20191. Satellite sensors measure brightness, not temperatures. Temperatures can be inferred from brightness, but there are numerous "corrections" and "adjustments" to the raw data that must take place prior to these inferred numbers being considered reliable. The corrections to the satellite data vastly outweigh the minor changes to the surface station data during the homogenization process.
2. Data series span multiple generations of orbital platforms. A tremendous amount of "corrections" and "adjustments" to the data are needed for these time series to become long enough to achieve statistical significance.
3. The one data channel that some favor among all the satellite data channels is that of the TLT. This is nominally of the lower troposphere. The TLT channel is a synthetic (derived) product, and not a measured product. Further, it is not a measurement of the surface (where people live), but of the lower troposphere (where airplanes fly). Thus, it CANNOT be used to compare to surface temperatures.
4. The known uncertainties in the satellite trend, as estimated by the record providers, are five times the known uncertainties in the thermometer record trend.
5. Thermometer measurements from ground-based and radiosonde instrument packages are still the gold standard. Note that the radiosonde temperature series goes back to 1958, so it's a longer and more robust series than is the satellite record. It shows continued warming of the lower troposphere.
In summary:
1. Satellites don't measure temperatures, they measure brightness
2. Satellites don't measure the surface temperatures, where people live
3. Satellites measure brightness of the air thousands of feet above the surface, where birds and airplanes fly
4. Satellites convert brightness to temperatures via computer models
5. The known uncertainties in the satellite trend, as estimated by the record providers, are five times the known uncertainties in the thermometer record trend. - New research, February 4-10, 2019
Eclectic at 19:57 PM on 2 March, 2019Nowhearthis @30 [and prior] :-
<" still haven't gotten a response to my original question "> (unquote)
Nowhearthis: there is no possible answer to your question because (as you were already aware) the simple truth is that there is no AGW problem.
You were quite right all along. I consulted the gurus and pundits at the WattsUpWithThat website [the world's most viewed site on global warming and climate change] and I was assured that there is no AGW and thus no AGW problem at all for you to worry about. The WUWT article authors and the many posters in the comments columns, were almost unanimous that CO2 has no effect on world temperature.
~ Because there is no empirical evidence of CO2 greenhouse action : no confirmed reproducible experimental or observational evidence whatsoever.
** Some of the pundits proved that there has been absolutely no statistically-significant warming in the past 50 years (suggestion to the contrary by 99.9% of climate scientists, is due to the scientists' corruption incompetence and conspiratorial hoaxing and shameless data adjustment).
** Other pundits, less sanguine, proved that the borderline slight warming was nothing more than a cyclical Natural Variation deriving from a 60-year oceanic cycle; or a 1000-year oceanic cycle (separately or combined with sundry other oceanic cycles +/- a stadium wave).
** Still other pundits posited that the very slight warming was occurring primarily because the Earth's disk had become slightly less oblique to the sun's rays (this obliquity following a multi-decadal sine wave variation ~ and very fortunately cyclic, because otherwise at a super-maximum obliquity . . . everything would fall off the lower edge of the disk).
So . . . no problemo ;-)
- Fritz Vahrenholt - Duped on Climate Change
scaddenp at 08:45 AM on 27 February, 2019"So how does one determine who's fudging the data and who is not? "
Good question especially if you want an answer other than "whichever suits my biases". I am not sure what you mean by a dataset that "backs the skeptic case" (I dont think such a thing exists), but some criteria to look at:
1/ is it peer-reviewed? Any amount of nonsense put out by those who aim to deceive but these could not make it publication is a proper peer-reviewed journal.
2/ What does IPCC reports have to say on it - noting that the review process for IPCC has to be the most rigorous and open I have ever heard of. (You can see who said what and what the final editors judgement was and why).
3/ What is the consensus scientific position - ie what is assumed by experts working in the field?
4/ And if you dont like any of those, then you need to a/ get yourself the appropriate domain knowledge for assessment and b/ apply the disciplines of critical thinking that go into scientific evaluation.
There are plenty of threads here about deniers accusations of fraud. People are happy to help you evaluate the validity of arguments.
"Fudging the data" is an accusation of fraud. Anyone actually doing that would become pariah in scientific community. When there are numerous groups of scientists of all political associations working in many different countries, the chances for fraud are pretty minimal. What is usually objected to is the routine adjustments to homogenize, remove bias, or remove noise to various datasets. In this dialogue, anything that results in increased warming is "fudging the data". Anything that decreases it (eg the historical SST adjustment which is biggest change to temperature data) is good science. The better way to evaluate the adjustments is to ask "why is it being done", "is the methodology valid" and "how is it validated". Plenty of resource here to help. I dont think unadjusted data sets help the skeptic cause either unless they cherry pick (usually short intervals or particular regions).
Perhaps you first step would be to identify what skeptic resource you think is most convincing and find the appropriate thread here on it to comment further.
- Freedom of Information (FOI) requests were ignored
Daniel Bailey at 09:45 AM on 26 December, 2018Actually, pretty much all of the data (raw or otherwise) and model code is openly available.
The raw data:
ftp://ftp.ncdc.noaa.gov/pub/data/ghcn/v2
ftp://ftp.ncdc.noaa.gov/pub/data/ushcn/
ftp://ftp.ncdc.noaa.gov/pub/data/ushcn/v2/monthly/
http://dss.ucar.edu/datasets/ds570.0/
http://www.antarctica.ac.uk/met/READER
http://eca.knmi.nl/
http://www.zamg.ac.at/histalp/content/view/35/1
http://amsu.cira.colostate.edu/
Link to SORCE
http://daac.gsfc.nasa.gov/atdd
http://oceancolor.gsfc.nasa.gov/
http://www.psmsl.org/
http://wgms.ch/
http://www.argo.net/
http://icoads.noaa.gov/
http://aeronet.gsfc.nasa.gov/
http://aoncadis.ucar.edu/home.htm
http://climexp.knmi.nl/start.cgi?someone@somewhere
http://dapper.pmel.noaa.gov/dchart/
http://ingrid.ldgo.columbia.edu/
http://daac.gsfc.nasa.gov/giovanni/
http://www.pacificclimate.org/tools/select
http://gcmd.nasa.gov/
http://www.clivar.org/data/global.php
http://www.ncdc.noaa.gov/oa/ncdc.html
http://www.ipcc-data.org/maps/
http://climatedataguide.ucar.edu/
http://cdiac.ornl.gov/
http://www.cru.uea.ac.uk/cru/data/
http://www.hadobs.org/Next, the processed data:
http://data.giss.nasa.gov/gistemp
http://clearclimatecode.org/
http://hadobs.metoffice.com/hadcrut4/index.html
http://www.ncdc.noaa.gov/cmb-faq/anomalies.php#anomalies
http://ds.data.jma.go.jp/tcc/tcc/products/gwp/temp/ann_wld.html
http://www.berkeleyearth.org/
http://vortex.nsstc.uah.edu/data/msu/
http://www.ssmi.com/msu/msu_data_description.html
http://www.star.nesdis.noaa.gov/smcd/emb/mscat/mscatmain.htm
ftp://eclipse.ncdc.noaa.gov/pub/OI-daily-v2/
http://www.cpc.noaa.gov/products/stratosphere/temperature/
http://arctic.atmos.uiuc.edu/cryosphere/
http://nsidc.org/data/seaice_index/
http://www.ijis.iarc.uaf.edu/en/home/seaice_extent.htm
https://seaice.uni-bremen.de/sea-ice-concentration/
http://arctic-roos.org/
http://ocean.dmi.dk/arctic/icecover.uk.php
http://www.univie.ac.at/theoret-met/research/raobcore/
http://hadobs.metoffice.com/hadat/
http://weather.uwyo.edu/upperair/sounding.html
http://www.ncdc.noaa.gov/oa/climate/ratpac/
http://www.ccrc.unsw.edu.au/staff/profiles/sherwood/radproj/index.html
http://cdiac.ornl.gov/trends/temp/sterin/sterin.html
http://cdiac.ornl.gov/trends/temp/angell/angell.html
http://isccp.giss.nasa.gov/products/onlineData.html
http://eosweb.larc.nasa.gov/project/ceres/table_ceres.html
http://sealevel.colorado.edu/
http://ibis.grdl.noaa.gov/SAT/SeaLevelRise/index.php
http://dataipsl.ipsl.jussieu.fr/AEROCOM/
http://gacp.giss.nasa.gov/
http://www.esrl.noaa.gov/gmd/aggi/
http://www.esrl.noaa.gov/gmd/ccgg/trends/
http://gaw.kishou.go.jp/wdcgg/
http://airs.jpl.nasa.gov/AIRS_CO2_Data/
http://www.usap-data.org/entry/NSF-ANT04-40414/2009-09-12_11-10-10/
http://climate.rutgers.edu/snowcover/index.php
http://glims.colorado.edu/glacierdata/
http://www.nodc.noaa.gov/OC5/3M_HEAT_CONTENT/
http://oceans.pmel.noaa.gov/
http://cdiac.ornl.gov/oceans/
http://gosic.org/ios/MATRICES/ECV/ecv-matrix.htm
http://www.ncdc.noaa.gov/bams-state-of-the-climate/2009-time-series/Now, the model code:
http://www.giss.nasa.gov/tools/modelE/
ftp://ftp.giss.nasa.gov/pub/modelE/
http://simplex.giss.nasa.gov/snapshots/
http://www.cesm.ucar.edu/models/
http://www.ccsm.ucar.edu/
http://www.ccsm.ucar.edu/models/ccsm3.0/
http://www.cgd.ucar.edu/cms/ccm3/source.shtml
http://edgcm.columbia.edu/
http://www.mi.uni-hamburg.de/Projekte.209.0.html?&L=3
http://www.mi.uni-hamburg.de/SAM.6074.0.html?&L=3
http://www.mi.uni-hamburg.de/PUMA.215.0.html?&L=3
http://www.mi.uni-hamburg.de/Planet-Simul.216.0.html?&L=3
http://www.nemo-ocean.eu/
http://www.gfdl.noaa.gov/fms
http://mitgcm.org/
https://github.com/E3SM-Project
http://rtweb.aer.com/rrtm_frame.html
http://www.sciencemag.org/cgi/content/full/317/5846/1866d/DC1
http://www.pnas.org/content/suppl/2009/12/07/0907765106.DCSupplemental
http://geoflop.uchicago.edu/forecast/docs/Projects/modtran.html
http://geoflop.uchicago.edu/forecast/docs/models.html
http://www.fnu.zmaw.de/FUND.5679.0.html
http://www.pbl.nl/en/themasites/fair/index.html
http://nordhaus.econ.yale.edu/DICE2007.htm
http://nordhaus.econ.yale.edu/RICEModelDiscussionasofSeptember30.htm
https://github.com/rodrigo-caballero/CliMT
http://climdyn.misu.su.se/climt/
http://starship.python.net/crew/jsaenz/pyclimate/
http://www-pcmdi.llnl.gov/software-portal/cdat
http://www.gps.caltech.edu/~tapio/imputation
http://holocene.meteo.psu.edu/Mann/tools/MTM-SVD/
http://www.atmos.ucla.edu/tcd/ssa/
http://holocene.meteo.psu.edu/Mann/tools/MTM-RED/
http://www.cgd.ucar.edu/cas/wigley/magicc/Source code for GISTEMP is here:
https://data.giss.nasa.gov/gistemp/sources_v3/
https://data.giss.nasa.gov/gistemp/news/
https://data.giss.nasa.gov/gistemp/faq/
https://data.giss.nasa.gov/gistemp/
https://simplex.giss.nasa.gov/snapshots/Related links:
https://data.giss.nasa.gov/gistemp/faq/
https://data.giss.nasa.gov/gistemp/faq/#q209
https://podaac.jpl.nasa.gov/
https://daac.gsfc.nasa.gov/
https://earthdata.nasa.gov/about/daacs
http://www.wmo.int/pages/prog/wcp/wcdmp/index_en.php
http://berkeleyearth.org/summary-of-findings/
http://berkeleyearth.org/faq/
https://www.climate.gov/news-features/understanding-climate/climate-change-global-temperature
https://www.climate.gov/maps-data/primer/climate-data-primer
https://www.ncdc.noaa.gov/monitoring-references/faq/anomalies.php
https://www.ncdc.noaa.gov/ghcnm/v3.php?section=quality_assurance
https://www.ncdc.noaa.gov/ghcnm/v3.php?section=homogeneity_adjustment
https://www.ncdc.noaa.gov/crn/
https://www.ncdc.noaa.gov/crn/measurements.html
https://agupubs.onlinelibrary.wiley.com/doi/full/10.1029/2009JD013094
https://agupubs.onlinelibrary.wiley.com/doi/full/10.1029/2011JD016761
https://agupubs.onlinelibrary.wiley.com/doi/full/10.1002/2015GL067640
https://www.clim-past.net/8/89/2012/
https://www.carbonbrief.org/explainer-how-data-adjustments-affect-global-temperature-recordsGlobal surface temperature records use station temperature data for long-term climate studies. For station data to be useful for these studies, it is essential that measurements are consistent in where, how and when they were taken. Jumps unrelated to temperature, introduced by station moves or equipment updates, need to be eliminated. The current procedure also applies an automated system that uses systematic comparisons with neighboring stations to deal with artificial changes, which ensures that the Urban Heat Island effect is not influencing the temperature trends. In the same fashion that a chef turns raw ingredients into a fine meal, scientists turn raw data into a highly accurate and reliable long-term temperature record.
Although adjustments to land temperature data do have larger consequences in certain regions, such as in the United States and Africa, these tend to average out in the global land surface record.
- SkS Analogy 11 - Cabinets, airplanes, and frame of reference
Evan at 05:22 AM on 5 May, 2018rocketeer @12
Perhaps the other issue is that many simply don't realize how sensitive the atmosphere is. I had an adult tell me, "You mean we humans can affect a planet that has been here for 4.5 billion years?" As if age implied stability (at least it does not in the case of humans), and as if our actions were small. Eat 10% more calories than is recommended (i.e., 2200 instead of 2000/day) and your body can adapt and handle it. And the rate at which you eat the extra calories does not matter too much. But increase the temperature of the Earth by 10% (use whatever baseline you prefer), and the atmosphere and other environments go through a huge readjustment. The atmosphere within which we live is simply a sensitive system, and many people don't get that, because there is a time lag between our actions and the response.
Your reference to small changes in body temperature having big effects is perhaps the best example of a sensitive system to which we can identify.
- There's no correlation between CO2 and temperature
MA Rodger at 05:52 AM on 8 February, 2018NorrisM @178.
You are famously confused, so you better concentrate.
The recent BEST & GISS global temperature anomalies are in close agreement, their maximum annual values (2016) within 0.02ºC of each other. So the bulk of the 0.2ºC discrapency will likely be due to the other end of the record.
There are a couple of other factors which cancel each other out. Here in this thread you will note I was using 'period-maximums' (which thus includes 2016) but the 'Empirical evidence that humans are causing global warming' comment was using BEST 'period-average' values (1850-1935) to align the BEST data with the Loehle & McCulloch data (covering 11,700BC-1935AD with their zero equal to their full 'period-average'). Not using 'period-maximums' increases the measure of rise-in-temperature-since-pre-industrial by about 0.1ºC, but this is canceled out by the re-basing to the Holocene 'period-average' which is warmer than pre-industrial by a similar amount.
At the early end of the two temperature records, there is more of a discrepancy between BEST & GISS (with BEST -0.17ºC cooler than its GISS equivalent) which, coupled with BEST extending back to 1850 with even lower temperatures, this providing adjustments that tot-up to the bulk of the extra +0.2ºC above the zero to yield +1.2ºC on the Loehle & McCulloch graph.
- CO2 limits won't cool the planet
MA Rodger at 20:36 PM on 3 January, 2018Aaron Davis @32.
You suggest "it may possible a 15 ppm seasonal variation between Arctic CO2 concentration could also be significant. " A look at the lower graph @19 suggests the Arctic experiences an effective 8ppm drop in CO2 over a six month period. In terms of long-term energy budgets that is equal to 4ppm permanently. As the cycle would have existed before AGW (being a natural phenomenon), such a reduction in CO2 globally would amount to a temperature change of 0.04ºC with today's CO2 level & ECS=3. (As you appear to grasp the concept, I here adjust for the logarithmic nature of CO2 forcing.) Due to the increase in CO2 since 1979, today's 0.04ºC has reduced from 1979's 0.05ºC.
The problem we face Aaron Davis is that this 0.04ºC (which will require some adjustment as it is not global) is not what you are attempting to measure.
Consider the following.
A row of seven stout wooden chalets are heated by identical electric fires 24-7-365. But an electrical fault results in all chalets losing power for a portion of the time. In the first chalet it is 1 millisecond every six milliseconds, in the second it is 1 second every six, in the third one minute in six, then one hour in six, one day in six, one month in six, one year i six.
On average, each chalet suffers the same loss of power and they will all experience a roughly similar drop in average long-term temperature. Losing one sixth of their heating, that drop is significant and is analagous to what you suggest @32 is considered as "could also be significant."
However, this long-term average is not what you attempt to measure. You are concerned with the wobble in temperature. In our analogy, the wobble will vary greatly chalet-to-chalet. In chalet one it will be undetectable. In chalet six, the temperature will wobble from that of an unheated chalet to that of a fully heated chalet. Using a 15ppm value, your calculation will be perhaps as chalet three. But you are expecting it to be chalet six or seven.
And your numbers "the 0.54/ to 1.2oC/ due to doubling CO2" appear to be nonsensical.
- CO2 limits won't cool the planet
MA Rodger at 04:10 AM on 27 December, 2017Aaron Davis @3,
Whilst being off topic, it is probably appropriate to address here the deficiencies in your "facts" analysis.
The level of CO2 in the terrestrial atmosphere is today about 620 ppm by weight or 0.062%. Martian CO2 levels are perhaps 98% by weight. These are the figures that should be used if you wish to calculate kg of CO2, rather than your ppm-by-volume values. With the Martian atmosphere 0.6% the pressure of the terrestrial atmosphere and gravity 38%, the number of CO2 molecules a photon has to negotiate within the Martian atmosphere, relative to the terrestrian one, is thus about 25 times, or there abouts.However, the direct comparison of Martial temperatures with terrestrial ones is dependent on more than just the presence of GHGs. As a first approximation, Mars is 151% further from the sun than Earth but has 82% of the albedo, so Earth absorbs 1.51^2 x 0.82 = 187% (1/53%) more warming. If we accept the widely quoted average terrestrial temperture of 288 K and GHG effect of 33 K, the non-GHG temperatures would be 255 K for Earth and 218 K for Mars.
The comparison of noon-day equatorial temperatures on Earth & Mars is a poor measure of global temperature given the terrestrial diurnal range is perhaps 10 K (or less at Manta )while the Martial equivalent diurnal range has been measured at 125 K. Even in the middle of the Sahara Desert, far from the moderating effect of oceans and with H20 and cloud greatly reduced, the terrestrial dirurnal range is shown as 15 K, a level of magnitude smaller than for Mars.
A fuller account is perhaps required. The actual average Martian temperature is still not accurately measured. Results from modelling variously quote values roughly 218 K suggesting a minimal Martian GHG effect, and even the surface temperature lower than the effective radiative temperature (Covey et al 2012), although only when simplistically calculated (Haberle 2012). The 25 times Martian CO2 levels should not be seen as providing a large GHG effect.
A simplisitc calculation for the direct CO2 impact on terrestrial climate CO2 levels increased 25 times today's would suggest (from 4.5 doublings) a direct temperature increase of 4.5 K to which should be added the CO2 contribution from today's CO2 levels. Today's full GHG effect is widely quoted as 33K and CO2 has been calculated would provide 26% of this in the absence of other GHGs (as the situation on Mars). Thus the 25x CO2 effect would total 4.5 + 8.6 = 13.1 K from a total of 58Wm^-2 forcing.
At first glance, this 13.1 K/58Wm^-2 GHG effect for the terrestrial atmosphere on Mars appears entirely absent. (The 218 K Martian temperature as a black body would roughly radiate equal to the Martian solar warming of 53% terrestrial as set out above.) However there are three adjustments required for such a finding.
Firstly, the effect occurs in a cooler climate with less radiation flying about. This reduces the warming to 12 K with 31Wm^-2 forcing when the total radiative spectrum is considered pro rata. There is further reduction as the radiation in the region impacted by CO2 is less significant overall at such temperatures. Thus the full less-radiation-about adjustemnt results in roughly 10 K with 26Wm^-2 forcing.
Secondly, the effectiveness of the GHG effect on Mars will not be equally efficient as on Earth. Indeed more serious calculations (eg Clive Best) suggest the thin and cold Martian atmosphere would be warmed by perhaps just 12 Wm^-2 of foring which calculates as just 4 k additional to a 218 K planet. (I assume the 2 K value set out by Clive Best is a a mistake.)
Thirdly, with no oceans and only a thin whispy atmosphere, a warming Mars has naff-all to heat up except the rocks (just like on the moon). So not only is there very little thermal mass in the atmosphere (1% of the terrestrial atmospheric thermal mass), Mars also lacks having two-thirds of the planet kept at a constant temperature throughout the diurnal cycle due to 4km-deep oceans. As a result, Martian day-time temperatures skyrocket and leak significant energy away as a result. And come night-time, temperatures plummet. The full night-time atmospheric temperature drop experienced in Earth over 12-hour is equalled in just 8 minutes on Mars. This is thus large diurnal range and is significant for the global average temperature as maintaining a constant temperature is radiatively more efficient than having big diurnal temperture ranges. The moon's diurnal range, for instance (although an extreme example with zero GHGs & month-long days) has an average temperature 50 K lower than the temperature that could be maintained as a black body with the same radiative losses (this calculated using the data presented in Williams et al (2017) Fig 9a ). On Mars, such 'radiative inefficiency' is much less but still bigger than the GHG effect of 4 K (seemingly) calculated by Clive Best.
Subject to any mistakes of my own, this accounts fully for the lack of GHG effect warming Mars apparent from simplistic analysis.
- No climate conspiracy: NOAA temperature adjustments bring data closer to pristine
scottfree1 at 02:56 AM on 7 December, 2017
"The adjustments are scientifically necessary"
But are they actually science?
When the hypothesis is not supported by the data you change the hypothesis NOT the data.So lets look at the 34 (yes 34) "official" Nasa/Giss temperature records issued between 1998-2011. In this "unbiased" purely "scientific" process of "correcting" temp data you might expect near 50/50 distribution of +/- adjustments? Well, not so much, of the 34 adjustments 33 raised current temps and lowered historical temps. The odds of 33 to 1 distribution? A most reeasonable and unbiased 1 in 505,300,000 or 20x worse than hitting the super lotto..
- New rebuttal to the myth 'climate scientists are in it for the money' courtesy of Katharine Hayhoe
nigelj at 07:30 AM on 24 November, 2017Climate scientists salary looks very ordinary, given the high level of education and solid contribution, more so than the so called contribution of some of the characters in the financial sector.( Refer to the book "Other Peoples Money' by John Kay). Not everyone is in things for the money, many people value job satisfaction, and choose lower paying jobs accordingly.
But I think the other issue not confronted in the video is an (erroneous) public perception with some nasty minded people scientists exaggerate warming to get governments worried so they get more research grants. This is just so ridiculous. Exaggerated or mistaken claims about warming come up against criticism form other scientists and future data trends and don't survive long. Recent temperatures have actually vindicated predictions made by climate modelling, so it's hard to find these so called exaggerated claims. It's also interesting that data adjustments to the global warming trend have actually adjusted temperatures down overall.
This all makes the attacks of denialists look increasingly unfounded, irrational, nasty, and desperate. They are reduced to making inane claims for example that climate scientists are communists! Its like medieval accusations of "you are a witch". Next there will be Spanish Inquisition of climate science, and a ritual burning of text books, and I'm not entirely kidding just looking at America right now. This is how stupid the whole thing is becoming. Humanity should be ashamed of its conduct, and stick to science and carefully prepared, reports like IPCC report.
- A Response to the “Data or Dogma?” hearing
grindupBaker at 09:47 AM on 12 November, 2017If I'm understanding the STAR microwave sounding unit (MSU/AMSU) onboard calibration procedure correctly, then it measures a different physical aspect of Earth's atmosphere than is measured by a thermometer (either liquid-expansion or platinum-resistance) and it measures a lesser physical aspect. The underlying reason for the difference is that there is no long-wave radiation (LWR) inside a solid such as a platinum-resistance thermometer. I've never heard a climate scientist mention this.
If the lower tropospheric (for example) atmosphere warms then there is an anomaly in these forms of energy:
- molecular kinetic energy (molecular translational energy, heat),
- LWR energy,
- molecular vibrational energy of the GHGs (primarily H2O in the gaseous form).The warm target in a MSU/AMSU is a solid blackbody whose temperature is measured by platinum resistance thermometers embedded in it. The microwave flux density from it is used to scale microwave flux density (thermal emission) from molecules (primarily oxygen) in the atmosphere. The issue I see is that this onboard calibration procedure causes the instrument to scale such that it measures only molecular kinetic energy (molecular translational energy, heat) in the atmosphere and excludes LWR energy and molecular vibrational energy of the GHGs in the atmosphere. This means that differentiation over time of this proxy measures only heat anomaly.
A liquid-expansion or platinum-resistance thermometer placed in the atmosphere at elevation 2m (for example) above ocean or land surface measures:
- molecular kinetic energy (molecular translational energy, heat) plus
- LWR energy plus
- molecular vibrational energy of the GHGs (primarily H2O in the gaseous form)
because LWR energy and molecular vibrational energy of the GHGs are transmuted to molecular kinetic energy (molecular translational energy, heat) upon impacting upon the molecules of the solid and I understand that there is no transverse electromagnetic radiation inside a solid. Placement of the thermometer inside an enclosure does not exclude the LWR energy and molecular vibrational energy of the GHGs due to GHG molecule collisions.Thus, differentiation over time of the liquid-expansion or platinum-resistance thermometer proxies for temperature measures the sum of all three anomalies but differentiation over time of the microwave flux density (thermal emission) from molecules (primarily oxygen) in the atmosphere at the example elevation of 2m measures only the molecular kinetic energy (molecular translational energy, heat) anomaly with the STAR microwave sounding unit (MSU/AMSU) onboard calibration procedure as described. In order for the MSU/AMSU to measure the same physical aspect as a liquid-expansion or platinum-resistance thermometer it would be necessary to calibrate with the warm target being atmospheric gases in close proximity to a solid whose temperature is measured by platinum-resistance thermometers, or a compensating adjustment could be made during analysis such as RSS and UAH based upon the ratio of LWR energy + molecular vibrational energy of GHGs to molecular kinetic energy in the atmosphere.
Please inform whether:
1) I'm misunderstanding the physics, or
2) I'm not including another aspect of STAR microwave sounding unit (MSU/AMSU) onboard calibration procedure that deals with this issue, or
3) A compensating adjustment for this is made during analysis such as RSS and UAH based upon the ratio of LWR + molecular vibrational energy of GHGs energy to molecular kinetic energy in the atmosphere, or
4) The ratio of LWR + molecular vibrational energy of GHGs energy to molecular kinetic energy in the atmosphere is so negligible (far less than uncertainties) that no compensating adjustment for it is required for analysis such as RSS and UAH.Thanks
- Climate's changed before
MA Rodger at 22:48 PM on 2 November, 2017cero @580,
I can see Kemp et al (2015) being drooled over by denialists. This would be because they misinterpret the paper which sadly misses out on saying explicitly things that are obvious in any genuine reading of the paper.
The idea that ancient warming episodes may have contained more rapid events within the actual warming, that the average rate of warming will inevitably be exceeded over shorter sections of that warming: this is logical. And when you are concerned how quickly, say, an oak forest habitat can shift polewards, those speedier intervals are relevant.
As Michael Sweet points out, we cannot (yet) measure such short accelerations from the available data so Kemp et al set out a new method to infer those increased levels. This is interesting stuff, and very early days, so it cannot be seen as entirely reliable. Consider the PETM which we know took millennia to occur. It was a gentle warming over a long period and would have had periods of increased and decreased rates of warming. Thus Kemp et al take central estimates for this event (5ºC to 9ºC = 7ºC, ~5ky to 20ky = 12.5 ky, this a rate of warming of 0.0006ºC/yr compared with recent rates of 0.015ºC/yr ) and adjust these to suggests a potential millennial rate of 0.0032ºC/yr or about half the PETM warming occurring in a single millennuim.
Other measured temperature rises are likewise adjusted. A 15ºC measured ocean warming over 800,000 years during the P-T (250My bp) is inferred to include a millennial period of at least 4.5ºC warming. (Potentially we could deduce a 9ºC warming over 2,000 years.) Or the Bølling-Allerød during the warming from the LGM (13,000yr bp) measured at 3ºC over 100 years is adjusted to equate to 2.2ºC over a millennia.
So I am on safe ground when I suggest that Kemp et al have not begin to capture the scale of that adjustment. They have set out a method that begins consideration of it.
But there is a missing aspect within the paper if it to be used to argue about the rate of AGW relative to previous non-anthropogenic warming. We are facing a temperature rise of 4ºC in a little over 100 years from unmitigated AGW. Such a rise would rival the magnitude of the largest millennial warming set out by Kemp et al. The caution Kemp et al say "must be exercised when describing recent temperature changes as unprecedented in the context of geological rates" does not apply to expected future unmitigated temperature changes.
- Climate and energy are becoming focal points in state political races
NorrisM at 17:24 PM on 22 October, 2017Bob Loblaw @ 143
I have been very impressed by your arguments generally (interesting to see two Canadians go at it). But this comment really distorts what I have said and sounds like some others which look for some "underlying preconceived notions".
A few examples:
"Just because you want to label uncertainties in these costs as "vague", "theoretical", etc. does not mean that the best estimate of these additional costs is $0."
I have never said that the best estimate of the additional costs is $0. What I have said is that you will not get the US, Europe or China onside to recognize this because of the costs to their particular society in imposing some carbon tax beyond pollution costs. Of course, the future costs are much more than the pure "pollution costs". But unless you have a very easy alternative (as to costs and viability), then you have to weigh the benefits of FF to the future costs. I have already indicated what I think should be a two-pronged approach.
"That you keep repeating shop-worn denier talking points about uncertainty, models, etc. suggests that at some deep level you are still believing or hoping that the science is all wrong and no significant change is needed."
Wrong. It has nothing to do with hoping the science is all wrong. I also do not thing the science is all wrong. But my concern with the models, especially after having read a very honest Chapter 9 of the IPCC 2013 Assessment during my recent holiday, is that I do not think that we have the ability to model, by computers, the complexities of the climate to a level that we can fully trust them. I am not saying that the models are useless, but when I read in the IPCC assessment that the models have been "tuned" to match reality in "hindcasts" (in ways not disclosed to the IPCC) then it raises serious questions as to the ability of models to predict the future 50 years from now and suggest that sea levels really will increase at rates much higher than present levels. I understand that any model would have to be adjusted in hindsight to input things like actual volcanic activity and actual El Ninos and other actual ocean oscillations but my sense is that with these "adjustments" we are not much better off than taking a ruler and projecting sea level and temperature rises based upon the last 25-50 years.
That is why I have found myself reverting to what is actually happening both as to average temperature increases and average sea level rises over X period of years. I think it is eminently reasonable to assume, in the absence of evidence to the contrary, that things will continue at the same rates as we have seen. We had a "hiatus" for a period of 12-15 years in average temperature rise but I am more than prepared to accept that this was a "blip" and that temperatures will continue to rise because the CO2 emissions continue.
At 71 years of age, I am not concerned about myself or my economic position. I am concerned about the world but I am, more than anything, a realist. I have two adult children who will have to live in this world (I actually worry that there are other things that are more dangerous to their future welfare than climate change). So when I advocate things, I take into account political realities together with a general skepticism that we as humans are apocalyptic. Just remember that climate scientists in the 1970's, or at least a fair number, were suggesting we were on our way to another mini ice age. I just do not think that we are about to go over Niagara Falls. We have some time to see if this really is a problem. For at least 25 years, we have been told we were going "over the cliff" (or over the waterfall) and it has not happened.
I am happy to deal with linear increases. If we find that "linear' is in fact wrong, then we deal with it. That is why I have been trying to sort out what the actual sea level rise has been for the last 25 years.
The other thing I have not mentioned is my question as to whether the CO2 emissions will be the same over the next 30 years with BAU as it has been for the last 30 years. China has taken massive steps using cheap coal to fuel its industrialization. Hopefully this will not go on for the next 30 years. Surely they will not again "double" their existing steel production. Clearly China will be using wind and solar (in conjunction with their existing coal plants) to mitigate their pollution costs. As I type this, it has occurred to me that China is not focussing on nuclear power. I have never heard this from any of the commentators but that is probably one of the best arguments that nuclear power does not make economic sense. If a planned economy like China has not moved to nuclear power (and the Chinese are no dummies) then there are reasons that argue for wind and solar in favour of nuclear (I still find this disappointing for our world - I saw some of the wind farms in Spain). For some they are pretty, but to me it is a sad commentary on what humans are doing to the world.
My point is that you misrepresent my concerns. They are not based upon some "head in the sand" approach. But at least I think you would agree that I am entitled to express my opinions and that I should not be shuffled off to jail or fined for expressing them.
- Carbon Dioxide the Dominant Control on Global Temperature and Sea Level Over the Last 40 Million Years
MA Rodger at 20:31 PM on 6 October, 2017citizenschallenge @89.
Having now read Lightfoot & Mamer (2017), I can report that it is total nonsense. It is not the first nonsense from these authors which include Lightfoot (2010) 'Nomenclature, Radiative Forcing and Temperature Projections in IPCC Climate Change 2007: The Physical Science Basis (AR4)' [ABRTRACT] and Lightfoot & Mamer (2014) 'Calculation of Atmospheric Radiative Forcing (Warming Effect) of Carbon Dioxide at Any Concentration ' [PDF], this last setting out much of the argument now presented in Lightfoot & Mamer (2017) (although strangely this ealrier work is unmentioned in the later). Yet the bold and revolutionary assertions on AGW within this earlier work have not set the world alight since publication, a telling result. Instead it has gone un-noticed into the oblivion of nonsense-filled literature.
And Lightfoot & Mamer (2017) will follow. It says nothing other than there is on average for any location and month much more H2O at the bottom of the atmsphere than there is CO2, and that the hotter the location/month the greater the disparity. They also arrive at the astounding finding that it is hotter in the tropics and in summer months than it is in the polar regions and winter. Further, they identify a general correlation (which they fail to actually calculate) between temperature and the angle of the sun up in the sky. (I recall noting in prevoius days that the sun is not static in the sky but appears to vary in angle through the day. Thinks - would this Lightfoot&Mamer correlation still hold for time-of-day?).
Lightfoot&Mamer fail to comprehend the concept Radiative Forcing (RF). They would greatly benefit from a quick read of UN IPCC AR5 Chapter 8 section 8.1 (which they do not cite in their paper) or a proper read of UN IPCC TAR Chapter 6 (which they do cite but somehow fail to understand). Not the least of this ignorance is their use of surface back-radiation as though it were RF when by definition RF concerns the imbalance at the tropopause (with adjustment for stratospheric influences) and has nothing to do with surface back-radiation.
"The radiative forcing of the surface-troposphere system due to the perturbation in or the introduction of an agent (say, a change in greenhouse gas concentrations) is the change in net (down minus up) irradiance (solar plus long-wave; in Wm-2) at the tropopause AFTER allowing for stratospheric temperatures to readjust to radiative equilibrium, but with surface and tropo-spheric temperatures and state held fixed at the unperturbed values." UN IPCC TAR (2001) Section 6.1.1
Their fraught calculations of the H2O/CO2 ratio do not apply to the tropopause. Their discussion concerns the properties of back-radiation which result from surface air temperature (SAT) but they rather overlook the physical mechanisms that maintain the SAT which are all to do with the atmosphere above, all the way up to the tropopause.
Whichever way you cut it, Lightfoot&Mamer(2017) is a rich vein of total nonsense.
- The Mail's censure shows which media outlets are biased on climate change
MA Rodger at 21:36 PM on 30 September, 2017nigelJ @39,
Note that within her spreading of doubt and denial about AGW, Curry is even happy to trash the temperature record. (This is perhaps odd as the temperature record is about the only thing she has to base her grand theory of there being a humongous natural climate wobble which has amplified the recent AGW over 1970-98 to create the present climate 'hysteria' with Wyatt's Unified Wave Theory being Judy's candidate for such an oscillation back in 2015.)Her stance in the temperature record is basically that 'there has been warming, but...' with the 'but' being followed by the buckets of doubt and denial. In many ways her comments about the temperature-record exemplifies her highly unscientific method. She will raises issues but almost always fails to set out clearly what she concludes from such issues. If she did, she would be slammed for promulgating serious denial with sky-high Monckton-ratings.
Consider her testemony about the temperature record in front of this 2015 Senate Committee:-
♠ Her citing of the hockeystick graph as showing "overall warming may have occurred for the past 300–400 years. Humans contributed little if anything to this early global warming," rather misrepresents the hockeystick. She is strongly suggesting that the possible 0.2ºC warming over a recent 300-year period (1600-1900) somehow brings into serious doubt the IPCC's attribution of the 1.2ºC warming since 1900.
♠ Her evidence on the relevance of the 'hiatus' never concludes. Rather it rambles on about "The growing discrepancy between climate model predictions and the observations", the raging debates over the recent Karl et al (2015), the 'hiatus' "clearly revealed" by satellite data (helpfully plotted by denialist Roy Spencer so the graph shows the now-superceded RSSv3.3 and the then-yet-to-be-released UAHv6.0 and with the RSS data re-based and curiously shorn of some of its maxs&mins and for good measure the graph stops short of the latest 2015 warmth), scientific disagreement over discrepancies between TLT & SAT records (and note where she stands on that with her oral testimony "we need to look at the satellite data. I mean, this is the best data that we have and is global"), convoluted statistical probability of 2015 becoming warmest-year-on-record, discrepancies amongst temperature data sets, a five years requirement to be sure the 'hiatus' has actually ended. It rambles on but the relevance of the 'hiatus', the message she is meant to be delivering, is never set out.
♠ Beyond her written testimony, Curry also expounds on SAT record adjustments, spreading yet more doubt:-"... And the adjustments, as you can see, are rather huge, OK?
So should we—so, to me, the error bars should really be much bigger if they are making such a large adjustment. So we really don’t know too much about what is going on in terms of, you know, it is a great deal of uncertainty. Yes, I do believe that we have overall been warming, but we have been warming for 200, maybe even 400 years, OK? And that is not caused by humans."After the digression onto the pet "warming for even 400 years,OK" Curry returns to adjustments but specifically ocean adjustments stating "I mean, the land datasets are sort of starting to agree, but there is a great deal of controversy and uncertainty right now in the treatment of the ocean temperatures." Poor Judy has failed to note that Chariman Cruz was asking for comment on USCHN data adjustments and her comment relevant to that data solely comprises "the land datasets are sort of starting to agree" and thus that the adjustments Cruz is complaining about are perfectly appropriate. Yet that is certainly not the take-away message she provides.
Curry gets away with talking this rubbish, even in written reports presented to a Senate Committe. She really should be taken to task for it.
- Right-wing media could not be more wrong about the 1.5°C carbon budget paper
gorgulak at 05:39 AM on 29 September, 2017Why is it that projecting out from the IPCC models gets you 70 GtC remaining whereas this new analysis gets you 200 GtC? From what I've read it seems like they haven't changed anything about the models but only adjusted them to todays temperature and emissions. You get 70 GtC if you project outward without adjustment, but the models have underestimated where we would be emissions-wise and slightly overestimated where we would be temperature-wise. So if you project outward from 545 GtC you're projecting out from the 2020's where the median of the models predicted we would be for emissions, which is also at a higher temperature and atmospheric co2 concentration. Is all of that right?
I understand that the actual difference between the models and observations is not 0.3 C but is much smaller. I'm just wondering how you get 3x more carbon budget while still projecting the same rates of warming and without a new "warming per tonne of co2 emitted". Is it simply the small adjustemnt to account for todays temperature and emissions that gets you that?
- 2017 SkS Weekly Climate Change & Global Warming News Roundup #38
NorrisM at 16:08 PM on 28 September, 2017Here is Ross McKitrick's analysis of the Millar et al paper that seems to have caused such a kerfuffle:
"Millar et al. attracted controversy for stating that climate models have shown too much warming in recent decades, even though others (including the IPCC) have said the same thing. Zeke Hausfather disputed this using an adjustment to model outputs developed by Cowtan et al. The combination of the adjustment and the recent El Nino creates a visual impression of coherence. But other measures not affected by the issues raised in Cowtan et al. support the existence of a warm bias in models. Gridcell extreme frequencies in CMIP5 models do not overlap with observations. And satellite-measured temperature trends in the lower troposphere run below the CMIP5 rates in the same way that the HadCRUT4 surface data do, including in the tropics. The model-observational discrepancy is real, and needs to be taken into account especially when using models for policy guidance."
This article, which can be referenced on the ClimateEtc Judith Curry website seems to be reasonably balanced. I first read it and thought that maybe the "overstatement of the models" was an overstatement. But .3C is a fair bit when we are talking about 1C since pre-industrial times.
I see that in fact the IPCC did acknowledge in 2013 that the models were predicting warming beyond observations. I took a look at their chart which is actually updated by McKitrick to reflect the 2016 El Nino. So this is why Ben Santer, in the APS 2014 panel review acknowledged that Christy's claim of a significant variance was "old news". At least it has now been acknowledged. Does not change the question as to what we should do about it.
On that point, I am still waiting for someone to respond to my question (on another stream) regarding the Jacobson 2015 study on wind and solar costs of replacing fossil fuels in the US by 2050. I have seen no criticism whatever by this website of the June 2017 paper of Clack (NOAA) et al published by the Proceedings of the National Academy of Sciences which has roundly criticized the Jacobson cost study to the point of questioning its validity.
- Temp record is unreliable
MA Rodger at 02:18 AM on 26 September, 2017randman @497.
♣ You ask "how do we know?" If you examine the LOTI documentation (linked @496) you will see it says "GLOBAL Land-Ocean Temperature Index in 0.01 degrees Celsius - base period: 1951-1980" And while it is fuzzed out past p1, Hansen & Lebedeff (1988) is but an update of Hansen & Lebedeff (1987) and that states "We obtain monthly temperature changes for a given subbox by applying the previously described procedure individually to each of the 12 months, with the zero point for each month being its 1951-1980 mean." So unless there is some ambiguity over the year numbering, it all sounds pretty "knowable".
♣ You ask "what is that base specifically in abolute temps?" I would quote you the comment from 1988 quoted in one of those NYT articles you have cited up-thread.
"How hot is the world now? The scientists do not offer a straightforward response, saying that the vast amount of data is still being studied and that comparisons cannot be precise."
If you insist on a reply, perhaps this NASA article will provide it. It states "For the global mean, the most trusted models produce a value of roughly 14°C, i.e. 57.2°F, but it may easily be anywhere between 56 and 58°F."
This of course is neither an exact answer nor the 59°F/15°C you have cited from a couple of NYT articles, but as I set out @478 above, the NYT 59°F value is almost certainly the result of the journalist (it is each time the same journalist) insisting on using an absolute temperature and effectively putting words into a climatologists mouth, words they do not object to. But it ain't science.
The Ts=288K you also cite (from Hansen et al 1981) is not applicable to any anomaly base. It is used for the same perpose that Callendar (1938) uses Ts=283k, to quantify the magnitude of the greenhouse effect. It has no association with any defined time-period.
♣ You state 1988 was "Same year he testified that the 1950-1980 mean was 59 degrees F." This I assume refers to Hansen's tesemony to US Senate Committee on Energy & Natural Resources 23/6/1988. This is not something I am familiar with but if Hansen does testify "that the 1950-1980 mean was 59 degrees F," it will require sharper eyes than mine to see it. Perhaps you can point to the page & paragraph.
♣ You will note that Hansen & Lebedeff (1987) tabulates the global anomaly record 1880-1985. I cut&pasted those numbers into a spreadsheet alongside todays GISTEMP LOTI 1880-2016. The resulting graph can be see here (usually 2 clicks to 'download your attachment'). There is significant difference between the 1980s record and today's but only pre-1940.
(Folk get obsessed with the impact such adjustments would have on the implied global warming by popping a LSR through the data. Such analysis 1880-1985 shows the 1980s data implies there has been a little more warming over the period than shown in the modern data, 0.54°C/century as opposed to 0.44°C/century.)
- Temp record is unreliable
MA Rodger at 19:15 PM on 25 September, 2017randman @494.
You ask of the global mean surface temperature: "why has it been adjusted downward?" The first step in answering that is to identify when it was adjusted downwards. You seem quite adamant that it had not yet been adjusted downwards in 1988.
With the preview version of Hansen & Lebedeff (1988) we can access the first page of this paper. This paper you argue is using the old 288K estimate for Ts and we can see the resulting global temperature record in Fig 1, from 1880 with an anomaly of -0.40ºC to 1987 with an anomaly of +0.33ºC.
Happily for us, the successor temperature record, NASA's GISTEMP LOTI, still uses the same 1951-1980 anomaly base. So by examining academic papers citing those LOTI anomalies, it will be easy-peasy lemon-squeezy to spot when this scurilous adjustment was carried out to pervert the climatical reocods of our planet. The adjustment will be very obvious as, with the adjusted anomaly base being calculated to have an average temperature 1ºC lower (14ºC instead of 15ºC), these global anomalies will be boosted upwards by +1ºC.
A quick look at the latest LOTI release we see that the 1880 anomaly has been adjusted from -0.40ºC to -0.20ºC and that the 1987 anomaly has been adjusted from +0.33ºC to +0.33ºC.
So when exactly was this GISTEMP LOTI adjustment performed?
- Temp record is unreliable
randman at 14:37 PM on 25 September, 2017So why would the Washington Post mention an absolute temperature and claim the NOAA does?
"The average temperature across the world’s land and ocean surfaces was 58.69 Fahrenheit, or 1.69 degrees above the 20th-century average of 57 degrees, NOAA declared. "
https://www.washingtonpost.com/news/energy-environment/wp/2017/01/18/u-s-scientists-officially-declare-2016-the-hottest-year-on-record-that-makes-three-in-a-row/?utm_term=.1a251a1f56ee
Note it is less than 59 degrees. So obviously if in the 80s people like Hanson and Jones believed the cumulative data indicated 59 degrees as the mean from 1950-1980, then there has been an adjustment in that data such that the NOAA can declare less than 59 degrees the hottest year ever since data has been collected.
Where is the explanation and peer-reviewed papers discussing that downward revision? - Temp record is unreliable
randman at 08:42 AM on 25 September, 2017Tom, this is the paper by Hansen with 288 Kelvin as the mean. I think you've already seen the press comments by Hansen and Jones in 1988 of 59 degrees F and "roughly 59 degrees" respectively, right?
LINK
Obviously regardless of looking at anomalies, there is a reason they believed the mean was 59 degrees. The fact climatologists like to look at anomalies does not change that, does it? Not seeing your point.
On a wider note, this appears to be a pattern. 15 degrees was later adjusted down to 14 degrees, which had the effect of making the then present temps appear warmer, whether correctly so or not.
More recently, we've seen satellite data that showed no sea level rise to speak of "adjusted", perhaps correctly so or not, to now show sea level rise.
http://www.nature.com/news/satellite-snafu-masked-true-sea-level-rise-for-decades-1.22312
Prior to that we saw the posited warming hiatus changed by some, which changes including lowering the past means among other things. One climatologists somewhat famously has complained about this, Judith Curry. Some of her comments here:
""This short paper in Science is not adequate to explain and explore the very large changes that have been made to the NOAA data set," she wrote. "The global surface temperature data sets are clearly a moving target. So while I'm sure this latest analysis from NOAA will be regarded as politically useful for the Obama Administration, I don't regard it as a particularly useful contribution to our scientific understanding of what is going on.""
http://news.nationalgeographic.com/2015/06/150604-hiatus-climate-warming-temperature-denier-NOAA/
https://judithcurry.com/2015/07/09/recent-hiatus-caused-by-decadal-shift-in-indo-pacific-heating-2/
As I understand it, Curry was a proponent of AGW and perhaps still is in some respect, but has had problems with the way the data has been adjusted and the accuracy of the models among other things.
She's not the only scientist raises these questions. So it's not just laymen like myself who wonder why there appears to be a pattern of data that does not line up with predictions simply being "adjusted." These adjustments are not just one-off things either but a fairly consistent feature here. - Temp record is unreliable
randman at 04:37 AM on 25 September, 2017Tom, where have you explained how the consensus mean from 1950-1980 was considered to be 15 degrees celsius and later changed to 14 degrees celsius?
Nothing you've "explained" explains that. This has signifant ramifications because if the mean was 15 degrees, we've experienced no warming the past 30 years and the whole thing crashes like a house of cards. It'd be like amassing all this evidence someone committed a murder but then the guy supposedly murdered shows up alive. That "evidence" is then moot.
Now you can talk about comparing changes in individual weather stations and amassing those averages and differences all you want or any other technique but that's a separate question. Could be they changed how they do that? Could be they just arbitrarily lowered everything en-masse? Could be the adjustment to 14 degrees is totally honest and the same standards are applied to recent temperatures as to those such that if we went with the old standards, we'd have global means higher than 15 degrees celsius?
But where are the peer-reviewed papers discussing why the mean was lowered, which coincidentally makes the past 30 years look warmer relative to that mean? - Temp record is unreliable
SteveS at 00:03 AM on 25 September, 2017randman,
I don't often comment here, but thought I would this time since I may be able to answer your question on the change in global mean temperature for 1951-1980.
I suspect that you're mistaken about what paper Hansen used to get that value. I suspect it actually came from Hansen and Lebedeff, 1987. (There's also an updated version of that paper from 1988, but I can't find a copy of it and it just seems to include the data through 1987, so it probably doesn't change anything.) If you look at Figure 1 in that paper, you'll notice that the paper is missing a lot of data from the oceans. More recent attempts to find global temperatures has included ocean temperatures as well, and I believe that will tend to lower the global temperature values overall. (See also Victor Venema's blog about station data homogenization. You might read some of the articles on Victor's blog - they may answer some of your questions.)
I don't think it's particularly surprising to find that, as time moves on, science has found better answers to questions - that is, after all, kind of the point of science.
- Temp record is unreliable
Mike Evershed at 02:33 AM on 4 August, 2017Thanks Guys. In view of the discussion above, I would agree that the global temperature record (sea and land) is the better measure, and because adjustments to the sea surface data rduce the long term growth trend and there are several groups working on the problem of past reconstruction, the risk of confirmation bias causing significant problems is small. That leaves the issue of "is the warming anthropogenic" (but that is for another thread and another time). Thanks especially for the courteous replies to what has been an attempt to genuinely explore the issue.
- Explainer: California’s new ‘cap-and-trade’ scheme to cut emissions
John S at 08:19 AM on 3 August, 2017It’s good that California affirmatively resolved the uncertainty as to whether its carbon pricing would continue past 2020. At the same time it’s a disappointment they couldn’t do better. It was only last year, as reported by your Dana Nuccitelli in the Guardian, that California passed AJR 43, urging the national government to pass a revenue neutral carbon tax.
https://www.theguardian.com/environment/climate-consensus-97-per-cent/2016/aug/29/california-has-urged-president-obama-and-congress-to-tax-carbon .
And, earlier this year, there were reports that, under SB 775, CA was about to revolutionize climate policy by replacing cap-and-trade with something much better, closer to fee and dividend, as advocated for many years by James Hansen, Katherine Hayhoe and Citizens Climate Lobby, and, more recently, by the Climate Leadership Council.
https://www.vox.com/energy-and-environment/2017/5/3/15512258/california-revolutionize-cap-and-trade
Why would this have been so much better?
The key point is a commitment to increase carbon prices predictability, in perpetuity (in other words until they get the job done of eliminating fossil fuel burning). This means all (or most, see below re environmental justice), of the revenue must be given back to citizens as dividends; otherwise taxpayers, and the economy, will not tolerate the extra taxes.
To be clear, every Californian would have received rising dividends compensating for the drain on their budgets from rising prices.
The big hit, the home run, as you baseball fans would say, is that predictably ever-rising fossil fuel prices would energize innovation and increase the net present value, hence feasibility and chance of success, of all long-lead-time and long-life projects, e.g. changing some of your old steam district heating systems to modern low temperature hot water systems, thereby enabling use of non-fossil sources, building retro-fits and strategic changes in transportation and industry.
It would protect trade exposed industries and prevent “leakage” by border-adjustment taxes (BAT’s). This is much more selective than giving away allowances holus bolus, which is typical in cap-and-trade schemes, such as ours here in Ontario. (Just for fun, some of us are imagining Trump’s reaction if Canada enacts wide-ranging BAT’s against the US next year because we will have a national carbon price and the US probably won’t.)
SB 775 would not have allowed off-sets. I could argue both sides of that one, but would have thought the environmental justice groups would fight for it, having seen some of the terrible industrial urban landscapes down there. But these were the same people who sank a revenue neutral carbon tax proposal in Washington state, hence some special effort to help vulnerable communities would have been wise (better than grandiose plans for bullet trains anyway.)
Perhaps the main opportunity lost, as expressed by David Victor in the referenced article, is the positive, leadership impact on the rest of the word – because, yes, we were watching. - Temp record is unreliable
MA Rodger at 21:15 PM on 2 August, 2017Mike Evershed @443.
Your quote concerns confirmation bias generally and is not specific to the scientific process. Nickerson (1998) 'Confirmation Bias: A Ubiquitous Phenomenon in Many Guises' does address things scientific (no mention of climatology) and a little more fully than he does witch-hunting. As I see this as off-topic, I will be brief.
The accounts given of Conservatism among scientists, Theory persistence, Overconfidence and Unity in science I would suggest apply to the AGW denialists rather than the AGW proponents. Science works hard to root out Confirmation Bias. I see no difficulty in taking on board an aberrant theory that would disprove AGW, but only if it has merit. AGW denialists cannot say the same for the science they attempt to overturn, science that does have merit. Yet they do have a role in science (but not in public), using their denialist viewpoint to rattle the cage, but in doing this they have failed to produce any aberrant theories that have any merit, so far.
Note that the examples given by Nickerson are about big issues that make-or break theories. (I should say here that I am not entirely happy with some of his accounts.) As the adjustments to global temperature series we discuss here do not lead to any make-or-break situations, I don't see there is a situation where confirmation bias would begin to operate. But looking from a denialist viewpoint, chipping away at the temperature record does assist the anti-AGW arguments, not least by spreading doubt over the entirety of all temperature records.
- Temp record is unreliable
Mike Evershed at 16:47 PM on 2 August, 2017I am grateful for the thoughtful responses of site participants (posts 436 to 442). Michael Sweets reference to Zeke Hausfather's article was particularly helpful and I'm beginning to see some light at the end of the tunnel. It looks as though the "denialist" sites are mostly referencing either the land surface air temperature data where revisions to older data do increase the warming trend (but only moderately so) or the modern period adjustments where again they increase the trend (but only slightly so), while sites supporting the consensus focus on the either the sea surface record or the overall record including sea surface temperatures where the adjustments reduce the long term warming trend (and significantly so). As to the questions I have been asked - I don't dispute the climate is warming and I don't think the data adjustments represent fraud - but I am trying to get a handle on how reliable the consensus view is, and on this thread how reliable the warming data is. As to my concern about confirmation bias, I agree that the existence of different groups working on the data problems reduces the risk, however as all of them subscribe to the consensus view, and defend the anthropogenic warming hypothesis the risk of confirmation bias cannot be totally discounted.
To quote an expert in the field: "A great deal of empirical evidence supports the idea that the confirmation bias is extensive and strong and that it appears in many guises. The evidence also supports the view that onceone has taken a position on an issue, one's primary purpose becomes that of defending or justifying that position. This is to say that regardless of whether one's treatment of evidence was evenhanded before the stand was taken, it can become highly biased afterward." http://psy2.ucsd.edu/~mckenzie/nickersonConfirmationBias.pdf. Nickersons discussion of confirmation bias in science at the end is particularly interesting - including the observation that the strength of science lies in vigorous challenge to hypotheses.
- 2017 is so far the second-hottest year on record thanks to global warming
nigelj at 06:33 AM on 2 August, 2017John S @9
Regarding the John Bates and Karl controvery. The accusations were data fiddling and incorrect process and reported in the daily mail tabloid newspaper.
Karl did nothing wrong. To quote Sheakespeare, much ado about nothing, or in modern terms an empty beat up. Things were all twisted out of context. The temperature adjustments were verified by several independent climate bodies, but the daily mail rant carefully omitted this key fact. The adjustments were also very small, again this was carefully not stated in the daily mail beat up. Bates was also demoted by Karl 2012, so take what you wish from that.
You can get a good picture of it in the following articles
www.carbonbrief.org/factcheck-mail-sundays-astonishing-evidence-global-temperature-rise
www.businessinsider.com.au/noaa-climate-data-not-faked-2017-2?r=US&IR=T
Regarding the NASA adjustments, refer to the recent article on this website listed in the left hand margin "Explainer. How data adjustments affect the global temperature record"
There are all sorts of adjustments, but the important thing is the big global land ocean trend raw data from 1900 - 2016 has actually been adjusted down. There is a graph in the article.
Regarding average global temperatures, these are based on weather stations all over the planet. NASA use a couple of thousand. Coverage is good overall, but with gaps in central africa, parts of the oceans, and only a few stations in very northern and antarctic regions. Nasa give technical analysis of why this is sufficient for a meaningful average, and this is on their website somewhere.
Just google "images for global weather stations". Here is one I looked at. Im not a climate scientist, just interested in the issues, but its pretty intuitively obvious there are plenty of weather stations over enough of the planet.
- 2017 is so far the second-hottest year on record thanks to global warming
John S at 04:37 AM on 2 August, 2017I just finished viewing a doc on You-Tube entitled “Climategate II Explained – NOAA Whistleblower – Data Manipulation – Global Warming Hoax” by Larouche PA published recently. Wikipedia’s account of Larouche PAC seems entirely economic, no climate change involvement indicated. The gist of the 72 minute lecture by an unidentified (?spokeperson for Larouche PAC?) was that ““NOAA breached its own rules on scientific integrity when it published the sensational but flawed report, aimed at making the maximum possible impact on world leaders including Barack Obama and David Cameron at the UN climate conference in Paris in 2015.” This was by Karl et all (2015) that claimed warming rate was twice what prior versions showed ( source Anthony Watts October (2015) and argued that truth was shown by satellite data from both UAH and RSS showing a flat line over this period. I know that Anthony Watts is a notorious climate change denial blogger, but rather than just dismissing the whole argument based on its source, I’d rather understand more of the background on this – basically is it true that, as alleged in this doc, NOAA fiddled the data, suppressed any internal dissention and then mysteriously “lost” the data all as revealed by whistleblower John Bates, a 40 year NOAA veteran and eminent climate scientist. I’m well aware that cherry-picking end-points over such a short period is no good way to consider the warming trend and that RSS put out a correction to its earlier data. What I want to know is any specific background on this specific accusation of wrong-doing by Karl et al exposed by Bates..
Later the talk characterizes such antics as typical for climate change advocates, citing the “broken hockey stick” supposedly exposed by McIntyre & MacKitrick in Energy and Environment. I heard Michael Mann’s response that their method was flawed but, again, I’d like to understand this on a deeper level than just “he said, she said”.
It also goes on about NASA supposedly lowering data before 1950 and raising it after 1950 thereby supposedly creating a warming trend. I heard about the correction of “bucket variances” for ocean data but I also thought I’d heard that these NASA adjustments created a lower warming trend not higher – so is the Larouche Pac presentation just a bald-faced lie or is there some more subtle fallacy involved in it?. The same accusation of NASA adjusting data upwards after 1950 was made in another doc on You-Tube, so, on the basis that where there’s smoke, there may be fire, I’m wondering where this story is coming from. I appreciate that adjustments to the temperature record have to be made to produce the best estimate of trend and so this can change retroactively and this fact alone allows the deniers to come in with clod-hopping boots, but as I said above, my understanding was that the net result of these adjustments was a lower warming trend not higher as alleged, so is that just a lie or what?
They also had a more fundamental question which I admit has confused me quite a bit also and that is how it is at all possible to calculate a global average from such a variety of circumstances affecting each temperature measuring device? I saw an explanation on NASA’s web-site of why changes were more reliable to average than absolute values but even so (and even after watching Cowtons’ excellent presentation on Denial 101x) it’s still a baffling subject. Maybe there is a good reference you can give me to read up on this. - Temp record is unreliable
scaddenp at 10:44 AM on 1 August, 2017Mike, call me completely unconvinced. We use a number of very complex instruments. Over the years, both accuracy and precision have improved even though the fundimental measurement has not. This is due to ever increasing complexity of processing and correction between raw detection and reported result.
Modern seismic processing has also become increasingly complex. Talk about torturing the data. Dont tell an oil explorer that the uncertainty in the depth to a reflector has increased because all that fancy processing makes errors more likely. Funnily enough scientists actually test this stuff and publish the methodology for everyone to examine.
On the other side, faced with an unappealing set of data, instead of finding fault with the methodology and publishing alternatives, all we find is dark mutterings about scientists motives and accusation of manipulating the data, which shows a laughable ignorance about science, scientists and science funding. Since UHI and SST adjustment corrections (the biggest adjustment to the global surface temperature recored) reduce the warming trend, if scientists are trying to defraud the public, they are making a rotten job of it.
The graphs on the advanced tab also show that adjustments are tiny compared to trend. Are you actually seriously suggesting there is a chance that surface temperatures are not actually warming? Ice melt and sea level rise are also somehow an artifact?
- Temp record is unreliable
michael sweet at 07:15 AM on 1 August, 2017Zeke Hausfather, one of the scientists on the Berkely Earth Surface Temperature (funded by the Koch brothers) wrote a detailed discussion of corrections on Carbon Brief. I like his writings since he is obviously very familiar with the data since he publishes on it, he works for skeptics so it is difficult to see him as part of a conspiracy on AGW and his articles are easy to read. You can Google his publications to get peer reviewed discussions of corrections.
Others will give you better references than me so I will probably not post again. Read less "skeptical" material if you want to be informed, WUWT is especially bad.
- Temp record is unreliable
MA Rodger at 05:24 AM on 1 August, 2017Rob Honeycutt @438,
Additional to your points gleened from "borish Bob Tisdale," it should be mentioned that the adjusted global land surface air temperature anomalies over their full record do result in increased linear trends relative to their 'raw data' trends but only when calculated over the full record (Bob's figure 1) and importantly all these adjustments that are global in land coverage (note CRUTem4 is a long way from global in land coverage and Bob Tisdale likely misrepresents the raw data it uses); these global land records provide adjusted results that are consistent. Given the adjustment methods are so different, that they give consistent result suggests Mike Evershod's specific worry about errors ("the more adjustments we make and the more data transformations we perform the greater the risk we run of making errors") is unfounded.
- Temp record is unreliable
Rob Honeycutt at 03:40 AM on 1 August, 2017And, relative to the Bob Tisdale article you referenced...
1) I congradulate you if you can actually get through reading an entire Tisdale article. He's a borish and convoluted writer, at best. Great reading if your purpose is putting yourself to sleep.
2) Most of the charts he's presenting actually support the fact that, for the modern era (post-1960), adjustments do not have a substantive effect on the conclusions of the land data.
3) The bigger challenges are with older sea surface data where methods of collecting the data changed over time. Those adjustments have resulted in lowering the long term temperature trend relative to raw data.
4) I definitely do not understand your rationale on confirmation bias. There are multiple groups processing the data and they're, essentially, ending with results that are in agreement. If there were a significant bias being introduced you'd expect that to be evident across multiple groups. The idea that all the groups could have the same bias, even though they're using different methods, seems extremely unlikely.
- Temp record is unreliable
Tom Curtis at 03:24 AM on 1 August, 2017Mike Evershed @435, your comment exhibits a gross misunderstanding. The various versions of GISTEMP LOTI (for example) do not apply additional adjustments on to already adjusted data. Rather, they apply refined versions of existing adjustments to the raw data. A classic example of this is the switch from switch to using night light data to determine urban areas inorder to apply the Urban Heat Island (UHI) adjustment.
If you adjust for the UHI using one method, and then start adjusting it by another method, there is no a priori reason to think that the second method will be worse than the former method. Indeed, given that the second method is based on improved statistical analyses of the effect, or improved subsidiary data (eg, night lights), it is likely that the second method will improve on the first.
Your further assumption that any adjustment will probably be worse than data known to be contaminated by extraneous effects (time of observation, station moves, etc) is also (to put it very kindly) dubious.
Finally, I am interested in your opinion of orbital decay adjustments to satellite temperature data. Is it your opinion that satellite temperature products should just show the unadjusted data as per the top panel of the following graph?

And if not, how are we to believe you objections to adjustments to the surface temperature data are principled rather than opportunistic?
- Temp record is unreliable
Mike Evershed at 02:14 AM on 1 August, 2017Thanks to moderator TD, Scaddenp, and Michael Sweet for replies. I have looked up moderator TD's references. But the problem I have is not whether individual adjustments, or homogenisation techniques are reasonable. Nor do I worry that there has been fraud on the part of climate scientists (though I suppose that is possible - scientists being human). Nor do i think that reverting to raw data would be better. My point as someone who is scientifically trained is that the more adjustments we make and the more data transformations we perform the greater the risk we run of making errors. Also, and more seriously, the more choices we make about which adjustments to apply, and how to apply them, we increase the risk of something called "confirmation bias". (The basic idea of confirmation bias is well known and adequately described in wikipedia - so I hope I may be excused providing a reference). So for me the most important point made in the replies is Michael Sweet's: i.e. that the adjustments of the old records have resulted in "a substantial lowering of the amount of warming." Does anyone reading this know where I can find the published scientific data on this - particularly in the surface air temperature? I have seen claims made both ways: leaving Humlim aside I have also seen this: https://wattsupwiththat.com/2016/04/24/updated-do-the-adjustments-to-land-surface-temperature-data-increase-the-reported-global-warming-rate/
- Temp record is unreliable
michael sweet at 22:12 PM on 31 July, 2017Mie Evershod,
Are you aware that the adustments of the old records have resulted in a substantial lowering of the amount of warming measured? Any uncertaity introduced by the adustments have to be in the direction of increased warming, not decreased warming. That means the problem would be greater than determined using the adjusted data. Humlum and others claim that they do not trust the adjustments but then refuse to use the unadjusted data for analysis because it shows a greater problem. That is contradictory and hypocritical.
The unadjusted data are still available for use by anyone who wants to use bad data. (link to Guardian article comparing adjusted and unadjusted data). If you do not trust the adjustments go for it with the old data.
- Temp record is unreliable
Mike Evershed at 01:30 AM on 26 July, 2017Moving on to a more sensible discussion. Surely the instability in the reconstructed temperature record is a legitimate cause for concern? Ole Homlums has published a lot of data on the adjustments and seems to come to the reasonable conclusion that:
"Based on the above [detailed charts of changes over time ] it is not possible to conclude which of the above five databases represents the best estimate on global temperature variations. The answer to this question remains elusive. All five databases are the result of much painstaking work, and they all represent admirable attempts towards establishing an estimate of recent global temperature changes. At the same time it should however be noted, that a temperature record which keeps on changing the past hardly can qualify as being correct. With this in mind, it is interesting that none of the global temperature records shown above are characterised by high temporal stability. Presumably this illustrates how difficult it is to calculate a meaningful global average temperature. A re-read of Essex et al. 2006 might be worthwhile. In addition to this, surface air temperature remains a poor indicator of global climate heat changes, as air has relatively little mass associated with it. Ocean heat changes are the dominant factor for global heat changes."
Source (http://www.climate4you.com)
- Models are unreliable
MA Rodger at 19:24 PM on 13 July, 2017NorrisM @that other thread,
In the context of seeing the results of Multiple Linear Regression adjustment to the global temperature record (Foster and Rahmstorf (2011) adjusting for Sol, Vol & ENSO), you ask:-
"I do not know if you are able to do this but if you were to elimate both the 1998 El Nino and the 2015-2016 El Nino from the data, how would the models stack up to actual observations excluding those events?"
The linear assumption for temperature response in F&R2011when Sol,Vol&ENSO are accounted for does leave much unaccounted for while the models in accounting for actual forcings and climatic responses and so have no problem with the 'non-linear', but in so doing fail to reproduce the very important but unpredictable ENSO oscillations.
One approach to coping with ENSO unpredictability adopted by Risbey et al (2014) is to be selective of the model results and only include "those models with natural variability (represented by El Niño/Southern Oscillation) largely in phase with observations are selected from multi-model ensembles for comparison with observations."
And the finding - "These tests show that climate models have provided good estimates of 15-year trends, including for recent periods and for Pacific spatial trend patterns."
Another approach adopted by Huber & Knutti (2014) is to calculate the adjustment required to account for ENSO effects in the models. They conclude from this work "that there is little evidence for a systematic overestimation of the temperature response to increasing atmospheric CO2 concentrations in the CMIP5 ensemble."
- Conservatives are again denying the very existence of global warming
scaddenp at 14:51 PM on 11 July, 2017Just wondering if your pseudo-skeptic also believes:
1/ glaciers cant be melting because somewhere there is one advancing
2/ Sealevel rise is caused by coastal subsidence
3/ NASA, JAXA, ESA are conspiring to doctor photos of the poles to make it look like ice is melting.
After all, if GW is just due to adjustments to the temperature record then it follows that ice cant be melting and the sea isnt rising.
- Conservatives are again denying the very existence of global warming
Tom Curtis at 14:21 PM on 11 July, 2017rugbyguy59 @4, if your pseudo-skeptic informant could navigate to those pages (linked from here), he could also navigate to the history page on the same site, where an explanation of the differences is given. Between 2000 and 2016 the major changes are:
- The change from the GHCNv2 (with data from 7200 stations) to GHCNv4 (with data from 26,000 stations).
- The change from Hadley Centre’s HadISST1 (1880-1981) and OISST data Sea Surface Temperature data to ERSST v4 Sea Surface Temperature data, the later embodying a far better knowledge of, and therefore adjustments for differences between methods of measuring temperatures from ships.
In addition, NASA GISS switched to using satellite night light data to identify areas of increased urbanization for the urban heat island adjustment, and areas above sea ice had temperatures determined by air temperature rather than by underlying water temperatures (which in winter can be 10s of degrees warmer).
The effect of the changes from 2000 to 2016 was to reduce the trend from 1950 to 2000, ie, the end of the period of overlap, as can be seen in this graph:

As can also be seen, the effect of the changes over the years have been minor, except for that between 1987 and more recent versions. Of course, the 1987 version relied on just 2,200 stations (8.5% of the current number), and had no Sea Surface Temperature data.
- Conservatives are again denying the very existence of global warming
rugbyguy59 at 13:45 PM on 11 July, 2017In a discussion with a pseudo-skeptic there was only one point that he made that I couldn't understand. It related to temperature adjustments and so I will ask about it here. He produced two global temp records from NASA that were quite different:
This one he says is from 2001
FigA.txt 2001 from GISS
And this one is from 2016
FigA.txt 2016 from GISSI've not been able to find anything that would explain why there is such a difference. I'm assuming both data sets are from NASA. I also know there are more than enough reasons to know adjustments are doing the right thing but is there anyone here who has run across this one and knows what the reasons are?
- Conservatives are again denying the very existence of global warming
nigelj at 06:26 AM on 11 July, 2017It's certainly false to claim everything or most things are adjusted up. The following link is a good explanation of why temperature adjustments (corrections) are made. I tracked this down to figure out whats going on.
theconversation.com/why-scientists-adjust-temperature-records-and-how-you-can-too-36825
It's the raw data thats "unreliable" to some extent (although not hugely). Urban heat islands bias things up, stations are moved, often biasing things down, thermometers sometimes break, or are old and less reliable, etc. These are corrected, and are easy enough to quantify. It would be crazy not to correct for these issues.
The following link shows raw and adjusted data for global land, ocean and land ocean combined temperatures.
variable-variability.blogspot.co.nz/2015/02/homogenization-adjustments-reduce-global-warming.html
Land temperatures are adjusted up slightly, but ocean temperatures are adjusted down, and combined land ocean temperatures are adjusted down! This is the most important and complete data set. This seems lost on the denialists.
- Why the Republican Party's climate policy obstruction is indefensible
NorrisM at 12:01 PM on 10 July, 2017nigelj, Tom Curtis and Eclectic.
If the Department of Energy does decide to form a Red Team Blue Team to examine climate change, then I think I can sit back and watch the fireworks rather than spend an inordinate amount of time reading all of the thread on this website dealing with the questions of the climate models trying to understand the debate. The reason I say this is that I think the real battleground will be whether the climate models have (a) accurately hindcasted the past climate (without adjustments that are needed to match reality); and (b) accurately predicted the future climate changes over the last 20 years.
Perhaps a part of the debate will be that irrespective of the discrepancies that exist the "hard science" not only proves the 1C increase but also the "positive vapour feedbacks" although I would have to think that would be an uphill argument. Perhaps the answer will be that the differences in predictions and observations are minor. As I noted elsewhere, if they all cannot agree on the facts because of the lack of proper instrumentation measuring things then that would at least argue for more funds dedictated to measurements which has to be a positive for both sides.
As I have noted on the other climate model thread, during the APS Panel chaired by Steve Koonin, both Santer and Held (at pages 503-505) acknowledged that the climate models have not been able to predict the changes. So the real issue will be whether both sides can agree on a "revised" Christy chart.
Tom Curtis on a reply to my reference to Koonin, questioned Koonin's independence. At that time, I had no idea who Koonin was other than that he was a physicist who had been appointed by the APS to head the Climate Policy Panel.
Since that time, I have done a Wikipedia search of Koonin and his credentials are stellar. I have also read the Physics Today article on his WSJ OpEd in the fall of 2014 and read his recent statement suggesting a Red Team Blue Team approach. Not too many people have their Doctorate in Physics from MIT. Not too many people have risen to the position of Undersecretary of Energy for Science under the Obama administration. Yes, he did work at one time for BP where he was responsible for long range technology including alternative and renewable energy sources. But this guy is no dummy.
So when as a sophisticated scientist as Koonin at the APS hearing expresses surprise at how far the models were off from observations, it makes me take note and ask how many "non-climate scientists" really understand how far the models are off from what has been happening with temperatures. It made me ask how much most non-climate scientists really know about the actual physics. Are they largely relying on the climate scientists without any real investigation on their own part? What are the fields of science necessary to construct adequate models? Reading the comments of SemiChem on fluid dynamics made me ask whether this was an area properly represented. What strikes me is that there are so many areas that it has to be difficult for one or two people to have a sufficient grasp on all the relevant areas.
Back to the differences, I am NOT saying that there cannot be valid explanations for these differences in the models and observations but unless I am missing something, if you have models that are two times off what is actually happening, it does make you pause.
So, of course, the issue will then be just how far off are these models. In fairness, all three IPCC climatologists (contributors) were not ready to concede that there was as much difference as Christy suggested but they certainly admitted there were clear discrepancies and they did NOT say (as they easily could have) that the discrepancies were minor.
Koonin is now the Director of the Center for Urban Science and Progress, New York University. He was a past professor of theoretical physics and provost of Caltech. If the only way to criticize the legitimate questions that Koonin has raised is to attack Koonin without addressing his reasons, then I will be very disappointed with the replies to this comment.
As I noted before, I think both sides of this debate should welcome any efforts by members of the Trump administration to get to the bottom of this. Let the chips fall where they may. Given that Trump is here to stay for at least another 3.5 years, what is there to lose?
If Koonin was indeed appointed to head this Red Team Blue Team investigation, I think you would have someone who would ensure that all sides are properly represented. I have to assume he chose the 6 climatologists who participated in the APS Panel in 2014.
- Bad news for climate contrarians – 'the best data we have' just got hotter
nigelj at 07:26 AM on 8 July, 2017I agree the reason for temperature adjustments is all there if you look. I have just done some reading on it myself, and put some links on the Republican Party article. If I can find this material in about one minute, sceptics have no excuse to be ignorant. The explanations are utterly compelling, and take little time to read. I have never even seen a sceptic try to refute them, and instead they just nag away, creating confusion, never clarity.
But maybe Haze partly has a point that making mistakes and having to correct them is never a good look. So try and minimise them, and openly explain what went wrong. We should avoid getting too defensive.
Any human based system will make a few mistakes. But do a bit of reading, and you find the climate science process goes to extreme lengths to minimise mistakes, identify mistakes, and biased temperatures or faulty measuring equipment, and correct them. The result is the big picture is very reliable.
Sceptics like Jo Nova are nit picking, and relying on the fact most people dont have time to check the detail. Its a form of cynical manipulation, and is not genuine scepticism that confronts issues openly. It's crowd manipulation. It's not genuine scepticism in the honourable, traditional sense of the term. Proper scepticism has to operate within rational boundaries.
For decent, rational scepticism read "Skeptic, by Michael Shermer"
- Bad news for climate contrarians – 'the best data we have' just got hotter
Haze at 20:53 PM on 7 July, 2017"So what do you propose that BoM do differently?" In this case to allay suspicion, state explicitly what the cut off points for automatic temperature adjustments are, how they are determined, what is the range around the cut off point and what form does human intervention take. Surely it wouldn't be too difficult to say (for example only) that automatic adjustments occur when a recorded temperature measurement is 1-2 C above the highest or lowest temperature rcorded at the particular station, that human intervention is based on assessment of several factors and giv e examples And as for appeasing deniers, politicians who are any good, spend considerable time and energy to sell their message to the public. If the BoM thinks that that is not their role, well, fair enough but spending, say, a day to put an explanation on their web site doesn't seem a huge ask to ensure corrections made are entirely undedrstandable and above all, transparent.
- Why the Republican Party's climate policy obstruction is indefensible
nigelj at 14:13 PM on 7 July, 2017Tom Curtis @23, yes we have so many lies by omission in sceptical climate articles it's frustrating. Thank's for the link to the NASA explanation for adjustments.
Regarding these temperature adjustments. The graph on page 11 in the Wallace research study appears to be land temperatures, im not sure it doesn't say.The adjustments adjust temperatures upwards anyway. The research is critical of this, but doesnt really say why in any detail, just vague accusations.
This link below shows a broader picture, with graphs showing adjustments for all three: land, ocean and combined. It also gives explanations on why they are made.
variable-variability.blogspot.co.nz/2015/02/homogenization-adjustments-reduce-global-warming.html
It shows land adjusted upwards, oceans steeply downwards and the net result is land and ocean combined actually adjusted downwards slightly. Interesting that the Wallace study didn't bother to mention all that. You are obviously aware of all this, but its a great article with clear visuals, and may be of interest to us non experts.
This article is also interesting, and gives more detail on why adjustments are made
theconversation.com/why-scientists-adjust-temperature-records-and-how-you-can-too-36825
I cant see a problem. The links all provide good reasons for adjustments to compensate for various biases, and urban heat island effects, etc,etc. The fact that the land / ocean combined is actually downwards seems lost on the sceptics.
I hope Im interpreting it all right. But the graphs in my link are pretty clear and the sources legitimate.
Maybe mistakes are made in adjustments, but I would like to see proof and none is on offering. It seems unlikely that every adjustment would be an error, especially when you look at the checking process and how good it is. It seems unlikely there is a global conspiracy across countries to adjust things one way on land. This is in the region of nasa moon landings conspiracy nonsense. And if so why would they do the opposite for the oceans?
Like you say it doesn't remove the alleged "cycles" anyway.
- Why the Republican Party's climate policy obstruction is indefensible
Tom Curtis at 12:07 PM on 7 July, 2017supak @14, nigelj @20, Wallace may be an obscure engineer, but D'Aleo is a meteorologist, and Idso is a climatologist. Both, however, are well known deniers, and Idso has earned a reputation for, for want of a better word, dishonesty when it comes to climate science. Idso does not appear to have any peer reviewed climate research since the early 2000s, but has been very productive of misleading denier "reports".
I have not gone right through the report but evidence in the early sections suggests this is just another in that sequence. In particular, they show a graph of various versions of the GISS temperature trends (Figure IV-1), the differences between which they attribute to "adjustments". The graph plots versions for 1980, 1987, 2007, 2010 and 2015. Wallace et al, however, feel no need to inform readers that the number of meteorological stations used increased from 1000 to 2200 between 1981 the 1980 (actually 1981) and 1987 versions, or that it increased to 7200 for the 1999 version. Nor do they feel any need to inform their readers that prior to 1995, no Sea Surface Temperature data was used, so that the data was for meteorological stations only. The very substantial changes in the temperature series between "1980" and 1987, and between 1987 and 2007 are probably influenced by these large increases in available data. Attributing the effect to "adjustments" without taking into account the change in available data is straightforwardly dishonest IMO.
Hardly any better is the "proof" that the "adjustments" eliminate a large "cyclical" component by comparison of global temperature data to US and North Atlantic temperature data. What is not noted is that the current versions of temperature data, even with all the adjustments, retain that large "cyclical" element in those areas. This can be seen clearly here, for example. (I should note that adjustments have increased the trend of the temperature data for the contiguous US, but has not eliminated the "cyclical" pattern. As a further note, I put "cyclical" in inverted commas because it is unclear to what extent the pattern is due to cyclical patterns in the climate, and to what extent it is due to changes in the aerosol forcing over time.)
- Why the Republican Party's climate policy obstruction is indefensible
nigelj at 08:07 AM on 7 July, 2017Supak @14
I had a very quick scan through this research paper out of curiosity. James P Wallace is some obscure engineer. It doesnt appear to have been conducted by climate scientists. I dont claim any specific climate expertise, but I take an interest, and the paper was easy to follow.
The paper makes claims there are a lot of adjustments in temperature which accentuate a warming trend, that they consider suspicious and unwarrented. Maybe they are starting to see conspiracy theories. But they have to prove in meticulous detail why those adjustments would be invalid, and they just haven't really done this from what I can see.
The most interesting and useful graph is fig1v-1 on page 11 which shows global temperatures, and essentially the very early data and subsequent corrections. It is obvious that the raw data and corrected data since the 1970s is much the same. The real change has been early last century where data has actually been corrected downwards, which does lead to a stronger warming trend. But again the research paper haven't really demonstrated why that has been wrong.
Either calculate some linear trends, or just step back and just squint your eyes down. The overall linear trends comparing the unadjusted data and adjusted data are just simply not hugely different anyway. We are still left with a strong warming trend, in even the unadjusted data. And they havent really proven why any adjustments are wrong.
Now the research paper focuses a lot on America, but why would you do that? They are one country. Its better to look at global averages surely.
The research makes a peculiar claim that in America "cyclical trends" have been removed or ignored. But they are making an unsupported claim that these are cyclical trends. We cannot say they are, and in fact all the evidence of global warming says they aren't.
They also have a graph for my country NZ, which is really why I'm responding, and did have a quick read of the research. It got my attention obviously.
Firstly the graph looks slighly wrong to me. But let that pass. We have recently had a big debate and enquiry as to whether adjustments to our data were valid, led by a certain sceptical lobby group. The bottom line is this became a big issue, involving a court case taken by the sceptical group against NIWA, our climate agency that prepared the temperature record and adjustments. The judge threw the case out of court, on the basis that the sceptical group didn't present properly qualified experts, and other failings.
The temperature reconstructions were handed to an Australian climate agency to peer review, and they concluded there was nothing wrong with what NIWA had done and adjustments made were all in order. Refer link below:
www.nbr.co.nz/article/climate-change-deniers-shot-down-high-court-challenge-niwa-bd-127869
- Temp record is unreliable
JamesMartin at 11:23 AM on 30 June, 2017The hangup that SkepticalScience.com has in regard to temperature data is that you are exclusively using datasets at least as current as 2015, all of which are tainted by the 2015 adjustments. No wonder you make statements such as
"It is very clear that use of the new data sets make almost no difference to the trend."
If you want to do a fair assessment of the impact that the 2015 corrections had on the historical temperature data, you must dig up those archived datasets recorded before 2015. Otherwise, you just go around in circles claiming that the warming hiatus is over or never was while the corrections "make almost no difference to the trend". Well, if the corrections make no significant difference in the trend, and the current trend is hiatus, then wouldn't we still be in hiatus?
- 2017 SkS Weekly Climate Change & Global Warming News Roundup #23
One Planet Only Forever at 08:14 AM on 14 June, 2017Too @ 7
I agree that something that is half the cost to the current generation and provides twice the benefit for future generations is better. However, as an engineer with and MBA, I understand the fallacy of believing we understand how to technologically manipulate the global environment in a way that is guaranteed to produce a desired result. An Engineering fundamental is that nothing gets produced for public use until thoughtful thorough actual (not artificial) experimentation has been performed to ensure its safety. My MBA courses in Organizational Change made it clear that a desired change cannot be created by implementing a theoretical adjustment on the organization. Implementing changes will result in changes, but because of complexities that are not well understood the actual change is different from what may theoretically be hoped for.
Massive experiments in imposing changes on the global environment to be performed by future generations at their risk, the sort of irresponsible impositions on Others that the likes of Lomborg try to justify, are extremely dangerous propositions.Reducing human impact emissions that are causing change is not the same type of change. Reducing the imposition of such a change to the global environment is “Guaranteed” to reduce the magnitude and uncertainty of the resulting consequences.
In line with my previous comment, it is not even appropriate to compare the costs for avoiding different levels of temperature increase. Comparisons of different approaches to reducing the total CO2 impact that would achieve the same levels of global impact are valid to determine the more effective options. But trying to justify the creation of a larger future problem because “it would be less expensive for the current generation” cannot be allowed to be considered to be sensible or responsible (and it is worse to claim that the future generations can gamble their futures on massive experiments in global environmental manipulation). That type of thinking can lead to unjustified excusing of less acceptable behaviour because less acceptable behaviour will always be easier, quicker or cheaper even though it causes a bigger problem.
A justified evaluation would be to determine the level of global temperature increase that would create very little chance of any future costs or challenges to any regions humanity currently has developed in. I am fairly certain that that has been reasonably determined, and we have already likely exceeded that level of temperature increase because of the lack of responsible action by the “Winners” among our predecessors since 1972 (1972 Stockholm Conference made it clear what changes of development direction would be required).If we continue to allow “Winning” by people who consider it OK to create costs and challenges for 'Others because the Others have no equity of influence over what is gotten away with, especially future generations' then indeed the matter is a Mathusian one in the sense of the “Less Sensibly/Responsibly Justified More Damaging Winners” encouraging others to compete to be Less Sensibly Responsible and More Damaging (A potential result of the Winners-of-the-moment in the USA excusing themselves from the responsibility to participate in the Paris agreement). The growth of unjustified pursuits of personal interests could indeed destroy humanity, even without population growth.
Basing “Winning” purely on Popularity and Profitability with everyone “freer to think and do as they please” is indeed a fundamental threat to the future of humanity.
But humanity has a history of only allowing trouble-makers to go “So Far” before their actions are effectively curtailed. Regrettably, humanity does appear to struggle to retain that learning. It seems to repeatedly have to be relearned. In too many cases the trouble-makers are permitted to go too far because of reluctance or inability to limit the Sovereign Liberty of people or nations (like the recent Sudanese, Bosnia, Rwandan atrocities).
Supposedly already advanced Nations that did the least improvement of CO2/GDP, CO2/capita since 1972 definitely have a “Disadvantage” today. Claiming the situation they are in, facing more rapid and significant correction of their economic activity (ways of living) than others, as “Unfair” is incredibly unjustified, but understandably popular in the population of such a nation. When G.W. Bush announced that the USA would not ratify Kyoto he declared that Americans did not have to change the way they lived. That “Big Lie” created a delusion among many members of the population, and the current generation in the USA is suffering the consequences. John Stuart Mill (a formative thinker regarding the pursuit of Liberty) would blame the society for failing to properly raise and educate its population. To Quote Mill, “If society lets a considerable number of its members grow up mere children, incapable of being acted on by rational consideration of distant motives, society has itself to blame for the consequences.” Mill would probably expect international action to attempt to “correct the failing of the USA” so that all of humanity does not fail. Hopefully, thinking like Mills will prevail in the USA before international intervention is required (because history shows that international intervention is usually too late, after significant damage is done).
It is undeniable that the USA today faces a much larger challenge than it would have to face if the leadership since the 1972 understanding of the Stockholm Conference had done more to encourage responsible development and discourage irresponsible development. But instead of striving to change as much as possible to a sustainable economic path, the USA leadership was influenced into trying to maintain a temporary perception of global competitive superiority by behaving less acceptably than it could have. Currently faced with the reality of the bigger correction of the over-development in the wrong direction, it is understandable why irrational inexcusable unjustified arguing to get away with less acceptable behaviour is popular in the USA population (and other nations). But it is also clear that the population of the USA is justifiably divided on this matter. In spite of some groups “Winning unjustified advantage by deliberately behaving less acceptably” others in the USA (and Canada, and Australia, China, and many other nations) have pursued better behaviour and the development of economic activity that does not face the undeniably dead-end destiny of activity that over-developed in the wrong direction. So the current USA (and many other nations) is understandably divided Good vs. Evil from the perspective of the future of humanity, regardless of attempts to claim that some other Good vs. Evil is more important and get attention misdirected.
Therefore, to avoid future massive damaging developments the international collective of leaders in business and government have to develop the will to be closely monitored and have quicker action taken to limit the “Winning” by any of “Their Peers” who try to gain advantage from a large portion of the population growing up mere children - selfish/greedy and/or with tribal xenophobic fear based intolerance of “Others”.
The Paris Agreement has the potential to effectively be that type of international mechanism. That is probably why it is so passionately disliked by many “Intelligent and Knowledgable but Misguiding/Misdirecting” people.
- Temp record is unreliable
Tom Curtis at 21:26 PM on 31 May, 2017landdownunder @413:
1) Tony Heller (aka Steven Goddard), producer of the www.realclimatescience.com website is not a climate scientist, former or otherwise. His qualifications are a Bachelors degree in Geology, and a Masters in Electrical Engineering. So far as I can determine, he has never published a peer reviewed paper of any description. He is well known as a serial misreprenter of data, a prime example of which is the gif which he produced, and you show.
2) Heller's giff does not demonstrate any significant change in values. Rather, it exhibits a change in the range of the y-axis from -0.6 to 0.8 for "NASA 2001" to approximately -0.85 to 1 for "NASA 2015". That represents a 32% increase and accounts for nearly all of the apparent change in trend - particlularly post 1980. An honest presentation of the data would have plotted both on the same axis, and ideally on one graph to allow direct comparison, like this:

(Source)
As can easily be seen, the temperature trend between 1980 and 2000 is nearly the same in all versions, and has certainly not doubled. In fact, the GIFF is doubling misleading. The 1998, 2000, 2012 and 2016 versions of the NASA GISS Meteorological Stations only temperature index are downloadable here (as also for the Land Ocean Temperature Index). the 1979-1998 trends are, respectively 0.184, 0.134, 0.169 and 0.177 oC/decade. You will notice that largest change is the 27.2% reduction in the trend from the 1998 to the 2000 version, followed by the 26.1% increase from 2000 to 2012.
Clearly the history of changes is not one sided, indicating the scientists concerned are following the data. Equally obvious is that Tony Heller has cherry picked an interval to show a rise in trend, even though the available history of adjustments results in a net reduction in the trend of the last two decades of the 20th century, not an increase.
Returning to cosmoswarrior's specific claim, a 32.1% increase in the trend (2000-2016) is not a doubling of the trend. Not even close, so even on your generous interpretation, that remains a gross error.
3) Unlike the AGW "skeptics", who focus on the facts of the changes without regard to the reasons, actual climate scientists focus on the reasons, which they detail in peer reviewed publications, and in the case of GISS, on site as well (see prior link). One main contributor to the change in trend from for the meteorological stations index has been the increase in the number of stations. The first version of GISS (1981) relied on just 1000 stations. That increased to 2200 in 1987, and to 7200 in 1999 (between the 1998 and 2000 versions). In 2005, a small number of stations in Antarctica were introduced, which was not a major increase in number, but very significant in improved coverage. Finally, in 2016 the number of stations jumped to 26000.
There have also been significant improvements in techniques, as detailed by GISS:
"We have gone through the archives to show exactly how these estimates have changed over time and why. Since 1981 the following aspects of the temperature analysis have changed:
- The simple procedure used in 1981 was refined as documented in Hansen and Lebedeff (1987), using 8000 grid boxes to allow mapping and analysis of regional patterns.
- Surface air temperature anomalies above the ocean were estimated using sea surface temperatures from ships and buoys starting in 1995 as documented in Hansen et al. (1996).
- Starting in the 1990s, the methodology took into account documented non-climatic biases in the raw data (e.g. station moves) and eliminated or corrected unrealistic outliers (Hansen et al., 1999).
- Areas with missing data were filled in — using means over large zonal bands — rather than restricting the averaging to areas with a defined temperature change (Hansen et al., 1999).
- A method was devised in 1998 and refined in 2000 to adjust urban time series to match the long term mean trend of the surrounding rural stations, Hansen et al. (1999, 2001). This adjustment uses the full data series to make the best estimate of the rural/urban difference and so can change as the time-series are extended (and more data comparisons are available). Starting in 2010 night-light radiance rather than population data were used to classify stations (Hansen et al., 2010).
- Usage of water temperatures as proxy for air temperatures was more accurately restricted to areas without sea ice starting in April 2006."
The merits of these changes in method can be argued, although they all seem like eminently reasonable improvements to me. But if you object to them, you have to make that argument. You cannot simply say that you do not like the result and therefore the methods are wrong - still less that they are fraudulent. The later, however, is the method employed charlatans like Tony Heller.
4) The involvement of politicians in challenging the adjustments is in no way evidence of the scientific invalidity or otherwise of the adjustments. It is evidence of where politicians think they can get political milage, either with there base or with their donors. Curiously, the second largest category of donors of Lamar Smith, who led the congressional inquisition on Karl et al, was from the Oil and Gas industry. Lamar Smith is not alone. In 2016, the Oil and Gas industry made political donations to the tune of $103 million dollars, 88% of which went to Republicans.
5) Finally, you quote Zeke Hausfather as saying:
"... they increased the amounts of warming that we have experienced pretty significantly. They roughly doubled the temperature trend since 1998 compared to the old versions of the datasets"
and go on to suggest, "...is also consistent with cosmoswarrior's statement". However, cosmoswarrior's statement was explicitly about the last two decades of the 20th century (1981-2000), not the interval from 1998-2012 that Zeke Hausfather was talking about. His comment was, therefore, entirely irrelevant to cosmoswarrior's eggregiously false claim. More importantly, the 1998-2012 trend "roughly doubled" not because there was a large increase in the trend, but because the trend was low. The change in trend over that period was from 0.039 C per decade to 0.86 C/decade, a change of approximately half (63.5%) of one standard deviation of the error of the new trend as determined on the SKS trend calculator.
Following the logic of the advocates of the existence of a "hiatus", that is no change at all.

- Temp record is unreliable
moonrabbit at 15:21 PM on 29 May, 2017I would like to comment on your responses to cosmoswarrior and diehard in their postings about the reliability of NOAA temperature data. First, in the response Tom Curtis gave to cosmoswarrior in @406, he showed the GHCNv3 data before and after the corrections, and pointed out that there was "almost no difference between the raw and adjusted data from 1980 forward". Tom Curtis then used this fact to argue that cosmoswarrior was incorrect in his/her statement about the data adjustments made in 2015 (which eliminated the "warming hiatus") also rewrote the temperature data for the last two decades of the 20th century. This is not an equitable comparison, however, since GHCNv3 was a land-based dataset only and the major changes had to do with the sea-surface measurements. Therefore, we cannot use this fact to argue that the statement by cosmoswarrior about "pause-buster" data corrections is "simply false" or that he/she is in "gross error".
At this point, I don't believe the fact can be disputed that NOAA made major changes in temperature data in June 2015 which in fact eliminated the appearance of a warming slowdown after 1998. The writings and videos by Kevin Cowtan and Zeke Hausfather that you in fact post and reference discuss the affects of these "adjustments" on the temperature trends. Additionally, news of these sweeping changes, including rewriting of data (which at least most of us have never seen before in any scientific effort), caused a huge controversy in the entire climate science field and eventually prompted a Congressional investigation. Therefore, if cosmoswarrior and diehard are mistaken in their statements, they are far from being the only ones.
- Does Urban Heat Island effect add to the global warming trend?
Glenn Tamblyn at 14:36 PM on 29 May, 2017EE
Your right that it is a change in the local characteristics of a site that can potentially skew the results.
How do they corrrect for this changing? Hopefully the metadataassociated with each station is updated as any such change occurs.
Also, the GHCN dataset that is used as the basis for some of the temperature products uses an automated pairwise adjustment method, contrasting nearby stations with each other to look for unusual variations in any station.
The data set produced by NASA GISS goes further. They use satellite data about lights at night to estimate degree of urbanisation, independent of station meta data. So any evolution of a site from rural to urban, at least in the satellite era can be detected. - Temp record is unreliable
dieharder at 13:24 PM on 23 May, 2017No, Tom Curtis. Your graphs do not satisfy my "quibbles" — not in the slightest. What I am looking for are the "corrections" that were applied to the original data (which clearly showed a warming hiatus) in order to eliminate the warming hiatus. These data adjustments, as I stated in a previous posting, totally eliminated the warming pause and about doubled the warming rate. Now, before negating me again on this claim and being too quick to delete this posting, be advised that this was part of the introductory statement made by Zeke Hausfather on the video Recent Ocean Warming has been Underestimated. In his words, "... they increased the amounts of warming that we have experienced pretty significantly. They roughly doubled the temperature trend since 1998 compared to the old versions of the datasets." So who am I supposed to believe, you or him!?
Now from the email newsletters I get from the "denier" community along with a few online news articles about whistleblowers and NASA and NOAA fighting the Congressional investigation, I believe I have some insight as to why you can't come up with the dataset showing the adjustments that did away with the warming hiatus. NOAA simply refused to cooperate with the investigation and witheld the subpeonad email communications and scientific data. Since this was still during the Obama administration, the Whitehouse would not enforce their compliance. Therefore, the world may never know just what killed the hiatus at NOAA, and I'm supposed to accept their "data" as "overwhelming evidence with 97% consensus". — Give me a break! If this is your version of science, you can keep it!
Finally, I would like an apology from you for your statement "Rather than admit that gross error, he quibbles about the data source, and about the change in the NOAA temperature data set detailed in Karl et al (2015)." We know now that my claim was not erroneous at all. Either that or Zeke Hausfather made the same "gross error". Also, I resent your use of the term "quibbles" as it gives readers the impression that my concerns are over trivia as opposed to the primary issue of assessing the amount of global warming we are experiencing.
- Temp record is unreliable
Tom Curtis at 12:51 PM on 22 May, 2017cosmoswarrior/coolearth/diehard appears to not like my pointing out @406 the gross error in his claim that "...the temperature history during the last two decades of the 20th century was rewritten to double the rate of temperature increase". Rather than admit that gross error, he quibbles about the data source, and about the change in the NOAA temperature data set detailed in Karl et al (2015). To deal with his quibbles, here is a comparison of raw and adjusted data in the new data set in figure 2 of Rove et al (2015):

The top panel shows the difference between prior adjusted data set, and the new adjusted data set. It is very clear that use of the new data sets make almost no difference to the trend. In the bottom panel is a comparison of the new adjusted data set to the raw data set. Post 1945 there is almost no difference, and in particular it is clear that claims that "...the temperature history during the last two decades of the 20th century was rewritten to double the rate of temperature increase" are at best massively misinformed, and at its source, a lie.
With regard to the disappearing of the "hiatus", that comes about in Karl et al (2015) not because they use a new method of adjustments, but because they use two new data sets. Specifically, they switch from ERSSTv3 to ERSSTv4 for marine temperatures, and from GHCNv3 to the ISTI database for land temperatures. The later represents a switch to a larger database with a more extensive coverage. It represents more data. The change in ERSST versions involves, "...updated and substantially more complete input data from the International Comprehensive Ocean–Atmosphere Data Set (ICOADS) release 2.5; revised empirical orthogonal teleconnections (EOTs) and EOT acceptance criterion; updated sea surface temperature (SST) quality control procedures; revised SST anomaly (SSTA) evaluation methods;
updated bias adjustments of ship SSTs using the Hadley Centre Nighttime Marine Air Temperature dataset version 2 (HadNMAT2); and buoy SST bias adjustment not previously made in v3b." It's effect on the NOAA temperature record is discussed in detail by Kevin Cowtan here. It has also been discussed by Zeke Hausfather as part of a more comprehensive discussion of the NOAA updates.Finally, the "hiatus" is not defined as a period of zero or negative trend in Global Means Surface Temperature (GMST). Rather, it is defined as a period in which the zero trend is within the error margin of the observed trend. As it happens, the long term trend has been within the error margin of the observed trend through out all periods considered to be part of the hiatus. That means, logically, there is no more reason to consider the trend to be zero than there is to consider it to have continued unabated. Indeed, given that all purported periods of the "hiatus" are parts of periods in which there is a statistically significant positive trend, there is more reason in those periods to consider them to be periods or warming rather than stasis. In short, the "hiatus" was at best only a statistical artifact such that a small change in the observed trend (approximately one standard error) over the period of the "hiatus" makes it transparently an artifact. That so small a change can make it "disappear" shows it to have been, at best, an artifact all along.
- Temp record is unreliable
Tom Curtis at 20:22 PM on 17 May, 2017cosmoswarrior @405:
here are the differences between raw and asjusted GHCNv3 data, as calculated by Victor Venema:
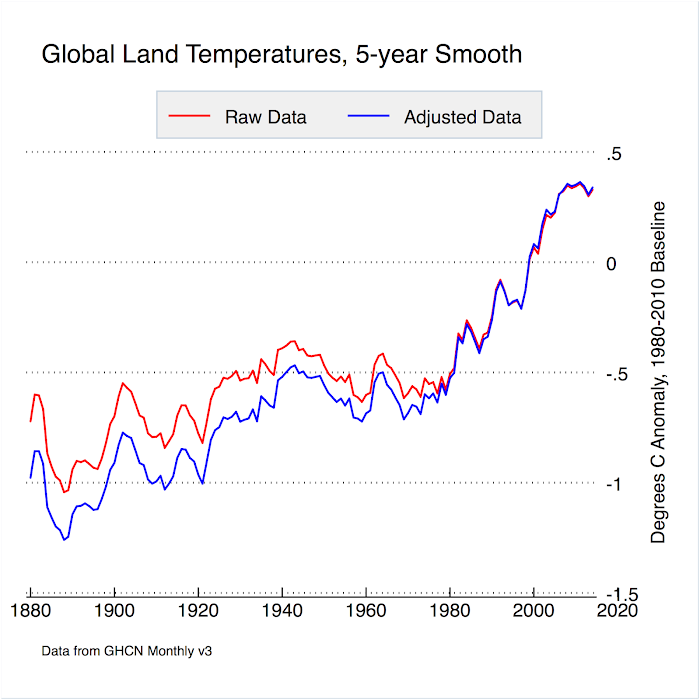
The GHCN data was until recently the entire basis of the NOAA land only surface temperature data, and almost the entire basis of the GISS meteorological stations only temperature data. The comparison applies for those sources also. As can easilly be seen, there is almost no difference between the raw and adjusted data from 1980 forward. Your claim that "the temperature history during the last two decades of the 20th century was rewritten to double the rate of temperature increase" is simply false.
- Temp record is unreliable
cosmoswarrior at 19:52 PM on 17 May, 2017How can it be said that the temperature record is reliable when in June 2015, NOAA published a paper describing certain adjustments they had made to "improve" the data, and in so doing, they eliminated the 17 year warming hiatus that was troubling many climate scientists. Not only that, but the temperature history during the last two decades of the 20th century was rewritten to double the rate of temperature increase. Assuming those adjustments were necessary to correct data errors, it opens questions as to the competency of the individuals involved in the data handling. Evidently, there were serious problems in the data gathering and processing that went on for 20-30 years, and it took an apparent slowdown in the warming to bring it to anyone's attention. Allegedly, the problem is "fixed" now, but with the lack of competency that plagued the data handling process, how do we know the fix is any better than the original?
- More errors identified in contrarian climate scientists' temperature estimates
Tom Curtis at 11:31 AM on 13 May, 2017Bob Loblaw @10, I think Art Vandalay was trying to allude to Watt's surface stations project. The idea is that introduction of a cement slab or other artificial structure to the immediate vicinity of a meteorological station will contaminate the trend information. While direct IR absorption by the thermometer does not have any impact on that, it is certainly possible that such degradation of the site might have an effect. Indeed, the effect was quantified in Fall et al (2011). They state in the abstract:
"This initial study examines temperature differences among different levels of siting quality without controlling for other factors such as instrument type. Temperature trend estimates vary according to site classification, with poor siting leading to an overestimate of minimum temperature trends and an underestimate of maximum temperature trends, resulting in particular in a substantial difference in estimates of the diurnal temperature range trends. The opposite‐signed differences of maximum and minimum temperature trends are similar in magnitude, so that the overall mean temperature trends are nearly identical across site classifications. Homogeneity adjustments tend to reduce trend differences, but statistically significant differences remain for all but average temperature trends. Comparison of observed temperatures with NARR [NorthAmerican Regional Reanalysis] shows that the most poorly sited stations are warmer compared to NARR than are other stations, and a major portion of this bias is associated with the siting classification rather than the geographical distribution of stations. According to the best‐sited has no century‐scale trend."
It should be noted that for the primary point of comparison with satellite data, ie, daily mean temperatures, the "... overall mean temperature trends are nearly identical across site classifications".
You have shown that Art Vandalay was wrong in assuming site degradation would effect thermometers by IR radiation to any significant degree, but it does effect local air temperature which is measured at the site.
Finally, I will note that homogeneity adjustments in the surface temperature record are conceptually equivalent to the adjustments made to the satellite record to ensure consistency between the records from different satellites. The major difference is that in the surface record, the adjustment is not checked against the records of one or two other satellites, but against multiple nearby thermometer records, making the adjustment far more reliable.
- Lindzen Illusion #2: Lindzen vs. Hansen - the Sleek Veneer of the 1980s
Tom Curtis at 12:43 PM on 8 May, 2017JME @111, the relevant quotes are:
1)
"I personally feel that the likelihood over the next century of
greenhouse warming reaching magnitudes comparable to natural variability seems small," he said. "And I certainly feel that there is time and need for research before making major policy decisions."2)
"What does the temperature record already show about global
warming? Do the data conclusively indicate about one-half degree centigrade (plus or minus 0.2 degree) global warming over the last century, as some proponents suggest? No, contends Professor Lindzen."3)
"The trouble with many of these records," he said, "is that the
corrections are of the order of the effects, and most of us know that when we're in that boat we need a long series and great care to derive a meaningful signal."4)
"Nor, he said, was the temperature data collected in a very
systematic and uniform way prior to 1880, so comparisons often begin with temperatures around 1880. "The trouble is that the earlier data suggest that one is starting at what probably was an anomalous minimum near 1880. The entire record would more likely be saying that the rise is 0.1 degree plus or minus 0.3 degree."From (4) you can project Lindzen's estimated trend temperature increase since about 1850. Strictly for comparison purposes, this requires that you use either HadCRUTv4 of the Berkely Earth LOTI both of which extend back to 1850. The GISTEMP LOTI only extends back to 1880, a time of which Lindzen says "... probably was an anomalous minimum ...". Using a GISTEMP decadal or multidecadal average starting in 1880 to establish the baseline for Lindzen's predictions would underestimate his predicted temperature. It also, however, overestimates his trend in that the 0.1 C rise is taken to be over a 30 year shorter interval.
Further, for Lindzen to consider there to be an "anomalous minimum", he obviously considers there to be more natural variability (see (1)) than that generated by the ENSO cycle, plus volcanism and other short term effects. That, however, is what is portrayed in the OP above. Ergo, arguably the graph understates the prediction for global warming.
To see to what extent this is true, I made a comparison between the Lindzen prediction and the BEST LOTI:
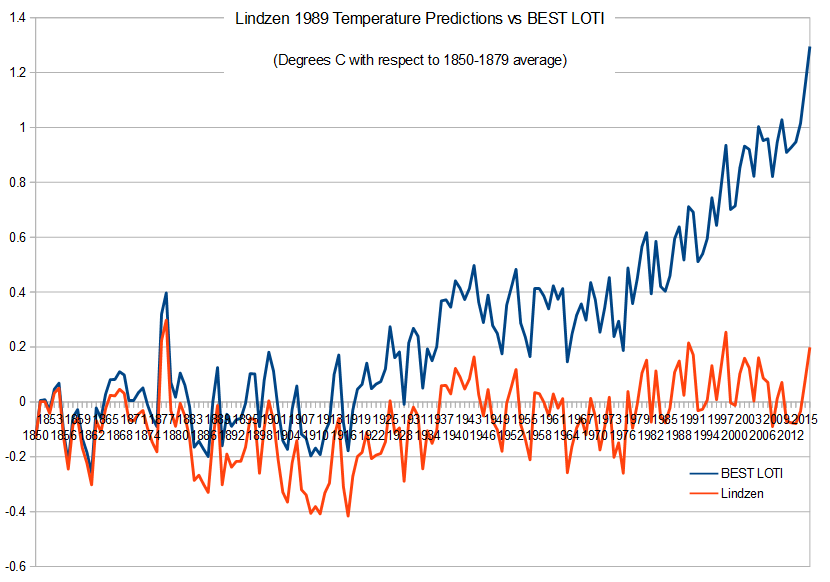
Comparing this graph to those above, it appears that the errors made worked in Lindzen's favour. That is primarilly because 1880 was not "...an anomalous minimum..." relative to 1850, contrary to Lindzen's claim. Consequently the increased trend generated by using an 1880 start date brings the Lindzen prediction closer to observations than do the graphs above. The only thing better for Lindzen in this more accurate comparison is the better fit with long term variability. On the other hand, the complete failure to capture the continuation of the temperature trend from the 1970s to late 1980s by Lindzen makes his prediction absurd, if the overall under prediction of temperatures throughout the 20th century had not already.
Lindzen commented on the observational record, saying:
"Professor Lindzen cited many problems with the temperature
records, an example being the representation of the Atlantic Ocean with only four island measurement sites. Urbanization also creates problems in interpreting the temperature record, he said. There is the problem of making corrections for the greater inherent warming over cities--in moving weather stations from a city to an outlying airport, for example."These were fair comments in 1989, when the GISS temperature record was based on meteorological stations only. Now, however, the GISS LOTI and BEST LOTI include ship and bouy data for Sea Surface Temperatures. What is more, BEST does not adjust for station moves, but rather treats any such move as resulting in a different station. BEST also relies on far more meteorological stations than GISS even now, and certainly in comparison to the GISS product of 1989.
Further, rather than "the corrections [being] of the order of the effects", as claimed by Lindzen in 1989, in the modern LOTI temperature series, the corrections reduce the effects:
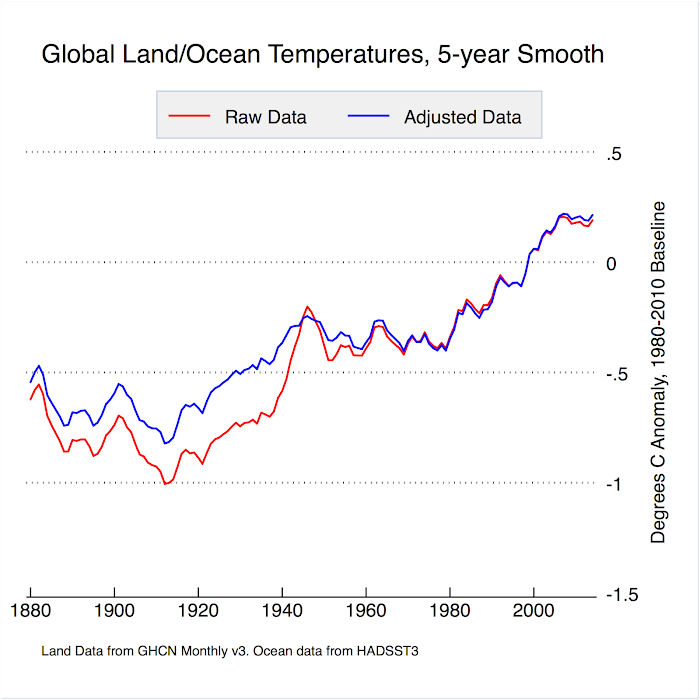
(See here)
There is, therefore, no reason to doubt the essential accuracy of the modern observations. Ergo, Lindzen was wrong - calamatously wrong, in his implied prediction of 1989.
(Small note: Lindzen predicts future warming as being small in terms of natural variability. I took that to mean less than half of a standard deviation of the 1850-1950 temperature data, taken for the excercise as being entirely natural or nearly so. That exagerates Lindzen's natural variability as anthropogenic forcing was a significant factor over that period. Base on that yardstick, Lindzen's prediction for the trend from 1990-2100 is a trend of 0.008 C/decade, or 111% of his retrodiction of the observed trend from 1850-1989. That is, his predicted trend rises by only 11% from his retrodicted trend.)
- Humidity is falling
Tom Curtis at 06:51 AM on 2 May, 2017vatmark @41:
The actual IPCC definition of "radiative forcing" was:
"Radiative forcing Radiative forcing is the change in the net, down-ward minus upward, radiative flux (expressed in W m–2) at the tropopause or top of atmosphere due to a change in an external driver of climate change, such as, for example, a change in the concentration of carbon diox-ide or the output of the Sun. Sometimes internal drivers are still treated as forcings even though they result from the alteration in climate, for example aerosol or greenhouse gas changes in paleoclimates. The traditional radia-tive forcing is computed with all tropospheric properties held fixed at their unperturbed values, and after allowing for stratospheric temperatures, if perturbed, to readjust to radiative-dynamical equilibrium. Radiative forcing is called instantaneous if no change in stratospheric temperature is accounted for. The radiative forcing once rapid adjustments are accounted for is termed the effective radiative forcing. For the purposes of this report, radiative forcing is further defined as the change relative to the year 1750 and, unless otherwise noted, refers to a global and annual average value. Radiative forcing is not to be confused with cloud radiative forcing, which describes an unrelated measure of the impact of clouds on the radiative flux at the top of the atmosphere."
(Emphasis added)
It is very clear that the definition given is the same as mine, which is no surprise given that I based mine on the IPCCs. The phrase you take out of context clearly applies to the report only, and is not part of the specific definition. Rather, it is a convention adopted for convenience in the report. Given that convention, if you use a different base date you should state as much, or make it very clear in context. Alternatively, you can discuss the radiative forcing for a given change in atmospheric concentration of CO2, etc. Again, if you do so, you should state as much, or make it clear from context. But a convention adopted for a report does not thereby become an essential part of the definition.
- Increasing CO2 has little to no effect
Tom Curtis at 12:26 PM on 1 May, 2017vatmark @311:
1)
"This seems very odd to me. You use a formula for radiation, not based on fundamental physics?"
The radiation models used to calculate radiative forcing are based on fundamental physics (ie, basic physical laws). The actual radiative forcing, however, depends on things like extent and type of cloud cover, type of ground cover, surface temperature, etc. These conditions cannot be directly calculated from fuandamental physics, but must be observed. It follows that the radiative forcing also cannot be directly calculated from fundamental physics.
2)
"And the changes in Outgoing Long Wave Radiation is corrected for radiation in the stratosphere, after you adjust the stratosphere in what way?"
Given a change in atmospheric concentration of a greenhouse gas, or of incoming insolation, the stratosphere will establish effective thermal equilibrium very quickly. As a result it is convenient to define radiative forcing with the stratospheric adjustment. You can do it differently. The Instantaneious Radiative Forcing is calculated without a stratospheric adjustment, for example. However, the values cited in the IPCC are for the adjusted Radiative Forcing.
The stratospheric adjustment would be made by adjusting the stratospheric temperature by successive approximation until energy into the stratosphere equals energy out of the stratosphere, and the various levels of the stratosphere are in local thermodynamic equilibrium. As noted above, I have seen an explicit technique for doing this, but do not currently remember it.
3)
"Isn´t that an example of doing radiation physics backways? To me it seems like you use the effect as a cause if you start at the last point where radiation leaves the climate system."
You appear to be confused. A change in radiative forcing can as easilly be due to a change in insolation (your forwards effect) as from a change in green hous gas concentration. The radiative forcing is used because the tropopause is an easilly defined and measured energy boundary. As such, it must satisfy the definition of conservation of energy - ie, that if more energy goes in than out, energy must be stored in some form within the boundary. Given that the energy levels involved are not sufficient for large scale energy to matter conversion, the energy will be stored as heat, and consequently will result in an increase in temperature. It is that fact that makes it possible to calculate the effects of changes in GHG concentration by using the concept of "radiative forcing".
I will note that GCMs and radiative transfer models do not use "radiative forcing" to calculate the consequences of changed GHG concentrations, or solar irradiance. They follow all the energy transfers in a step by step process as described in the preceding post. It is only when we do not have access to GCMs (or in specific contexts radiative transfer models), or we want to calculate approximate results without waiting for the several days or weeks of a GCM run that we make use of radiative forcing.
- Increasing CO2 has little to no effect
vatmark at 04:11 AM on 30 April, 2017Tom Curtis at 11:04 AM on 20 April, 2017
" the formula for radiative forcing was not directly derived from fundamental physics. Rather, the change in Outgoing Long Wave Radiation at the tropopause, as corrected for radiation from the stratosphere after a stratospheric adjustment (which is technically what the formula determines), was calculated across a wide range of representative conditions for the Earth using a variety of radiation models, for different CO2 concentrations."This seems very odd to me. You use a formula for radiation, not based on fundamental physics?
And the changes in Outgoing Long Wave Radiation is corrected for radiation in the stratosphere, after you adjust the stratosphere in what way?
This is then used to calculate surface temperature, or some influence on it?
Isn´t that an example of doing radiation physics backways? To me it seems like you use the effect as a cause if you start at the last point where radiation leaves the climate system.
Do I understand it right that you adjust stratospheric radiation to co2 concentration, then correct Outgoing Long Wave radiation to that, then use that information as a cause, or part of the cause, of surface temperature?
Is the infrared radiation of the stratosphere the cause of infrared radiation in the tropopause, and the infrared radiation of the tropopause is the cause of infrared radiation from the surface? I see you write radiative forcing, but as I understand it, radiative forcing is still a change of infrared radiation.
Can you connect that to solar radiation? I guess this chain reaction stops at the surface since it is not possible for the surface to have an effect on heat from the sun. I thought a model had to be done in the other way around, you start with the heat source and find the amount of absorbed heat in the surface. Then continue to estimate the heat absorbed by the atmospheres different layers and then it leaves the system. That´s how I learned in school, but that is a long time ago, I guess something has changed.
But I think it is counterproductive to not use fundamental physics to explain temperature, or Outgoing Longwave Radiation. When we learned about solar radiation and the temperature of the atmosphere, our teacher used a basic model for heat. He used the surface temperature and the inverse square law. He said that the solar heat is absorbed and emitted according to the inverse square law and the difference in temperature, or heat flux, is the way to describe earth as a steam engine. That is fundamental physics and it gives the right amount of infrared radiation observed by satellites. Just use the difference and divide whats left by four.
When you say that you use a model doing it backways, in my view, and that it doesn´t use fundamental physics that describe heat, why is your way of doing it better?
- No climate conspiracy: NOAA temperature adjustments bring data closer to pristine
Tom Curtis at 11:07 AM on 27 April, 2017Spassapparat @34, Tony Heller (aka Steven Goddard) shows the following graph of USHCN adjustments:
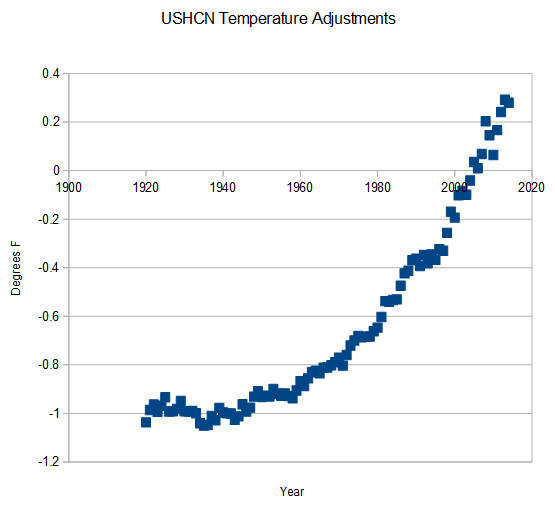
You will notice that there is not a lot of scatter in the individual points from year to year, a necessary feature for the high correlation with CO2 given the very limited scatter found in the CO2 record (at least from Mauna Loa). That being said, the graph comes as a surprise to me, for I have typically seen a much larger year to year scatter in the graphs, such as shown here:
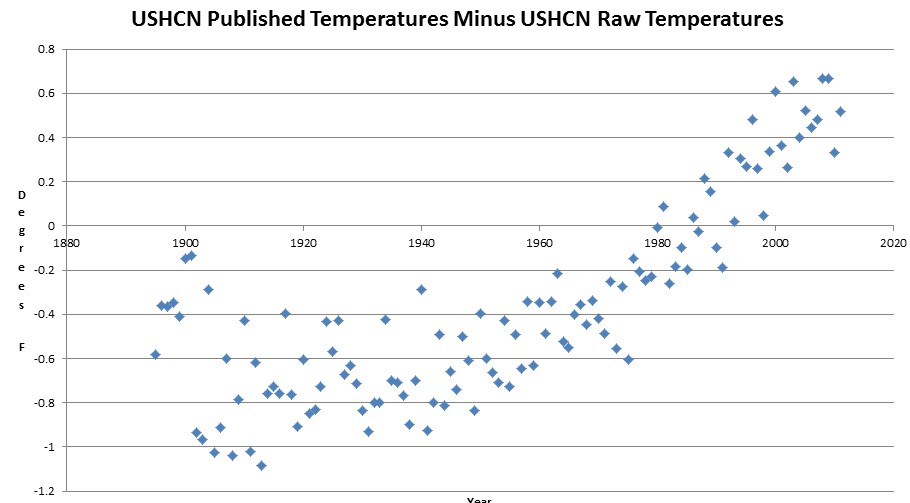
The author of this second graph is in obvious, and fundamental disagreement with Tony Heller about the size and nature of the adjustments in the USHCN temperature record. Importantly, if Heller is correct, there is a significant correlation between CO2 concentrations and temperature adjustments, but if the author of the second graph is correct, there is not. That is odd, because the author of the second graph is Tony Heller.
It turns out that when Heller is not trying to argue that there is a high correlation between CO2 concentration and temperature adjustments, he thinks the adjustments are very different from what he takes them to be when he trying to make that argument. It might make one think that Heller has adjusted his calculation of the adjustments to fit is CO2 correlation argument.
In any event, the basis of the adjustments is in fact well known. NOAA publishes the algorithms used to make the adjustments. The publish the raw and final data as well. Consequently anybody with the appropriate skills and determination can calculate the adjustments independently of NOAA. Several people have, and they have come up with the same result. Needless to say, none of NOAA's algorithms make any reference to CO2 concentration, as can be seen for the step wise adjustments as calculated by Judith Curry:
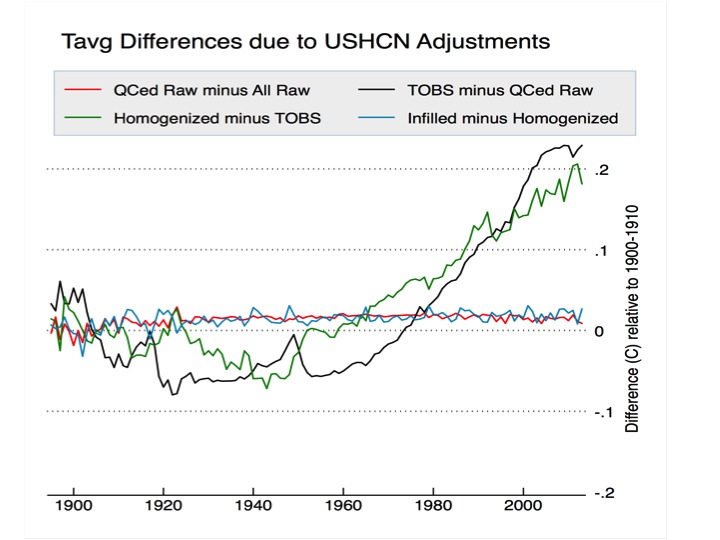
Heller knows this, so he knows that any correlation between the adjustments and CO2 concentration (whether assisted by adjusting the adjustments or not) is coincidental. His failure to discuss the known basis of the adjustments in his post must therefore be considered a calculated deceit.
- No climate conspiracy: NOAA temperature adjustments bring data closer to pristine
Spassapparat at 06:38 AM on 27 April, 2017Hi,
an argument that appears on many climate skeptic blogs (ex: https://stevengoddard.wordpress.com/2014/10/02/co2-drives-ncdc-data-tampering/) to justify the claim that there is deliberate tampering going on is to plot the NOAA temperature adjustments against measurements of atmospheric c02 and finding that there is an almost perfect fit. While a close correlation imo can be expected, that close of a fit appears surprising to me too. As I'm neither a climate scientist nor a statistician I was wondering whether someone could provide an explanation for this?
- Humidity is falling
Tom Curtis at 07:04 AM on 24 April, 2017curiousd, for Modtran using the default tropical setting, at 0 Km altitude in the second section on "atmospheric profile" it shows RH, which I take to be relative humidity. In the third section under H2O it gives a value of 1.90E+01, unit not specified. The value for 0 Km under H2O changes to 5.89E+00 for the US Standard Atmosphere, and to 6.24E+00 in the US Standard Atmosphere with a temperature offset of +1 C provided you have the model set to Hold Fixed "relative humidity" rather than "water vapor pressure". I have not gone through all of the standard settings with and without constant relative humidity, but it would not take a great effort to do so.
Clearly with this function, if you offset the surface temperature by the difference between 1976 and today, holding fixed relative humidity in the UChicago version of Modtran, you would automatically adjust for the change in water vapour pressure as well.
This does create a slight problem if you are trying to calculate radiative forcings, which are the difference in upwelling IR radiation at the tropopause after the stratosphere has reached radiative equilibrium, but before the troposphere has had any feedbacks. The latter clause means without andy adjustment in H2O vapour presssure. Technically that means if you are calculating the radiative forcing between 280 ppmv and 400 ppmv the model would need to be set for the relative humidity at an equilibrium temperature for 280 ppmv, and retain a constant water vapour pressure when calculating the the radiative forcing outgoing IR radiation at 400 ppmv. That in turn would require knowing the offset in temperature from 1976 to the temperature equilibrium. In practise, and in the absense of historical data (which we probably lack on a global scale for when the when the CO2 level was 280 ppmv), it means assuming a climate sensitivity factor (ie, a temperature change at equilibrium for a given change in radiative forcing) and making successive approximations on the temperature offset. It also means that the radiative forcing for an increase in CO2 from 280 ppmv to 400 ppmv would be slightly different to that from a decrease from 400 ppmv to 280 ppmv due to the different base H2O vapour pressure. For small changes in CO2 the difference should be small enough in practise that it can be ignored.
I should note that there exists a technique for adjusting for stratospheric equilibrium in calculating the strict radiative forcing, which I have seen explained by David Archer. Unfortunately, I remember neither the explanation, nor the page on which it was located, so I cannot help you with that. I mention it, however, incase you want to follow it up.
- Increasing CO2 has little to no effect
Tom Curtis at 11:04 AM on 20 April, 2017DrBill @301, the formula for radiative forcing was not directly derived from fundamental physics. Rather, the change in Outgoing Long Wave Radiation at the tropopause, as corrected for radiation from the stratosphere after a stratospheric adjustment (which is technically what the formula determines), was calculated across a wide range of representative conditions for the Earth using a variety of radiation models, for different CO2 concentrations. Ideally, the conditions include calculations for each cell in a 2.5o x 2.5o grid (or equivalent) on an hourly basis, with a representative distribution and type of cloud cover, although a very close approximationg can be made using a restricted number of latituded bands and seasonal conditions. The results are then have a curve fitted to it, which provides the formula. The same thing can be done with less accuracy with Global Circulation Models (ie, climate models).
The basic result was first stated in the IPCC FAR 1990. That the CO2 temperature response (and hence forcing) has followed basically a logarithmic function was determined in 1896 by Arrhenius from empirical data. The current version of the formula (which uses a different constant) was determined by Myhre et al (1998). They showed this graph:

The formula breaks down at very low and very high CO2 concentrations.
- Mail on Sunday launches the first salvo in the latest war against climate scientists
nigelj at 06:07 AM on 8 February, 2017The following article discusses this NOAA temperature adjustment issue. It is very illuminating, and is from Carbon Brief, and is commentary by a scientist from Berkely Earth who are apparently one of the agencies who verified NOAAs work and reached essentially the same conclusions as NOAA by analysing the raw data in their own way. The article also has a discussion of this issue around buoys and ship intakes.
www.carbonbrief.org/factcheck-mail-sundays-astonishing-evidence-global-temperature-rise
I suppose it's possible (but as yet entirely unproven) that NOAA hurried publication, but the fact that their results have been verified by several other parties is the more important thing in my opinion.
- 2017 SkS Weekly Climate Change & Global Warming Digest #5
nigelj at 19:08 PM on 6 February, 2017Bruce @6
I think you are wrong about all of that. The whole thing is a beat up. I suggest you read the following article by Carbon Brief by a climate researcher from Berkely Earth. They have certainly replicated the NOAA temperature adjustments. You don't need NOAAs source code on their methods, just the raw temperature data.
www.carbonbrief.org/factcheck-mail-sundays-astonishing-evidence-global-temperature-rise
- 2017 SkS Weekly Climate Change & Global Warming Digest #5
bruce at 17:59 PM on 6 February, 2017For a start, the study has not been replicated by other researchers, how can it be when the original source code has been “lost” and NOAA now say the computer it was on failed and everything has been lost and it is impossible to replicate the original and the code was not backed up. How convenient!
NOAA has now decided to replace the sea temperature dataset just 18 months after it was issued, because it used “unreliable methods which overstated the speed of warming”.
The Karl dataset used upwards adjustments of readings from fixed and floating buoys to agree with water temperature measured by temperature affected ships manifolds. What blatant corruption.
US senate attempts to get all the relevant data on the how the dataset was created were arrogantly ignored by NOAA, knowing that the obama administration would protect them. But that is no longer the case and the coming months should be interesting as full details emerge of NOAA’s corruption.
- Temp record is unreliable
Tom Curtis at 16:08 PM on 28 January, 2017Bulthompsn @399, I am not aware of anybody here "blowing off" human error when discussing Global Mean Surface Temperature (GMST). Certainly the scientists who analyze it do not. Indeed, the take great care to analyze potential sources of error, and to quantify the resulting uncertainty in their estimate of GMST, as shown in this graph from the Berkely Earth Surfact Temperature project (BEST):
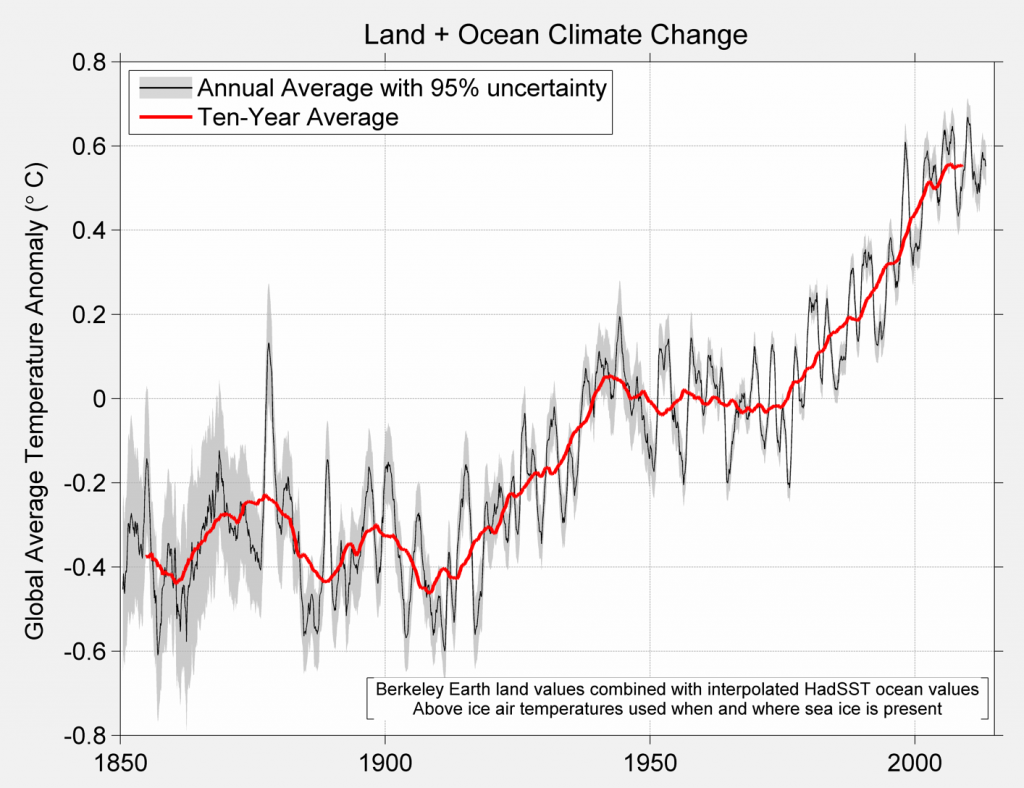
Note, that the grey shaded zone (the 95% confidence interval of the annual GMST estimate) shrinks rapidly from 1850 to 1880, and that post 1950 is very small relative to the decadal change in GMST. Other teams do not typically show uncertainty on the graphs, but do publish the uncertainty with the data and in scientific papers discussing methodology.
Nor are the satellite records more accurate than the surface records. That is not just my opinion, but that of Carl Meares, head of the team that produces the RSS satellite temperature records, who said:
"A similar, but stronger case [regarding trends] can be made using surface temperature datasets, which I consider to be more reliable than satellite datasets (they certainly agree with each other better than the various satellite datasets do!)."
(My emphasis, source)
This can be seen by comparing the size of the error in the trend estimate for RSS TLT vs HadCRUT4 for the period 1979-2012:
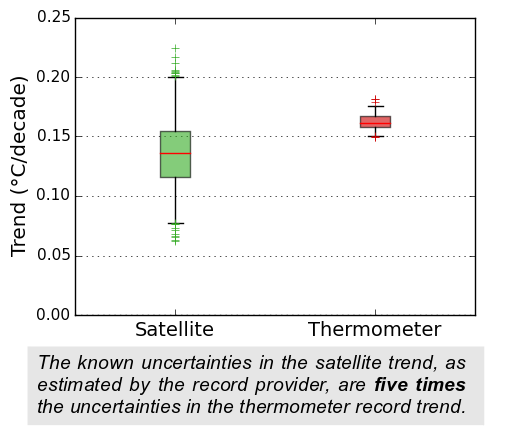
Indeed, the satellite record requires more adjustments from a more disparate original data set than is required for the surface record. This is something people pushing the accuracy of the satellite record never see fit to mention, but that it is the case is obvious when you have a look at (already partially adjusted) satellite data (top panel):
For further information see here, here, here, and here (the start of a four part series).
Finally, IMO, anybody who subscribes to a conspiracy theory of science ("This presumes that these current results are not being doctored") has thereby invalidated any claim they may have made to be informed, or rational on the topic.
- We’re now breaking global temperature records once every three years
Daniel Mocsny at 06:35 AM on 26 January, 2017Richard McGuire @7: in terms of what the average person needs to know, consider the analogy of investing for retirement. Some investment advisors tell their clients not to check the value of their portfolios every day, but rather to trust in the market fundamentals that guide an advisor's long-term investment strategy for the client. Stock prices fluctuate randomly from day to day and year to year, but all that really matters for the buy-and-hold investor is the long-term performance.
Our present response to the future threat of climate change does not depend on knowing precisely how much hotter the global average surface temperature was in 2016 over 2015. In the year 2050 nobody will care about that. Since we only have one available planet to inhabit, we are all long-term investors in its future. The average person needs to focus on the fundamentals, not the noise.
The challenge is to persuade people to give up something that gives them real, tangible value now, to avoid causing abstract harm to other people and other species in the future. For example, if someone takes a holiday flight to Cancun or Tahiti, s/he experiences undeniable and immediate hedonic rewards. The several tonnes of carbon dioxide equivalent s/he dumps into the atmosphere to get those rewards will go on incrementally heating the climate system for centuries.
It's similar to smoking cigarettes for short-term hedonic reward, except that with greenhouse gas pollution, it's like smokers giving cancer to someone else they've never met.
There's no way to mask this moral quandary with any combination of policies or rhetoric. To avoid wrecking the future, people today must change their values drastically, to get the average per capita carbon footprint below the globally equitable emission allowance. The rise of Trump reflects the average person's refusal to do this. Trump represents the interests of everyone who wants to keep flying to Cancun - or to a scientific conference, for that matter (instead of figuring out how to virtualize the conference).
Even in the liberal enclaves of California, Oregon, etc. nobody is shutting down the highways and airports. Given that a single long return flight causes a whole year's worth of allowed emissions for one person (leaving nothing for other activities such as eating), we can't have any flying if we want to stabilize the climate. We need many other equally drastic adjustments, but I focus on flying because it is one of the most egregious, least necessary, and least equal ways in which humans assault the climate. Flying is a good test case of our seriousness about mitigating climate change. It will be much harder to cut emissions from things everybody needs, such as agriculture.
The level of response we need isn't going to be motivated by figuring out whether last year was 0.12°C or 0.04°C hotter than the year before. By analogy, imagine trying to abolish lynchings or stonings by determining whether the victim dies in 345.4 seconds or 345.7 seconds. The only way to durably eliminate lynchings and stonings is to persuade people that participating in them is morally unacceptable. As Trump is showing, merely passing laws accomplishes nothing that the next election cycle can't destroy.
- We’re now breaking global temperature records once every three years
Tom Curtis at 12:31 PM on 24 January, 2017Richard McGuire @5, the four major surface temperature records show the following differences between 2015 and 2016:
GISTEMP LOTI 0.12 C
Berkeley Earth Surface Temperature LOTI 0.078 C
NOAA LOTI: 0.04 C
HadCRUT4: 0.013 C
Of these, NOAA and HadCRUT4 do not significantly cover polar regions, with HadCRUT4 also missing significant parts of Africa, the Middle East, and Australia. Apparently the Arctic was unusually hot, so that would account for the low values of those two relative to GISSTEMP and BEST. Further, BEST uses more stations, and probably has a better statistical technique than does GISSTEMP. NOAA and GISSTEMP use almost the same stations, with just a few extra for GISSTEMP, with GISSTEMP using the better technique; and HadCRUT4 has significantly less stations than the other three, and probably the worst technique.
Finally, each dataset has its own error margin. Further, at this stage each is liable to further, small adjustment as data from late reporting stations comes in. For both reasons, the figures should be considered as indicative rather than set in stone.
- NOAA was right: we have been underestimating warming
michael sweet at 22:48 PM on 7 January, 2017KGB,
All data has bias. Scientists work hard to collect the best data possible and then they review the data carefully to find any new biases that appear. There was never a "mistake" in this data. New data aways has to be compared with old to ensure it is exactly the same. In this case there was a very small difference. Since the difference was small it took some time to measure and correct it.
In this case, new bouys were put in place to monitor sea surface temperatures. iIt was known that parts of the ocean were not being monitored as well as could be done by the old method. The new data stream was added to the existing data stream. The old data was primarily from ships. The data was carefully compared when it was obtained and was very similar, so they were just added. After the passage of 15-20 years, much more data was collected. This data was carefully checked and a very small adjustment was made to the record. The old record was not bad but it turned out that the bouy data was very slightly colder than the ship data. It was determined that the ship data was slightly warmer than the ocean really was. Data sets are updated like this all the time. Usually no-one notices these changes because the data for surface temperature is so good that the adjustments are very small.
The reason that there has been so much talk about this particular update is because it contributes to the argument that there was never a "haitus" in global temperature rise. Tamino (who is a very good statistician) and many others have shown that there was never a "Haitus" in the original data set. The update makes Tamino's argument stronger, but the old data set never really showed a haitus in AGW anyway. Deniers complain because their incorrect argument has been affected by this change. They hope people will disregard all the data because of this minor update.
Scientists know that there remain minor issues with their data sets. They continue to review them and correct them. The corrections to the surface data set (the data set we are discussing) have been very small since around 1990. If you use the raw data (which is available on the internet) the increase in temperature is greater than using the corrected data. You reach the same conclusion. There was never a "haitus" in either data set.
We always have to use the data we have. Would you prefer to not correct for known issues in the collection of the data? Go with the raw data which shows much more warming. Scientists try to use the best corrections possible and keep in mind that there might still be some issues.
For comparison, major changes in the satallite data sets are made all the time. Deniers claim these data sets are better to use because they are noisier and it is harder to clearly show the warming.
Keep reading here and you will learn more about how to interpret data sets in the real world. Data is never perfect, but the surface temperature data set is very solid and has not had major changes for decades.
- There's no correlation between CO2 and temperature
HB at 01:18 AM on 29 December, 2016168. Tom Curtis
"In fact, the outgoing Short Wave radiation at the Top Of the Atmosphere is measured by the CERES instrument flown on the Terra and Aqua satellites. Together with Total Solar Irradiation (TSI) data from the TIM instrument, that allows the direct calculation of the energy balance and albedo as:
Energy balance = TSI/4 - (OLWR + OSWR)
Albedo = (TSI - 4 x OSWR)/TSI,
where OLWR is Outgoinging Long Wave Radiation, and OSWR is Outgoing Short Wave Radiation."
Then you can provide a reference where we can find an exact definition of albedo? With a description of the included parts and how much they each contribute to reflected radiation?
And how does it relate to the fact that more than 50% of TSI is IR that won´t be reflected?
"The upshot is that the adjustment to the albedo term in the energy budget amounts to approximately 3 W/m^2. HB instead describes it as a greater than 100 W/m^2 fudge."
TSI=1360W/m^2
After albedo=~960W/m^2
More like 400W.
I hope you are aware of that sunlight is much more intense than 340W/m^2?
Do you realise that there is a very large difference between reality where the sun heats the surface at an intensity between 700 and 1000+W/m^2, and your "budget" where you use 340W/m^2?
One is reality and one is your imagination. If the sun only would provide 340W, where is your heat pump connected to an indestructible heat source, that can add energy that isn´t there from the beginning?
I think it is you who need to provide references for your claims about how albedo is an exactly measured factor, with well known and well defined ingredients. While you are at it, provide a reference for the science showing how adding a cold gas to a hot surface can increase the surfacetemperature.
Otherwise you just have a correlation. There are lots of correlations to temperature rising the last century. I claim that increasing obesity in the states is the cause of global warming, it correlates nicely with the temperature. It is as valid as your co2-theory.
- Welcome to Skeptical Science
Tom Curtis at 15:50 PM on 27 October, 2016curiousd @27 and 28, I am fairly sure the formula you are using is incorrect. Unfortunately I am not sure as to the correct formula. The HITRAN database gives Sij and γair for each line, where Sij and γair are illustrated by this diagram:
The values given are for a reference temperature of 296 K, and 1 atmosphere pressure. S varies based on temperature, and γ based on temperature and pressure. As a result both Pierrehumbert in Principles of Planetary Climate (PoPC) and HITRAN give formulas for making the appropriate adjustment. For adjusting γ you use PoPC formula 4.61 and HITRAN formula 6. For adjusting S you use PoPC formula 4.62 and HITRAN formula 4. At least, that is as best I understand it. However, these formulas differ, probably based on assumptions about the shape of absorption pattern (shaded area above), which is not strictly known. There is a brief discussion of this in PoPC pages 227 and 228.
The actual absorption coefficient in each spectral line is not determined by S alone, but by S and γ as per formula 4.63 (PoPC) and HITRAN formula 10.
Even if I have misunderstood this, I am certain your formula is incorrect in not taking account of doppler and pressure broadening, which I understand to be very important.
At this stage I am again going to recommend you consult somebody with significant experience with these formulas.
- It's the sun
Bob Loblaw at 01:38 AM on 16 October, 2016I will try to keep this short for the moment, as it look as if BillN may be leaving.
BillN has made several assertions about space-based measurements of TSI. I have not been involved in any space-based measurements, but I have a dozen year of experience in ground-based measurements of direct beam solar radiation using Eppley HIckey-Frieden (HF) cavity radiometers, of identical type to those that have been used in space. [All Eppley HF radiometers are built to the same space-rated specifications. I can't point to a peer-reviewed article that says so, so in a scientific paper I would have to reference this as "John Hickey, personal communication". He's the "Hickey" in "HF"...]
Anyway, BillN has made several questionable assertions. I will respond to a few:
- He refers to "optical stability". In the Eppley HF, the only "optics" are a black cavity that is fully-exposed to sunlight - no glass, no optics to focus sunlight, just an exposed cone-shaped receiver. The important "optical" characteristic of this receiver is its absorption ratio (or reflectivity, if you prefer). If that were to change, then stability would be affected, but all that cavity does is absorb solar radiation.
- The radiometer also has a tube and calibrated orifice arrangment to limit the field of view. You may also call this "optics", if you like, but it's not as if there is a telescope or anything like that. It's much like limiting your field of view by holding a paper towel tube in front of your eye. It's fancier than that - black interior, etc., to limit stray light reflections, and a controlled area aperture at the end so that you get an exact field of view, but that's it.The view of the sun is completely unobstructed.
- The field of view of the Eppley HF is slightly larger than the diameter of the sun, so BillN's assertion in comment #1180 that "Even though the FOV (Field of View) of the instrument picks up only a small fraction of the solar disk..." is simply wrong for the Eppley HF. For ground-based measurements, this means that the instrument also views a bit of scattered sunlight around the sun, but in space this will not happen. There is no adjustment for seeing a portion of the solar disk, as BillN has stated.
- BiilN correctly refers to "active cavity radiometers", without explaning what they are. The Eppley HF can be operated either in active or passive modes. The principle of operation is that the cavity that absorbs solar radiation will heat up, which introduces a temperature gradient measured by a thermopile. In active mode, this heating is offset by an electrical heater, and by measuring the electrical heating rate you will know the solar heating rate. In passive mode, you measure the thermopile output caused by solar heating (no electrical offset), but periodically shade the instrument (no sun) and substitute a short period of electrical heating to check the calibration. The calibration results is used to convert the solar-heating output to irradiance. Ground-based observations using the HF will usually use passive mode (e.g. at the International Pyrheliometer Comparisons held every five years in Davos, Switzerland, where the World Radiation Reference is maintained. These IPCs (which have been happening since the 1960s) are a primary indicator of instrument stability in ground-based measurements.
So, stability of an HF instrument depends on the absorption in the cavity remaining stable, and the electronics that measure the electrical heating remaining stable. There are no other "optics" involved.
Rather than taking my word on any of this, HIckey, Frieden, and Brinker have reported on the stability of the Eppley HF after six years in space:
Report on an H-F Type Cavity Radiometer after Six Years Exposure in Space Aboard the LDEF Satellite
This is a 1990 paper, unforunately paywalled, but the abstract reports a 0.1% stability, but with a 0.1% uncertainty on that value. 0.1% of 1368 W/m2works out to less than 1.5 W/m2. After accounting for global abedo (30%) and dividing by 4 (area of sphere vs. area of circle), this leads to an uncertainty of less than 0.25 W/m2 in global absorbed solar radiation. Much less than the CO2 forcing.
BillN is wrong in implying that the developers of such instruments have not considered stability. Tom Curtis' post above also explains how examiniation of multiple instruments and multiple sources of analysis increases confidience in the readings of TSI.
In short, BillN's implied position of infallible authority on matters of spaced-based TSI measurements is fallible.
- Temp record is unreliable
MA Rodger at 00:40 AM on 12 October, 2016pink @391.
I think we can tell. Should I be concerned (as is Tom Curtis @393) that you seem to go all silent on assertions like "The 1930's was probably the peak of several hundred years of warming." or "There hasn't been a big volcano for a while- a few years from now they probably start going off due to solar minimums.. and the warming is erased."? Or should we forget about them, as you potentially have?
pink @392.
If I missed something relevant in that old NYT item, do say. If it did "demonstrate that over time the 'warming' keeps getting adjusted up in latter years and down in earlier years," then I'm afraid I didn't spot it.
I note you consider an adjustment to the RSS TLT V3.3 ocean temperatures (1997-2016) to be "very disturbing"? I would therefore strongly suggest you sit down and take a deep breath when RSS TLT v4.0 is eventually published. The effect of this adjustment you refer to is a massive +0.0023ºC/decade, well within the statistical confidence of the result. The conversion to v4.0 will likely have twenty-times that impact, or more. So be warned!!
- Temp record is unreliable
Tom Curtis at 23:52 PM on 11 October, 2016pink @388 again evades discussion of points that conclusively refute his claims on this site. Instead he launches of with a whole new lot of out of context factoids and a half baked theory of his own. I will continue once more responding to pink's game of "look, squirrel", but do request that the moderators constrain pink to actually responding to the points raised against his claims in this and prior posts, either by raising cogent and germane evidence, or conceeding the point.
1) pink's first new "argument" is to misrepresent a New York Times article of January, 1989. The Times article does indeed say that there were no significant trend temperature over the CONUS from 1895-1987. "No significant trend", is of course, not the same as no trend, or zero trend. It means only that whatever trend exists was not statistically significant. Indeed, the modern NOAA data over the same period shows an Ordinary Least Squares trend of 0.033 +/- 0.0324 C/decade (two standard deviation range). Given that the error margins based on standard deviations do not account for autocorrelation, if autocorrelation was included the trend would not be statistically significant. So, not only did NOAA scientists in 1989 think the 1895-1987 CONUS temperature trend was not significant, their modern counterparts would agree. In contrast, the 1895-2015 OLS trend is 0.076 +/- 0.0234 C/decade. That is clearly statistically significant, and would be so even allowing for autocorrelation. So, pink's outrageiously dated evidence is clearly irrelevant given that the full record disproves the apparent point.
Of course, the article also included caveattes that should have prevented the misuse of it by pink, as already quoted by MA Rodger @390. Indeed, it goes on from the quoted section to mention that the area of the CONUS is too small to be representative of global trends, and to mention that "... average global temperatures have risen by nearly 1 degree Fahrenheit in this century and that the average temperatures in the 1980's are the highest on record". Failing to mention the caveats on the CONUS data, and the global data actually reported in the article is definitely out of context quotation, something which in academic circles is tantamount to fraud.
pink then procedes to contrast the articles results with the modern pronouncements by NOAA (in 2014, 2015, and 2016) that each year has been successively, the hotest on record. He fails to note that the person making those pronouncements was Dr Thomas Karl, one of the authors of the research which he indirectly cites. Given the credence he gives to the research of Dr Karl in 1989, his refusal to accept Dr Karl's research in 2016 is a clear case of special pleading.
2) pink then mentions the satellited data, without mentioning that all TLT satellite series show a statistically significant positive trend from 1978-2016. The curious thing is that there are (at least) four satellite series, of which only the two with the lowest trends are commonly cited. They all use the same data, and all come up with different answers as to what the trend was. That is unsurprising because converting satellited data to a temperature series requires more, and more controversial adjustments of the raw data, than does the analysis of the surface temperature record. Thus it is no surprise that the five official (and about six unofficial) surface temperature records, using distinct but overlapping datasets, and different methods all come up with the same trends, while the various approaches to the satellite data fail to do so. It is with good reason that Dr Carl Mears (the author of one of the satellite data sets) has said, "I consider [surface temperature datasets] to be more reliable than satellite datasets (they certainly agree with each other better than the various satellite datasets do!)." pink, not being aware of the complexities involved, merely prefers that data which appears to best support his/her previously arrived at position.
3) pink then invokes Sunspots and Volcanoes (Oh my!). Let me first state that I believe MA Rodger to have misinterpreted the theory. By solar minimums, pink means such extended periods of low solar activity as the Maunder Minimum (c1645-1715), the Dalton Minimum (c1790-1830), and the Modern Maximum (c1950-2000):

Constraining ourselves to volcanic erruptions with a VEI of 6 or above, from 1600 onwards we have:
- Huaynaputina 1600 AD
- Kolumbo, Santorini 1650 AD
- Long Island (Papua New Guinea) 1660 AD
- Grímsvötn (Laki) 1783 AD
- Unknown 1809 AD
- Tambora 1815 AD (VEI 7)
- Krakatoa 1883 AD
- Santa María 1902 AD
- Novarupta 1912 AD
- Mount Pinatubo 1991 AD
(Underlined volcanoes occur durring a named minimum or maximum. Source)
In all, 5 out of 10 eruptions occcur durring a named minimum or maximum. In all, named minimums and maximums occupy 39% of the time from 1600-2015, and durring those named periods, 50% of VEI 6 plus eruptions during that period occurred. In short, there might be a slight statistical link between the volcanic eruptions and the data, but you could not prove it on this data. You certainly could not prove it with pink's data, which counts Laki and Krakatoa as being during named minimums/maximums despite the fact that they clearly are not.
I do not discount a solar minimum/maximum effecting the rate of volcanos. Any factor significantly changing the quantity of ice in glaciers and ice sheets, could by the resulting change in the Earth's rate of rotation, cause stresses in the Earth's crust making eruptions more likely. Of course, that applies to any factor significantly effecting climate, including the strongest recent impact, AGW. But this, of course, is just a possibility - not a proven theory. Even if true, the impact is minor; and as the strong warming through the 1990s, despite the Pinatubo erruption shows; any consequent volcanic effect is likely to cause only temporary slowdowns in the onset of global warming.
Despite this slight possible connection, pink's treatment of the situation is, at best, very bad science fiction.
- Temp record is unreliable
pink at 22:40 PM on 11 October, 2016and the point of using old articles and charts is to demonstrate that over time the 'warming' keeps getting adjusted up in latter years and down in earlier years.
This just came out, that animated gif is very disturbing.. it shows that even the satelite graphss are being 'adjusted'
https://wattsupwiththat.com/2016/10/10/remote-sensing-systems-apparently-slips-in-a-stealth-adjustment-to-warm-global-temperature-data/
- Temp record is unreliable
Tom Curtis at 10:03 AM on 10 October, 2016pink @379 thanks Eclectic and I for our extensive responses, and then proceeds to ignore nearly all of those reponses. In particular, he ignores the very clear evidence that Heller compares "apples to oranges", or more specifically, he compares a simple percentage of station data to a percentage of surface area covered. It is known that the meteorological stations in the US are not evenly distributed across the land mass, and that the regions of the 1930s warming are not those of the more recent warming in the CONUS. I repeat, "Not using percentage of land area rather than numbers of stations in making the comparison shows either an absolutely abysmal level of incompetence, or a very deliberate fraud." pink evidently wants to be party to either the incompetence or fraud, in his deliberate ignoring of this factor, even when it is brought to his/her attention.
He/she also persists without warrant in treating a percentage of stations (not area adjusted) exceeding an absolute temperature limit as a better proxy for Global Mean Surface Temperature than the actual GMST; and of treating the 1.58% of the Earth's surface represented by the CONUS as a better proxy of GMST than the mean surface temperature of the globe. He/she defends that last with some jingoistic nonsense about where did, and did not have significant temperature records in the 1930s. In fact, where did or did not have significant surface temperature records is a matter of record, and is well illustrated by a video from the Berkeley Earth Surface Temperature project:
As can easily be seen, every continent except Antarctica has significant coverage by 1880 (the reason GISS and NOAA start there temperature records at that time). Sea Surface Temperature records are also extensive by 1880, such that HadCRUT4 shows 30-37% global coverage in 1880, rising to 61-66% by 1930 and 75-81% by 1960. So, at its best, pinks argument is that we should use only the CONUS temperature record (not weighted by surface area) as the gold standard because the 30-37% coverage by HadCRUT4 in 1880 doesn't cover sufficient of the globe to be relevant. I am unconvinced of the coherence of his/her case.
pink is also certain that the adjustments in temperature records to account for changes in equipment, observation times and station moves cannot be rellied on, but will be (I am certain) equally unwilling to accept the unadjusted GMST record (red line):
- Temp record is unreliable
pink at 18:20 PM on 9 October, 2016OK thank you for the extensive reply. Basically what your saying is that he uses the unadjusted temps and the noaa has adjusted historical temperatures for "systemic errors" and other things. But I would be suspicious that these 'hot daily lows' you mentioned are the result of black asphalt, concrete etc. at night time. I have personally felt this effect, riding a motorcycle in a built-up tourest area(small town) in a hot climate I went back to my bungalow at about sometime after 2am. driving down a narrow road surrounded by vegitation, I'm wearing only T-shirt & suddenly it gets very cold, like i have to slow down because suddenly i'm freezing. I'm skeptical that these adjustments can ever be accurate when we're only talking about a degree or so since the 1800's.
The only solution seems to be to use only very consistent climate network instrumentation in area's that are far from any human activity for a long time.
What you said about this only being the USA. What skeptics are saying about that is most countries have not been in the business of measuring climate other than the USA. Czarist Russia did not see measureing 'climate change' as a priority, neither was the German Kaiser. Lawerence of Arabia and King Faisal did not battle the Ottoman empire and take temperature readings.
More than 100 comments found. Only the most recent 100 have been displayed.
More than 100 comments found. Only the most recent 100 have been displayed.


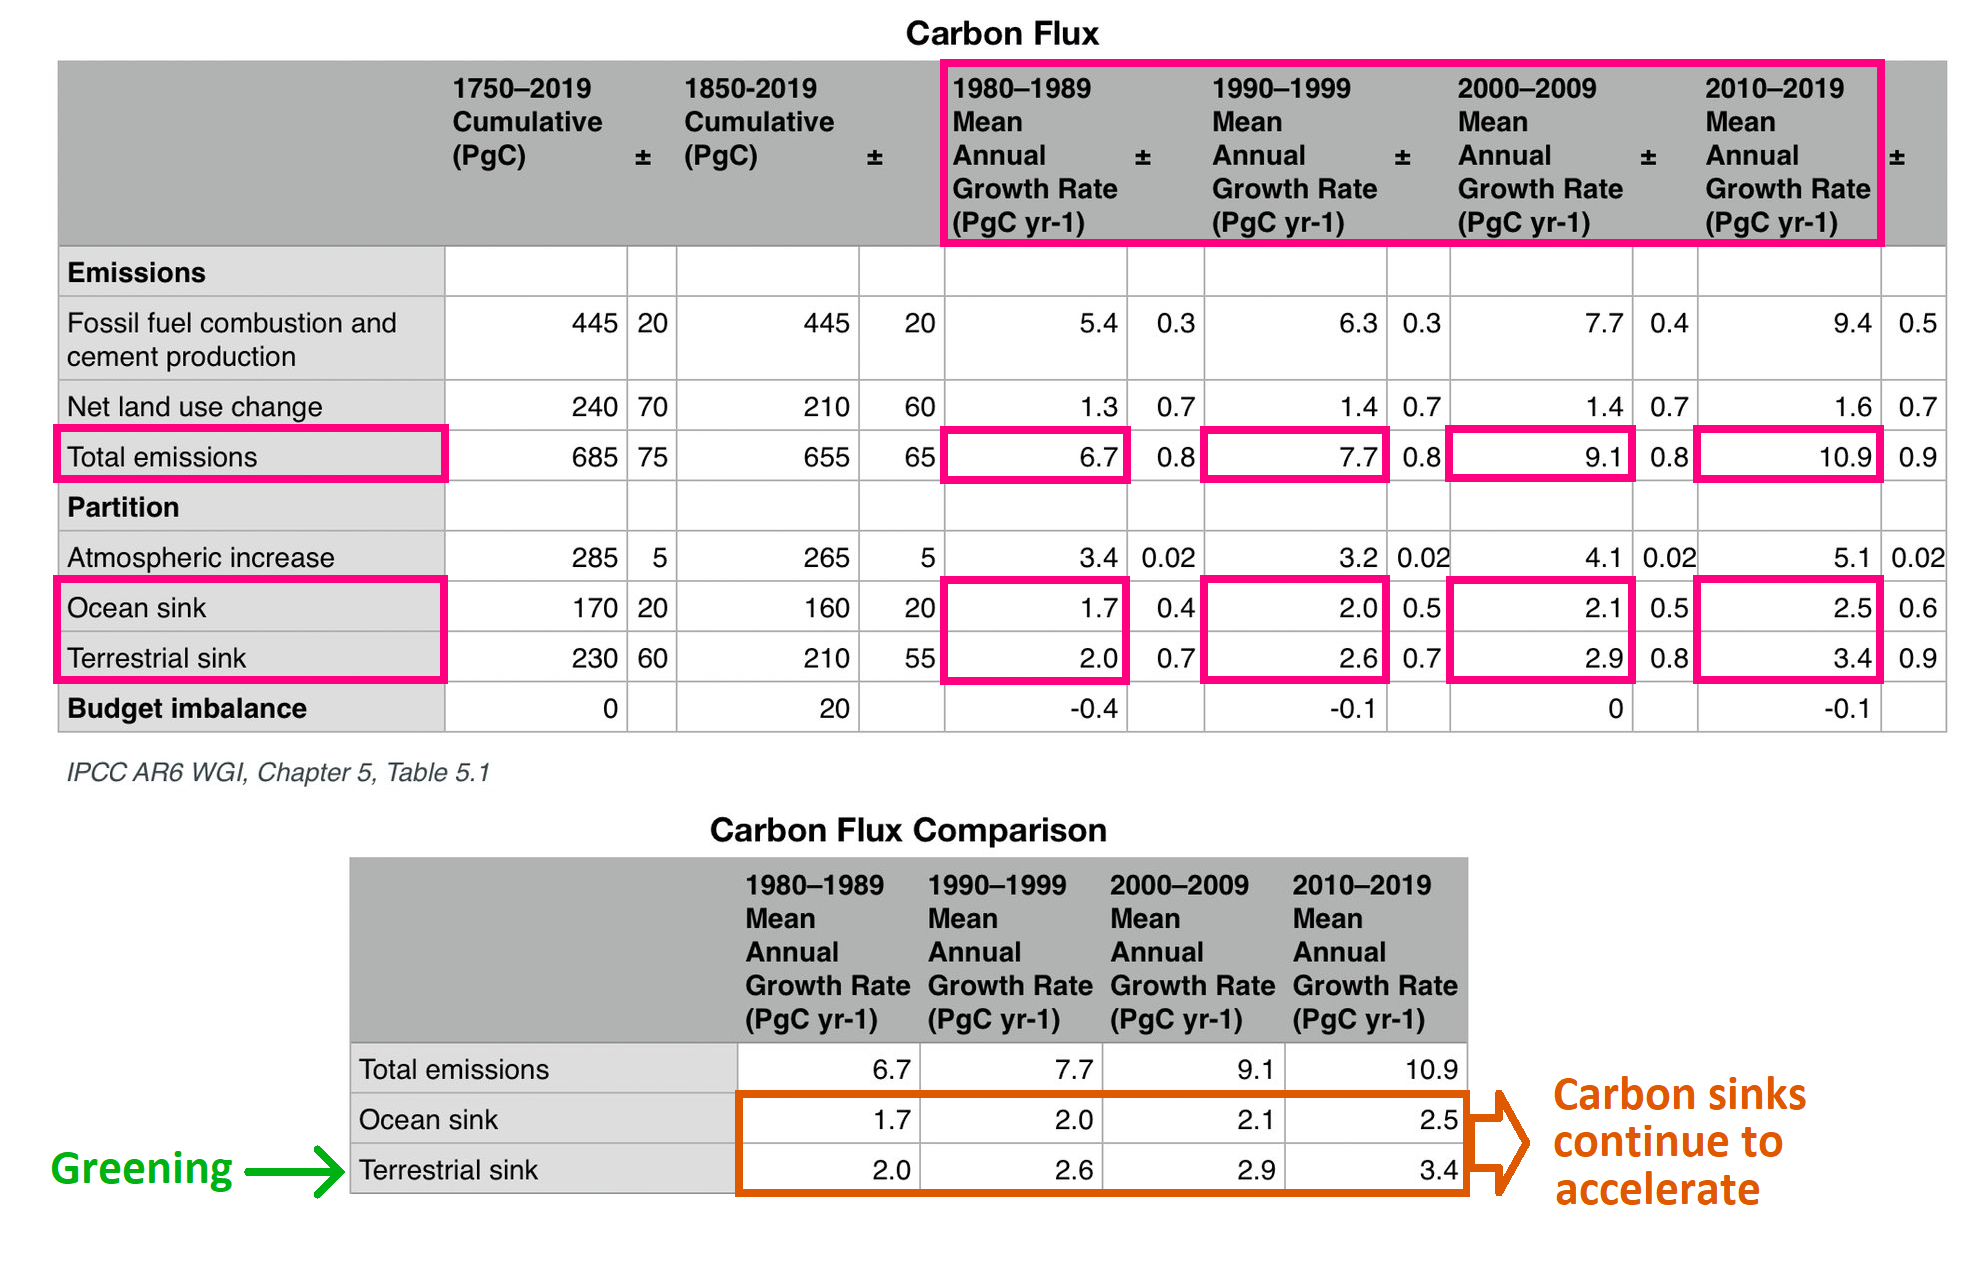
THE ESCALATOR

(free to republish)