


 Arguments


NOAA was right: we have been underestimating warming
Posted on 5 January 2017 by Zeke Hausfather, Kevin C
Assessing Recent Warming Using Instrumentally Homogenous Sea Surface Temperature Records
Zeke Hausfather, Kevin Cowtan, David C. Clarke, Peter Jacobs, Mark Richardson, and Robert Rohde
Summary
In a paper published in Science Advances, we used data from buoys, satellites, and Argo floats to construct separate instrumentally homogenous sea surface temperature records of the past two decades. We compared them to the old NOAA ERSSTv3b record, the new ERSSTv4 record, the Hadley Centre’s HadSST3 record, and the Japanese COBE-SST record. We found a strong and significant cool bias in the old NOAA record, and a more modest (but still significant) cool bias in the Hadley and Japanese records compared to buoy, satellite, and Argo float data. The new NOAA record agrees quite well with these instrumentally homogenous records. This suggests that the new NOAA record is likely the most accurate sea surface temperature record in recent years, and should help resolve some of the criticism that accompanied the original NOAA study.
Background
In the summer of 2015 researchers at NOAA led by Tom Karl published a paper in the journal Science arguing that global warming since 2000 had been underestimated, and that claims of a 'hiatus' in warming were therefore wrong. The paper proved quite controversial, and the chairman of the U.S. House of Representatives Science and Technology Committee responded by instigating an investigation against scientists at NOAA, demanding access to scientist emails and claiming that they had manipulated global temperature data.
The changes in the global temperature record presented by Karl et al resulted almost entirely from updates in ocean temperatures. Specifically, NOAA switched from using their old Extended Reconstruction Sea Surface Temperature Record (ERSST) version 3b to version 4. This new ERSST record had a number of changes, including adjustments for an offset in temperatures between ship engine room and buoy-based measurements, the use of nighttime marine air temperature measurements to detect problems in ship-based records, and an increased weight on buoy records in recent years. The old NOAA record, their new record, and the commonly used U.K. Hadley Centre HadSST3 record are shown in the figure below:
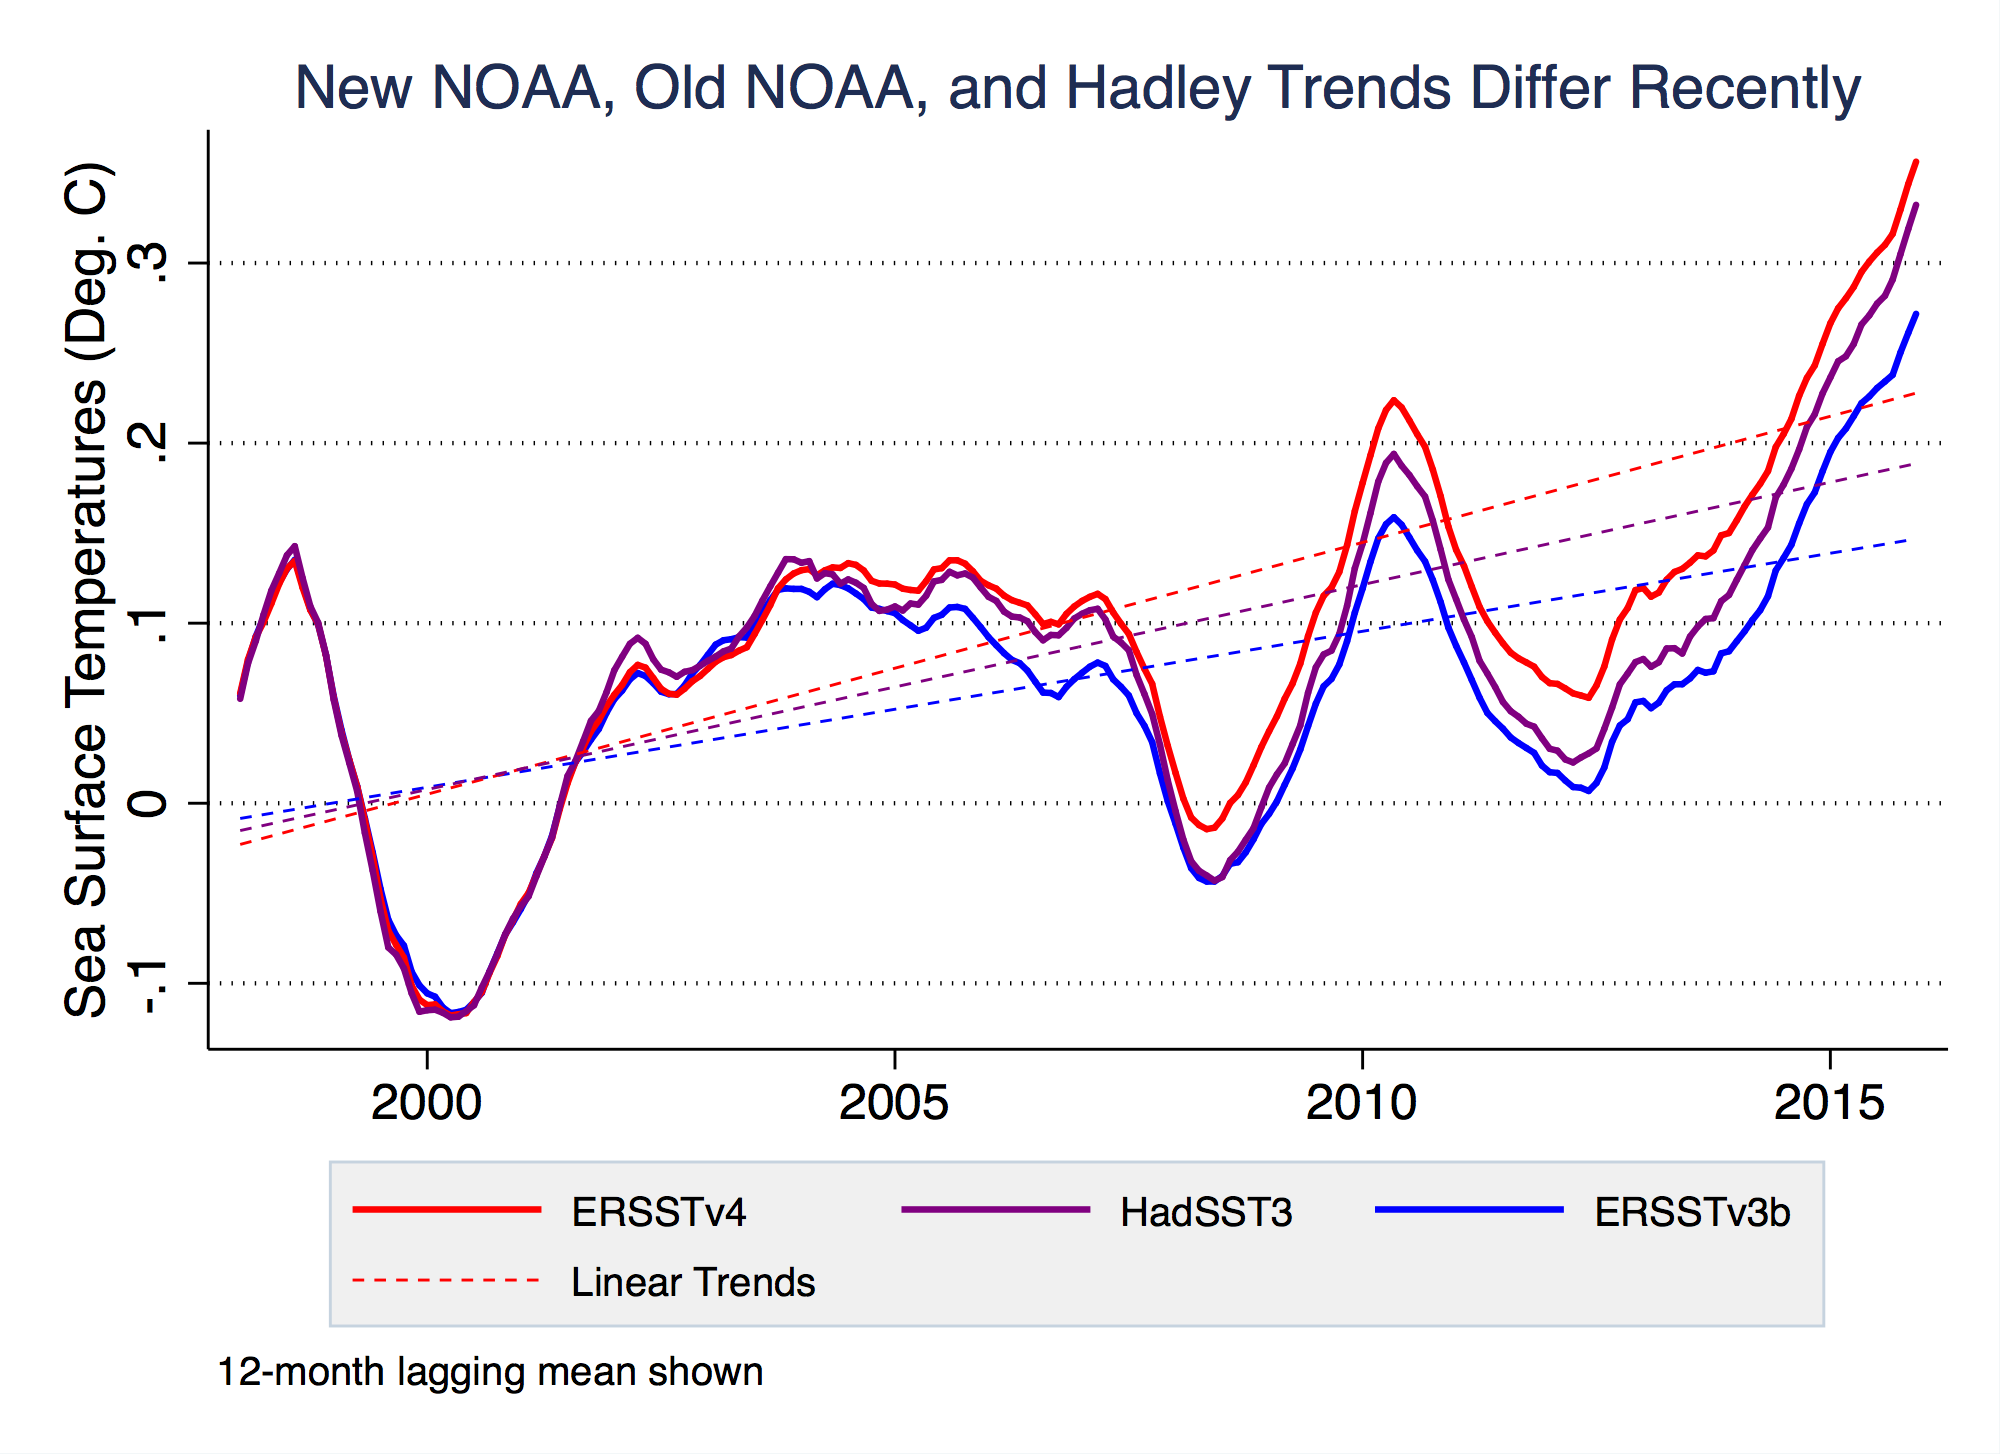
The new NOAA record shows nearly twice the warming over the past 18 years than the old NOAA record, and shows little evidence of any apparent “pause” or “hiatus”. It also shows significantly more warming than the Hadley Centre’s HadSST3 record. Both the new NOAA record and the Hadley record correct for the temperature offset due to the transition from ships to buoys (ship engine rooms are warm, and water piped into the engine room before the temperature is measured tends to be around 0.1°C warmer than water measured directly on the ocean surface by buoys), so other factors must be responsible for the difference between the two records.
Both Hadley and NOAA (as well as the Japanese COBE-SST record) are what we call composite records. That is, they try and take data from multiple different types of instruments that are changing over time and combine them in a single long-term climate record. This poses challenges when the way measurements taken change (e.g. switching from buckets thrown over the side of ships to engine room intake valves, or more recently from ships to buoys) and requires some judgment calls of how to calibrate each set of data and correct for any biases.
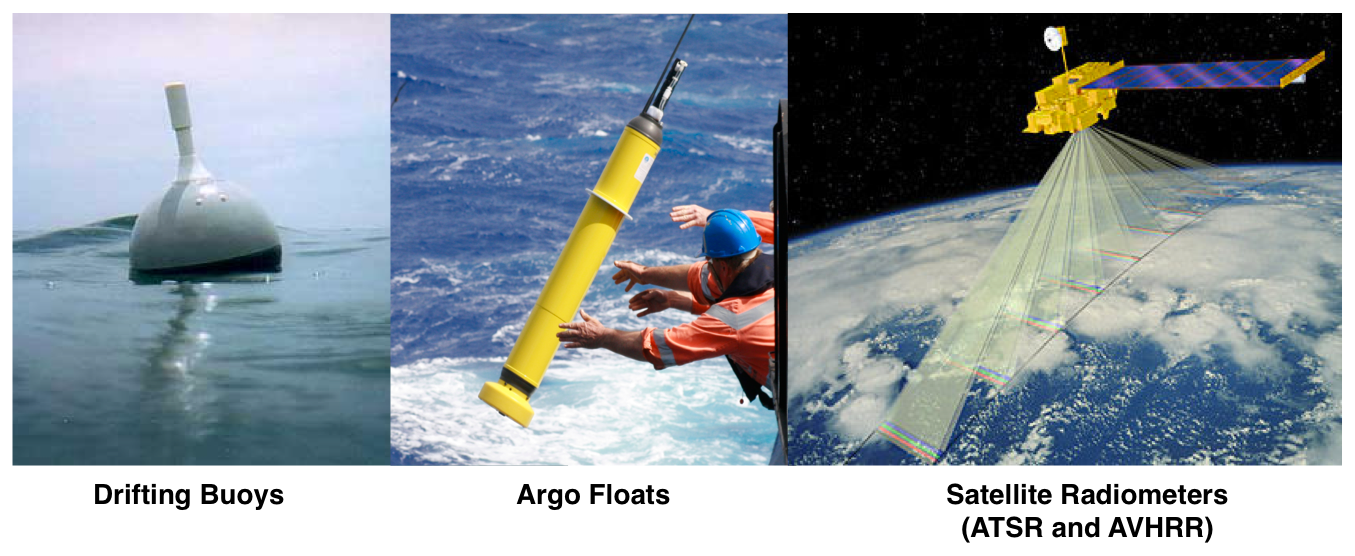
Thankfully, data exists that allows us to determine what is driving these differences and which of the three records is closest to the truth. Over the last two decades we have a wealth of measurements available of ocean temperatures, including data from buoys, satellite radiometers, and Argo floats. We use these to construct what we term Instrumentally Homogenous Sea Surface Temperature records; that is, records created only from one type of instrument: only from buoys, only from satellites, and only from Argo floats. These instrumentally homogenous records have the benefit of requiring little adjustments or calibrations, as they all come from the same type of instrument.
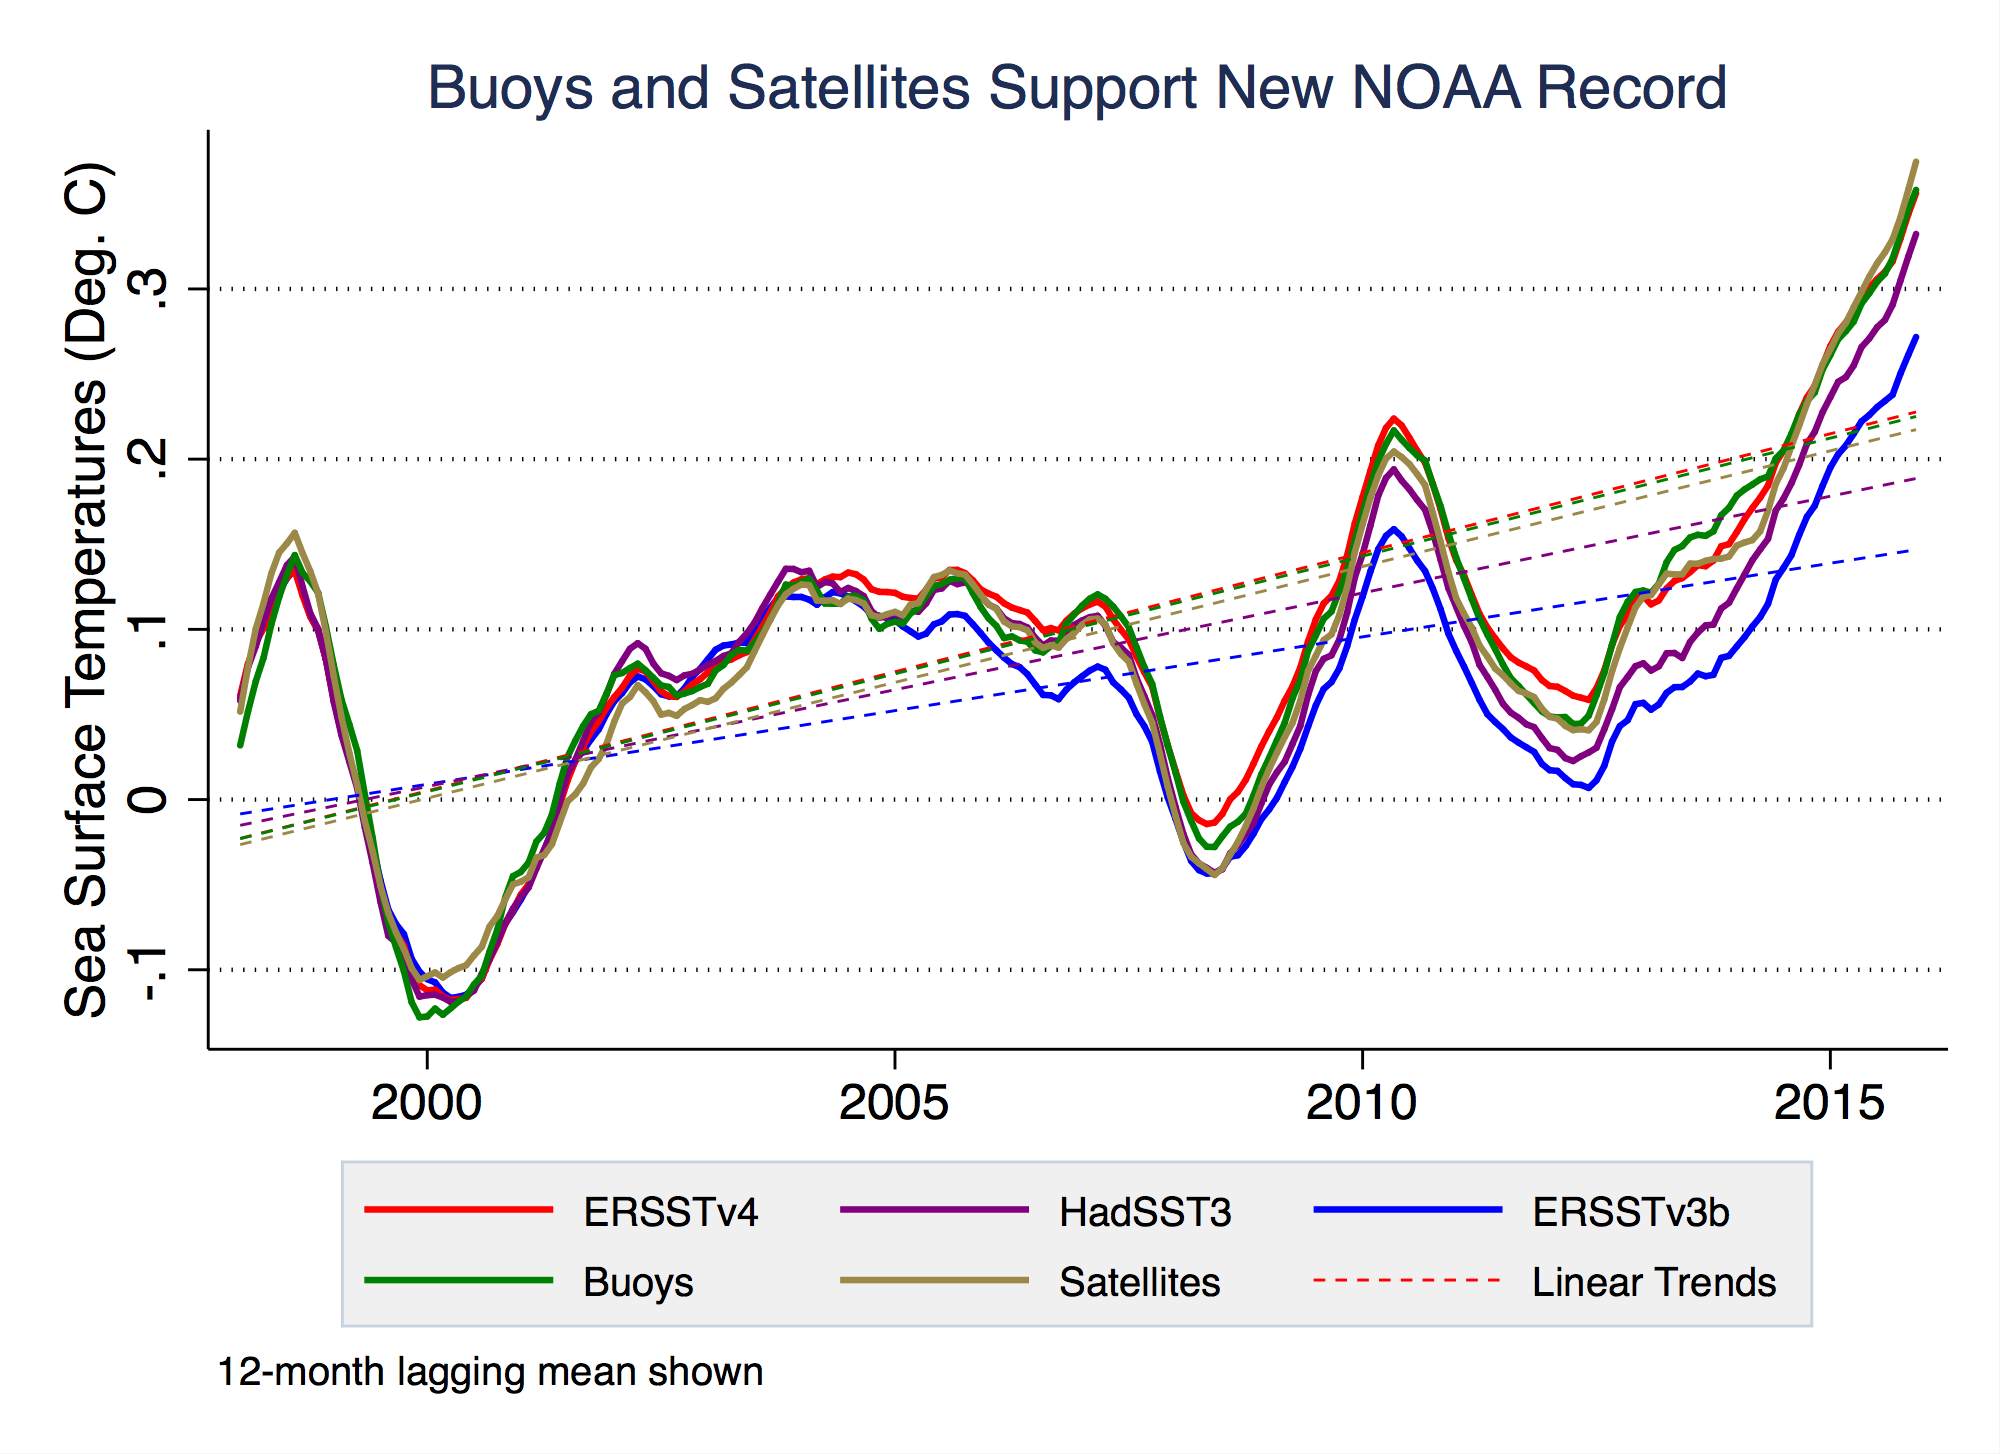
The buoy-only and satellite-only records we use span the period from 1997 to the end of 2015. Over that period their global average sea surface temperature records agree nearly perfectly with the new NOAA record, and show a strong cool bias in the old NOAA record and a more modest (but still significant) bias in the Hadley record:
We can also see this if we look at the trends in the differences between buoy, satellite, Argo records and the four composite sea surface temperature records (old NOAA ERSST v3b, new ERSST v4, Hadley’s HadSST3, and the Japanese COBE-SST). In the figure below a value of zero means that the instrumentally homogenous record agrees with the composite record; a value below zero means that the composite record has a cool bias:
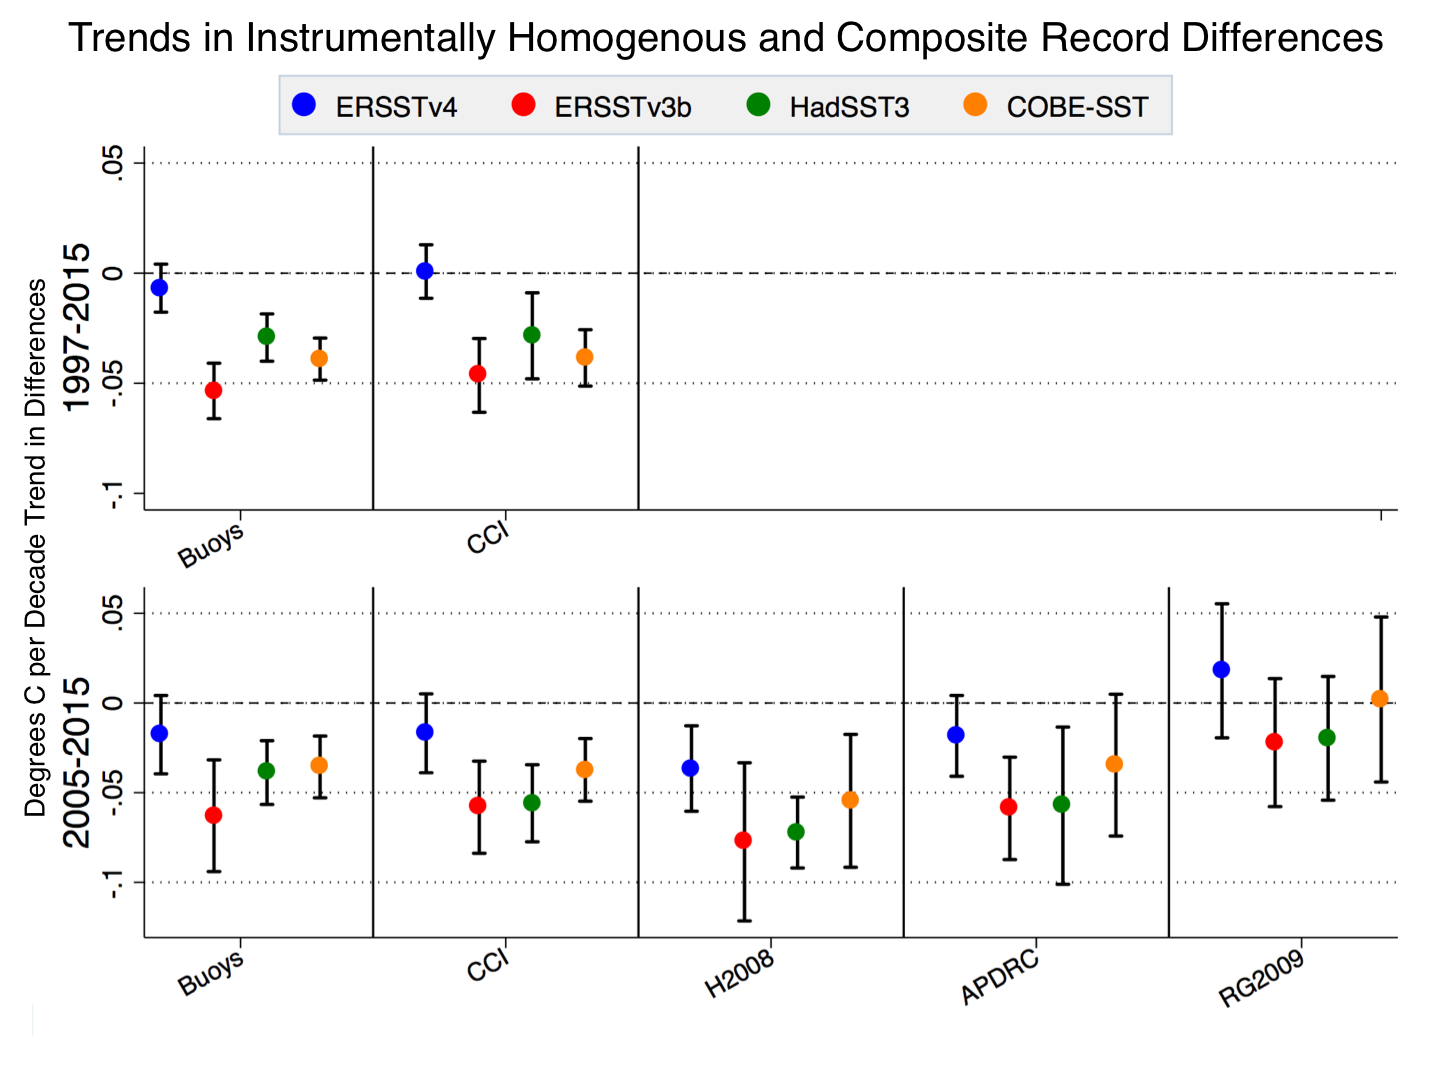
From 1997-2015 buoys and satellites (CCI) both agree quite well with the new NOAA record and show a significant cool bias in the other composite records. From 2005-2015 (when the Argo data is available), buoys, CCI, and two of the three Argo-based records examined (H2008 and APDRC) either agree with the new NOAA record or show a slight cool bias in the new NOAA record, and show cool biases in the other three composite records. The third Argo-based record examined, RG2009, has more ambiguous results.
About half of the difference between the old and new NOAA records can be explained by the inclusion of an adjustment for the temperature differences between ship engine room and buoy measurements. Hadley, which includes this adjustment, has a trend about half way in between the old and new NOAA records. However, Hadley weights ships and buoys equally in their reconstruction, while NOAA assumes that buoys are more accurate and gives them more weight when they are in the same area as ship records. It turns out that buoys and ships both have an absolute offset in measured temperature and show warming at different rates. The figure below shows the buoy-only record in green and a record using only data from ships in red:
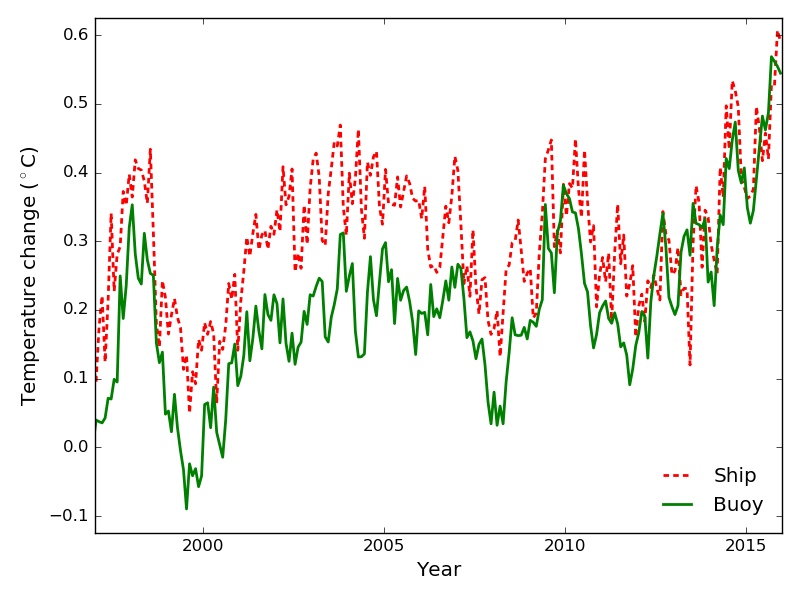
While buoys all use the same instrument type and are largely unchanged over the past two decades (apart from more buoys being deployed), the same is not true for ship-based measurements. The depth of the hull, the speed of ships, and the type of ships have all changed over the past two decades. The number of ship measurements have also fallen by about a third over this period. Theses changes appear to have introduced a spurious cool bias in the ship records that impacts Hadley’s record, but that the new NOAA record mostly avoids by putting more weight on the higher quality (and more homogenous) buoy record.
Here we undertook an effort to independently evaluate the new NOAA ERSSTv4 sea surface temperature record using data from buoys, satellites, and Argo floats. We found that NOAA’s new record effectively corrects a significant cooling bias present in their old record during the past two decades without introducing any detectable residual trend bias. We also concluded that two other widely used composite SST series, HadSST3 and COBE-SST, likely suffer from spurious cooling biases present in ship-based records in recent years. Overall, these new instrumentally homogenous results support the view that the updated NOAA record is the most accurate composite estimate of global SST trends during the past two decades. Consequently, our work reinforces previous findings that the rate of recent warming had been underestimated.


Nice way to start the new year, with some proper science.
Why are there 3 Argo records and why are they different?
One concern I have with how these studies are communicated in the press and in blogs, is the use of the terms 'cooling bias' in previous NOAA datasets. This basically tees up the ball for the denial crew to use those quotes and words in claiming 'funny business' with the data.
I think it is more clear to the layperson and to the press to simply explain that older ship-based engine room data imposed an 'artificial warming' bias on the older data, by a small amount. When datasets were shifted over to buoys, that older 'artificial warm' bias disappears, which is the reason things 'looked cooler', because that superimposed warmer data was no longer used. We went from a dataset which should have had a small temperature correction subtracted from it, to one that did not need that correction. Almost like an LP record 'skipping back a track' when the data were switched from one source to another.
Thus, for decades prior to buoy use, we were unknowingly and slightly overestimating the warming, up until the late 1990s, because the engine room data were not corrected properly. With the new correction, "the LP record no longer skips" and ALL of the datasets are better harmonized. And you can easily see with the updated corrections, the 'LP record skip is now gone'.
So, this is really more a correction to the 'older' datasets (in absolute temperatures) than to the 'new' datasets. Maybe explaining the data in 'absolute' temperature measurements instead of 'deltas' would help, too....
Cooper13, anything and everything will be seized by some as opportunities to claim that the data are unreliable, regrdless of the vacuity of the argument. We live in a post reality, post information world that is no better connected to reality than the melanesian cargo cults. There is nothing that can be done to prevent some to make noise about the unreliability of this or that; the noise itself is their goal and achievement.
The earth is warming but its about to stop and start cooling. Actual science suggests that earth is headed for a mini ice age. CERN found that cosmic rays play more of a roll in climate than anything else. The sun was at its maximum and is now entering the minimum. Volcanic activity is higher than it ever has been.
https://regmedia.co.uk/2009/11/16/sven_northernhemi.jpg
This is a link showing the data for the past 2000 years. We have not even reached a warming point that we were at 2000 years ago. Humans had 0 effect on climate then. If you are going to promote global warming you need to think of better lies than that. I am a real scientist I study the data itself. I dont rely on some 'Expert' to interpret the data for me.
[JH] Link activated. Inflamatory accusation of deception snipped.
Please note that posting comments here at SkS is a privilege, not a right. This privilege can be rescinded if the posting individual treats adherence to the Comments Policy as optional, rather than the mandatory condition of participating in this online forum.
Please take the time to review the policy and ensure future comments are in full compliance with it. Thanks for your understanding and compliance in this matter.
Zeke, Kevin this is why your charts only go back the past 20 years. Because thats the only way your "Evidence" shows any credibility at all. Amateurs
[JH] Inflamatory statements of deception snipped.
You are already on the cusp of relinquishing your privilege of posting on this website. Three strikes and you are out.
Warning #2
Please note that posting comments here at SkS is a privilege, not a right. This privilege can and will be rescinded if the posting individual continues to treat adherence to the Comments Policy as optional, rather than the mandatory condition of participating in this online forum.
Moderating this site is a tiresome chore, particularly when commentators repeatedly submit offensive or off-topic posts. We really appreciate people's cooperation in abiding by the Comments Policy, which is largely responsible for the quality of this site.
Finally, please understand that moderation policies are not open for discussion. If you find yourself incapable of abiding by these common set of rules that everyone else observes, then a change of venues is in the offing.
Please take the time to review the policy and ensure future comments are in full compliance with it. Thanks for your understanding and compliance in this matter.
Echo_Alpha_Zulu @4 claims, "I am a real scientist I study the data itself"; but he does not present us with this data, only a graph from a non-peer reviewed paper from 2008. Of that graph he says, "This is a link showing the data for the past 2000 years", but the data only covers the period 1000 to 2000 AD, ie, the last one thousand years, not the last 2000 as he would have it.
Further, on the basis of that graph, he then claims, "We have not even reached a warming point that we were at 2000 years ago". The graph, however, compares three proxy series to the instrumental record (red), and of those three series, the most recent date on the instrumental series is greater than any value over the last 1000 years. His claim is only valid, therefore, if the strictly regional Greenland ice sheet data gives a better presentation of hemispheric temperatures than do proxies from across the hemisphere. What is worse, the instrumental series used (HadCRU Nothern Hemisphere) shows an anomaly of 1.041 C for 2016, with all annual anomalies from 2001 forward being 0.554 C or higher. That is, for the last 16 years NH temperatures have been 0.2 C or more higher than the greenland ice core data peak around 1000 AD. Indeed, you have to go back 20 years to 1996 to get a NH temperature as low as the peak shown by the Greenland data. So when Echo_Alpha_Zulu says "We have not even reached a warming point that we were at 2000 years ago" he is contradicting the data he presents.
Of course, he may well not be aware of that, given that he bases his analysis on eyeballing graphs rather than the actual data itself.
Of couse, a real scientist, ie, somebody with an advanced degree in science who works professionally in the field, and actively publishes in the literature, would know not to make that mistake. Echo_Alpha_Zulu's claim to be a "real scientist" is therefore revealed as a falsehood used (ironically) to plump up his authority lest we should look at the data ourselves.
First off let me start off by saying this graph was provided by the scientists at CERN. Im not invalidating your data because it is correct. According to borehole samples collected from Greenland only temperature anomolies still have not increased to what they were 2000 years ago. I am not invalidating your data as it is correct it is just misleading. Even the past 400 years temperatures have been at a steady incline. I do not argue that. The point I am making is that this warming period has little to do with us. It would have happened even if humanity didnt exist. Just like the upcoming mini ice age. There are multiple naturalally occuring events that directly impact our climate. The sun, Cosmic Rays, Volcanic and seismic activity and Pole instability. A single major Volcanic eruption can put more CO2 and other "greenhouse gasses" into the atmosphere than humanity has done it's entire existance this is a fact. The sun is now just exiting one of the most violent maximums ever recorded in history. Fewer sun spots but the amount of energy released from CME's and solar flares was something we have never seen. Now we are entering a solar minimum. Which is expected to be one of the weakest since the maunder minimum or last mini ice age.
Prior to the maunder minumim we see an increase in Volcanic activity paired with a decrease in solar activity. This is the exact scenario we are facing now.
Nothing I said was contradictary. I have done a significant amount of research on the topic and my data even though provided by CERN is apparently not satisfactory so I will ask you to provide us with a chart of temperature records over the past 2000 years. This way you can not blame me for not having peer reviewed material. I will be more than happy to elaborate on any of the points I just made.
[JH] The many assertions contined in your post lack proper references and supporting documentation. Your personal beliefs carry little weight on this site.
Echo, you wrote "I will ask you to provide us with a chart of temperature records over the past 2000 years." Okay--see the post on the Medieval Warm Period. After you read the Basic tabbed pane, read the Intermediate one. For more information about the PAGES 2K study that is cited and graphed there, see a post on that. If you want to discuss those topics, do so in the comments on those or similar posts, where your comments will be on topic.
Echo, you wrote "Just like the upcoming mini ice age....The sun is now just exiting one of the most violent maximums ever recorded in history. Fewer sun spots but the amount of energy released from CME's and solar flares was something we have never seen. Now we are entering a solar minimum. Which is expected to be one of the weakest since the maunder minimum or last mini ice age."
In fact, the amount of cooling that would result even if there is a reduction in solar output similar to that of the Maunder Minimum would be zero--no cooling, because the rise in warming from greenhouse gases would swamp the cooling from lower insulation. All it would do is temporarily and slightly reduce the rate of warming. See the post on the effect of a grand solar minimum. If you want to discuss that topic, do so in the comments on that post where it is on topic, not this one.
Echo, you wrote "A single major Volcanic eruption can put more CO2 and other "greenhouse gasses" into the atmosphere than humanity has done it's entire existance this is a fact."
But no, that is not a fact, it is a myth. See the post about that (Basic tabbed pane, then Intermediate one), and if you want to comment on that topic, do so there, not here.
Echo, you wrote "CERN found that cosmic rays play more of a roll [sic] in climate than anything else."
You are incorrect. See the post about that, both Basic and Intermediate tabbed panes. For more thorough and more up to date information about cosmic rays' influence on climate (not just CERN results in particular), see the Basic, Intermediate, and Advanced tabbed panes on the post about that. And if you want to discuss those topics, do so in the comments on those posts, not this one.
Echo, for information about the Sun's role in recent warming (not just how a grand solar minimum would affect temperature), see the post about that--Basic, then Intermediate, then Advanced tabbed panes. Comment on that topic there, not here.
Echo, for global temperatures extending far earlier than the previous 2,000 years, see the post on "the wheelchair" graph.
Echo Alpha Zulu @7 says:
"According to borehole samples collected from Greenland only temperature anomolies still have not increased to what they were 2000 years ago. I am not invalidating your data as it is correct, it is just misleading."
Echo, Greenland is just one place, and could be an anomaly as different places change at different rates. You have to look at a wide selection of countries, and reach an average. Many studies of the medieval warm period do this, and find it was a weak event, eg Briffa, Esper, Jones. Unfortunately it is your post that is misleading.
Echo_Alpha_Zulu

Aside from generally following Tom Dayton's advice and looking at the various rebuttals, here is some actual data relating to your claim about volanoes and CO2. From the World Data Centre for Greenhouse Gases, run by the Japanese Meteorological Agency here.
Measurements of CO2 from Cape Grim in Tasmania. 1992 was one of the biggest volcanic eruptions this century - Mt Pinatubo in the Philippines.
Spot the huge volcanic spike EOZ? No trace, nada of a volcanic component.
You state that the old data has a cold bias so scientists data was off, how could the scientific community make this mistake and how are we suppose to know they haven't made another mistake?
Echo_Alpha_Zulu, I have discussed your views on cosmic rays on a more appropriate thread. I also recommend you read the advanced version of the main article on that thread, in addition to the first link by Tom Dalton @11.
KGB,
All data has bias. Scientists work hard to collect the best data possible and then they review the data carefully to find any new biases that appear. There was never a "mistake" in this data. New data aways has to be compared with old to ensure it is exactly the same. In this case there was a very small difference. Since the difference was small it took some time to measure and correct it.
In this case, new bouys were put in place to monitor sea surface temperatures. iIt was known that parts of the ocean were not being monitored as well as could be done by the old method. The new data stream was added to the existing data stream. The old data was primarily from ships. The data was carefully compared when it was obtained and was very similar, so they were just added. After the passage of 15-20 years, much more data was collected. This data was carefully checked and a very small adjustment was made to the record. The old record was not bad but it turned out that the bouy data was very slightly colder than the ship data. It was determined that the ship data was slightly warmer than the ocean really was. Data sets are updated like this all the time. Usually no-one notices these changes because the data for surface temperature is so good that the adjustments are very small.
The reason that there has been so much talk about this particular update is because it contributes to the argument that there was never a "haitus" in global temperature rise. Tamino (who is a very good statistician) and many others have shown that there was never a "Haitus" in the original data set. The update makes Tamino's argument stronger, but the old data set never really showed a haitus in AGW anyway. Deniers complain because their incorrect argument has been affected by this change. They hope people will disregard all the data because of this minor update.
Scientists know that there remain minor issues with their data sets. They continue to review them and correct them. The corrections to the surface data set (the data set we are discussing) have been very small since around 1990. If you use the raw data (which is available on the internet) the increase in temperature is greater than using the corrected data. You reach the same conclusion. There was never a "haitus" in either data set.
We always have to use the data we have. Would you prefer to not correct for known issues in the collection of the data? Go with the raw data which shows much more warming. Scientists try to use the best corrections possible and keep in mind that there might still be some issues.
For comparison, major changes in the satallite data sets are made all the time. Deniers claim these data sets are better to use because they are noisier and it is harder to clearly show the warming.
Keep reading here and you will learn more about how to interpret data sets in the real world. Data is never perfect, but the surface temperature data set is very solid and has not had major changes for decades.
Further to Echo_Alpha_Zulu @7:
1) Echo_Alpha_Zulu, in a confused passage, says that he won't dispute my data because it is correct, but then disputes that current NH temperatures are greater than those shown for circa 900 AD (he continues to insist the graph shows temperature 2000 years ago); and that furthermore my "correct" data is misleading because:
Here is the graph in question:
First, it is evident from that graph that the Greenland borehole data shows an increase in temperature, followed by a sharp decline until about 150 years ago. The "hockey stick" (Mann Bradley and Hughes 1999) shows declining temperatures until about 130 years ago. The "multi-proxy" (Moberg 2005) shows essentially flat temperatures, with a sharp rise starting about 1850. Finally, the instrumental record (HadCRUT3) shows declining temperatures from 1860-1900, a sharp rise to the 1940s, followed by a plateau for about thirty years followed by another sharp rise. The only "steady incline" over 400 years is from the "worldwide boreholes" (Pollack and Smerdon 2004), but that is because conduction within the rocks smooths out the signal so that no detailed signal can be expected. In short, Echo_Alpha_Zulu's claim to find a "steady incline" over 400 years comes in complete disregard of the information he himself presented.
It also disregards more recent multi-proxy temperature reconstructions such as the Mann (2008) global EIV reconstruction:
That, again, shows effectively flat temperatures from 1600 to 1900. Echo_Alpha_Zulu's "steady incline" in temperature over 400 years is a fiction.
Second, as already noted that HadCRUT4 temperature for the Northern Hemisphere "... shows an anomaly of 1.041 C for 2016, with all annual anomalies from 2001 forward being 0.554 C or higher". That is much more than the 0.3 C increase of the scaled ice bore temperatures (Left hand side of the graph). It is not more than the unscaled values (Right hand side), but the unscaled values differ between the two bore holes. That emphasizes the point that these are purely regional records, not agreeing in absolute value of change even between two fairly close locations in Greenland. So, if Echo_Alpha_Zulu insists that is the relevant scale, he needs to point out why we should expect Northern Hemisphere temperatures to match particular, different regional values. Failing that, his refusal to accept the actual data showing NH temperatures to be 0.2 - 0.7 C greater than the scaled borehole temperatures as showing they are in fact greater shows him to be in simple denial of the actual data which he vaunts himself on consulting.
2) Echo_Alpha_Zulu says:
In fact the (possibly) most recent Solar Maximum had the lowest energy output of any since instrumental records of Total Solar Insolation began. That, however, is not what Echo_Alpha_Zulu is discussing. He limits the discussion to solar flares and Coronal Mass Ejections only. Unfortunately it is difficult to get direct information on that. Wikipedia states:
Note, however, that the solar flares from preceding solar maximum were far more energetic than those currently. Further, wikipedia is also clear that the largest flare observed was the September 1, 1859 Carrington event, a flare so large it was visible to the naked eye.
Given this, Echo_Alpha_Zulu's claims are at best, unsupported, and likely false. Absent his citing and linking to a credible source for this claim, I think we should regard it, as so many others of his claims, as so much spindrift.
(Note: I say "possibly" because it is not yet certain we have reached the maximum.)
From the Comments Policy:
Given that, and given that Echo_Alpha_Zulu/Echo_Alpha_Delta is using at least two accounts, I will not respond to his comments until the moderators have determined to what extent he is violating the comments policy, and the appropriate course of action.
[JH] All of the comments that Echo_Alpha_Delta has posted have been deleted because he/she is a sock puppet of a person who has been banned from posting on this site. All future posts of Echo_Alpha_Delta will be summarily deleted until his/her new identity is banned.