Climate Science Glossary

Term Lookup

Enter a term in the search box to find its definition.

Settings

Use the controls in the far right panel to increase or decrease the number of terms automatically displayed (or to completely turn that feature off).

Term Lookup

Settings


All IPCC definitions taken from Climate Change 2007: The Physical Science Basis. Working Group I Contribution to the Fourth Assessment Report of the Intergovernmental Panel on Climate Change, Annex I, Glossary, pp. 941-954. Cambridge University Press.

Home Arguments Software Resources Comments The Consensus Project Translations About Support

Twitter Facebook YouTube Mastodon MeWe

RSS Posts RSS Comments Email Subscribe


Climate's changed before
It's the sun
It's not bad
There is no consensus
It's cooling
Models are unreliable
Temp record is unreliable
Animals and plants can adapt
It hasn't warmed since 1998
Antarctica is gaining ice
View All Arguments...


Username
Password
New? Register here
Forgot your password?

Latest Posts

Archives

2011 Year in Review (part 1)

Posted on 31 December 2011 by MarkR

Dramatic Events

Dramatic events grab headlines, and in the 2011 weather & climate sections of newspapers we've seen walls of fire burn across the American south, heartbreaking stories of Texan farmers losing their livelihoods to a record-breaking one year drought combined with record-breaking heat, tragedy across the midwest as a super active tornado season tore apart towns and massive flooding across the eastern states as record-breaking snowmelt combined with storms pounding the coast.

The US grabbed most of the news thanks to a record-breaking number of billion dollar weather disasters, but there have been weather & climate tragedies elsewhere: East African drought has caused the first UN announced famine in Africa in 30 years, heavy floods in Thailand have caused politicians there to suggest moving the capital (as well as rising seas, Bangkok is sinking into the ground) and scientists from Environment Canada have said that for the first year recorded, it was not a white Christmas for most Canadians.

Hell and high water?
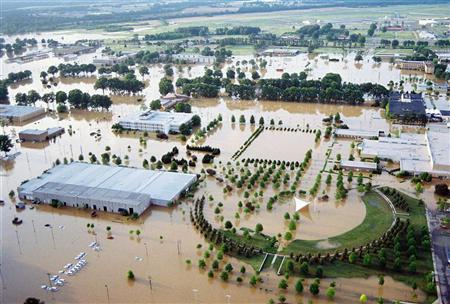
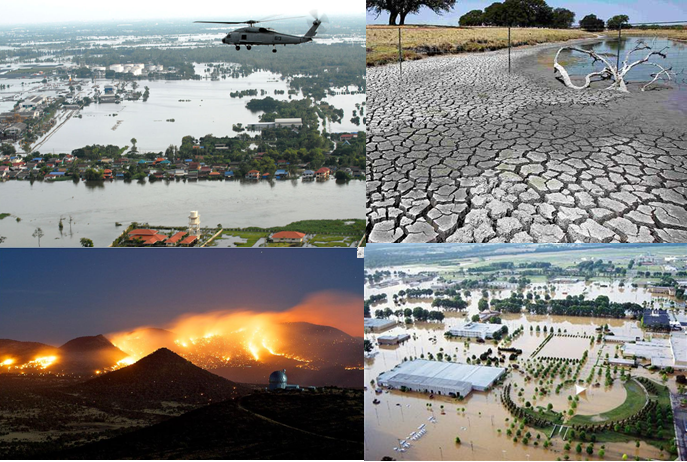
Figure 1 - Hell and High Water? A helicopter surveys the devastation of Bangkok, Texas suffers brutal drought and a massive fire season, while Millington, Tennessee is under water.

However, science is not about picking individual events that suit the story you want to tell. These events are consistent with global warming, but scientists won't point the finger until they've studied the data in detail, so it will be some time before we know how much global warming contributed to this year's remarkable events.

2010 was similarly frenetic: enormous floods in Pakistan, Colombia, Australia, Sri Lanka and South Africa, a record-breaking heatwave in Russia and the first single-season race around the North Pole in sailing ships, made possible by the disappearing sea ice. Amundsen's 1903 expedition took 3 years to manage the north-west passage, versus the 3 months for the Norwegian & Russian crews who did both the north-west and north-east passages!

It took until 2011 before scientists had checked the numbers and worked out that there is an 80% chance that the Russia's 2010 record-breaking warmth, and the tens of thousands of deaths that went with it, wouldn't have happened without global warming (Rahmstorf & Coumou, 2011).

Scientists look at all the available data: previous study of the US has found that hot records are now overwhelming cold records by 2:1 (Meehl et al, 2009), and a new NASA paper (Hansen, Sato & Ruedy, in press) shows that several recent heatwaves had a less than 1-in-750 chance of occurring naturally in the climate of a few decades ago. Events and analysis over the past years has now shown that we can be pretty confident that the first 'climate change disasters' and associated deaths have surely occurred.

The Data Keep Rolling in

2011 was expected to be less dramatic and slightly cooler than 2010 because the Pacific ocean spent this year in a 'La Nina' cool phase, which slightly chills off global temperatures until the cycle switches back within a few years. The World Meteorological Organisation reports that 2011 has been the warmest La Nina year measured.

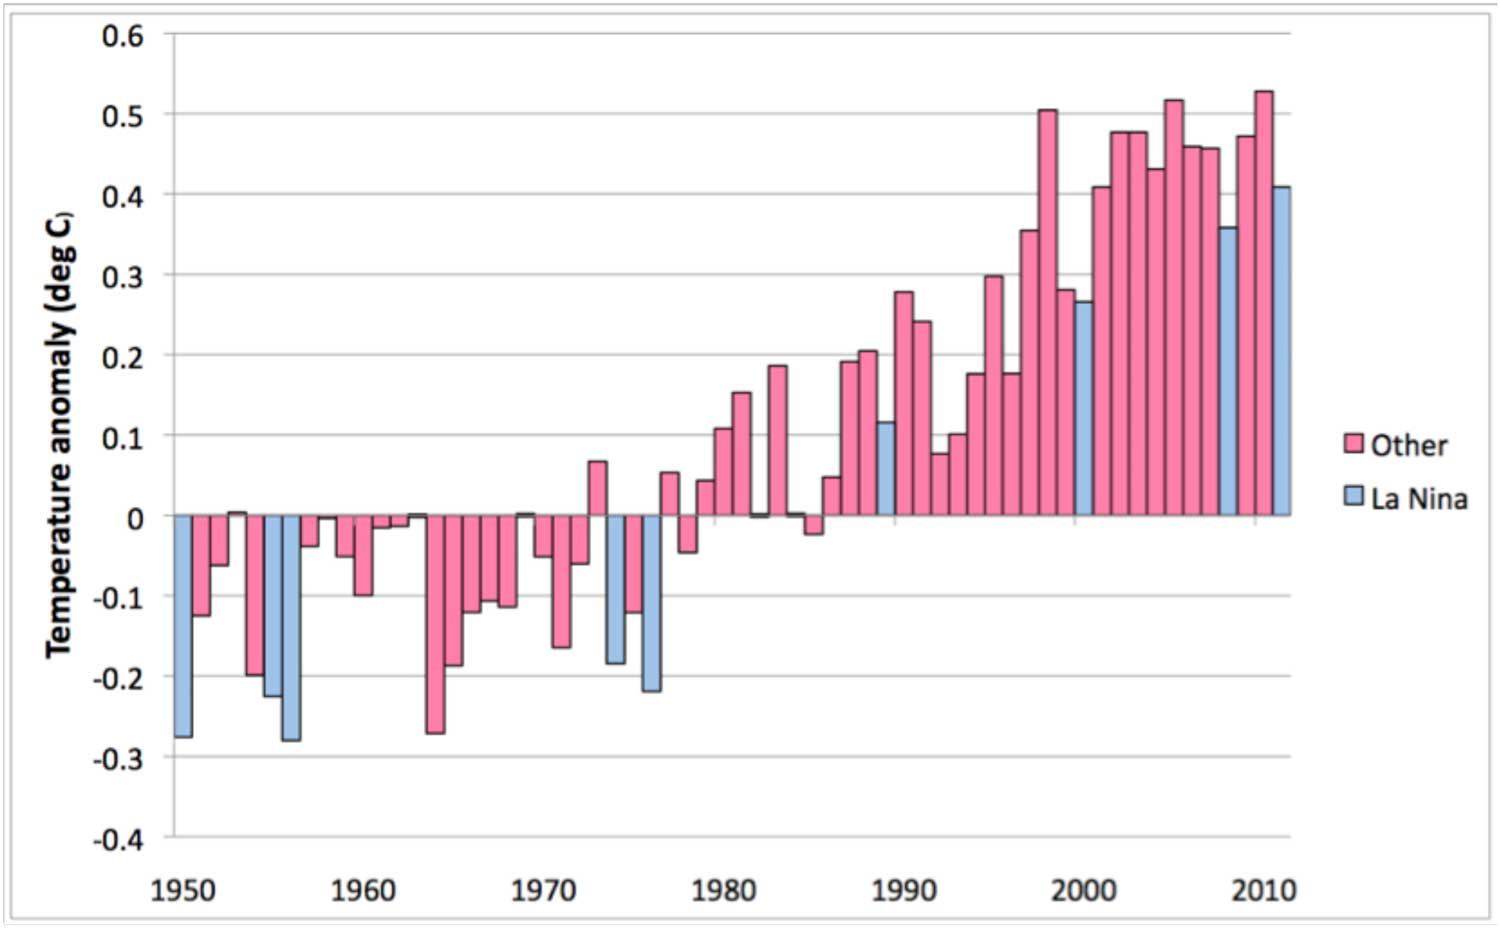
Figure 2 - global temperature change reported by the WMO. Blue years had 'La Nina' conditions in the Pacific, which acts to cool down temperatures. 2011 is the warmest La Nina year recorded.

Meanwhile Arctic sea ice kept up its shrinking trend, coming in at the second lowest September recorded. Antarctic sea ice, temporarily protected by wind and ocean changes, remains stable (with a long term trend that is increasing, but not statistically significant) - we find that globally, sea ice is shrinking.

Satellite measurements of sea level show a rise of +3.2 mm/year, an acceleration of about 90% from last century's average (Church & White, 2006). Last year NASA reported a 'pothole on the road to higher seas', where it rained so hard that the seas fell. This couldn't continue forever (Australia, Pakistan, Sri Lanka and Colombia surely didn't want it to last any longer), and as the oceans have warmed, floodwater has filtered back to the oceans and ice has continued to melt in 2011, sea levels rose once again.

Initial data from the ARGO network of 3,000+ buoys suggest that the top 700 metres of the ocean is beginning to warm again after a 7 year slow down (discussed here and here), while scientists have found that heat has continued to go into melting ice and the deeper ocean below 700 metres (Church et al, 2011).

Greenland, despite not reaching some of the record-breaking high temperatures it has seen recently, has likely seen near record-breaking melt in 2011, with hundreds of billions of tons more ice lost according to computer simulations (Tedesco et al, 2011). These need to be confirmed by other measurements: gravity field satellites are used to 'weigh' the Greenland ice sheet and show hundreds of billions of tons of ice loss from 2002-2010, expect 2011 results in the coming months.

The World Glacier Monitoring Service released their bulletin, reporting on the state of glaciers measured from 2008 and 2009, and found that 90% are shrinking.

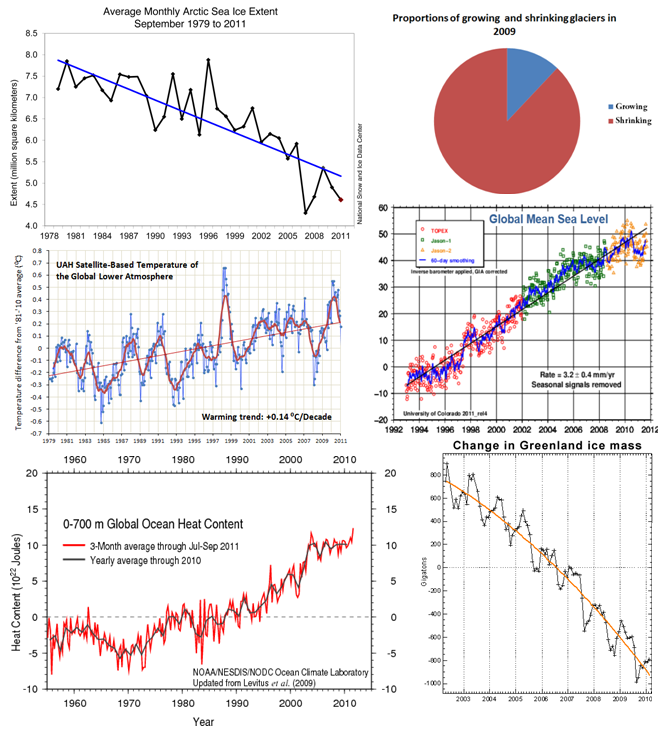
Figure 3 - Some of the data published in 2011: September sea ice extent in the Arctic, changes in heat content of the upper 700 metres of the oceans, changes in Greenland's ice mass and temperature of the lower atmosphere measured by satellites, global sea levels and the fractions of glaciers which were measured as growing and shrinking.

2011 Research Shows Global Warming has Continued

In 2009, soon before the Copenhagen climate negotiations, criminals stole and published private emails from UEA, a British university. Climate conspiracy theories got the media spotlight and in response independent reviews were started. All 9 reviews cleared the scientists and their work, although they stated that more effort to make data public was needed.

In the first round of emails the two biggest critiques of the science (as opposed to personal or political critiques) relied on cherry picking quotes, and were 'hide the decline' (discussed here, and publically by the scientists involved 11 years before the email release) and Trenberth's 'travesty' (discussed here, and publically by the scientist involved months before the criminals published the emails).

In 2011, just before the Durban climate negotiations, the criminals released more of the stolen emails and this time the critiques focused pretty exclusively away from the scientific work.

A major criticism of the scientists involved was that a small portion of the data used to create the temprature records was not centrally available. Despite this, at least 9 external groups were able to check the work, whilst the critics typically refused to do so. In July the data from all but 17 Polish weather stations was released by the UK Met Office, to complete silence from the critics.

A potential problem with the weather stations used to create the temperature record is 'microsite influences': stations being near air conditioners or other things which might affect their readings. Anthony Watts, a skeptic blogger  proposed that this is important, and helped to organise volunteers into photographing US weather stations to classify their quality. After hard work and calling in help from climate scientists, they published their results (Fall et al, 2011) and found that the effect on measuring warming is effectively zero.

But microsite influences are just one potential problem when trying to use thermometers to measure changes on Earth. Critics commonly stated that the methods used by scientists to account for these changes weren't good enough, often without understanding how they work.

To test these claims even more, Dr Richard Muller, a skeptical physicist, formed the Berkeley Earth Surface Temperature (BEST) project to calculate global land warming using more data and different statistical methods to all the other groups.

They confirmed that global warming is happening, and that UEA, the university at the centre of the email storm had likely been underestimating it!

Finally, work by Foster and Rahmstorf (2011) used thermometer and satellite data to work out the effect of the Sun, Pacific Ocean changes (El Nino and La Nina) and volcanoes on temperatures over the past decades. They found that, combined together, these 3 natural causes had been acting to cool down Earth, but the global warming trend was strong enough to overpower them. Once you take out these natural factors to see if there is a background climate change, global warming is clear, with the two warmest years being 2009 and 2010 (2011 data weren't included because they weren't available when the work was done). Dana provides an excellent discussion with more pictures here.

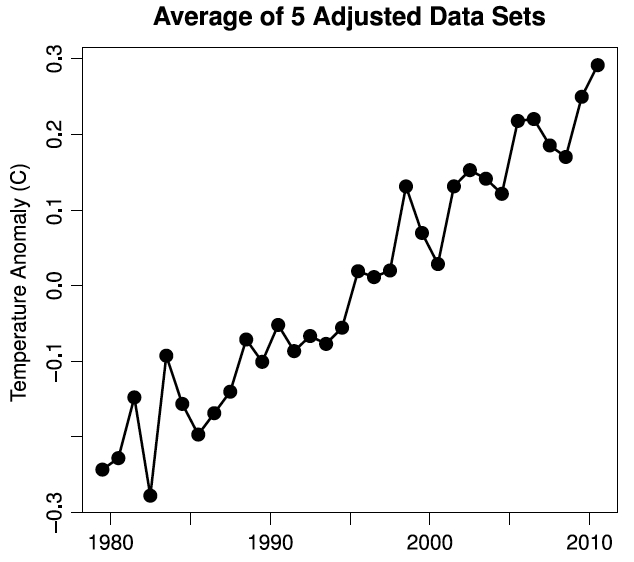
Figure 4 - The average temperature change recorded by 5 teams of scientists: 2 working on satellites (University of Alabama, Huntsville and Remote Sensing Systems) and 3 working with thermometers and ship/buoy measurements (UK Hadley Centre & Climate Research Unit, NASA Goddard Institute for Space Studies and the US National Climatic Data Centre. Statistical methods have been used to 'take out' the effects of volcanic eruptions, Pacific Ocean cycles and the Sun.

The March of Science

Science is the the slow buildup of work by thousands of scientists year after year. Thanks to them we know that glaciers are melting, ice sheets are shrinking, the oceans are rising and heating up, sea ice is retreating and the atmosphere is warming.

Work by Rahmstorf and Coumou showed that global warming probably made the Russian heatwave as severe and deadly as it was.

Further work on the temperature record by Watts, Muller and Foster has torpedoed the idea that global warming is an 'artifact' of measurement errors. Foster & Rahmstorf's work shows that 3 major known natural causes of climate change are not responsible for the warming and that there is a 'global warming signal' as predicted by physics and measurements of carbon dioxide's heating effect.

But that's not the end of the story of 2011: science continues its march forwards and in the next post we'll look at some of the interesting research results of 2011.

0 0

Printable Version  |  Link to this page

Comments

Comments 1 to 31:

  1. I live in Connecticut, a small New England state under 5300 square miles. The southwestern part of the state is a suburb of NYC- yet the eastern part of the state known as the 'Quiet corner' is known for its pastoral bucolic beauty. We ranked as the 8th worse state for climate/weather disasters in 2011. Snowstorms aren’t usually news in here — but 2011 was hardly usual. Hartford was buried under a record-setting 57 inches of snow in January, making it the all-time snowiest month in state history. Then, nearly two months before the next winter began, Connecticut was blasted by the worst October snowstorm in 200 years. The heavy wet snow, which cost the state more than $500 million, sent trees and tree limbs falling onto power lines, leaving more than 700,000 people without heat or lights. In the worst power failure in state history, many didn’t get their electricity back for more than a week. In August, tropical storm Irene pummeled the state with heavy rains and gale-force winds that caused devastating floods and turned the lights out on more than 650,000 people. Some areas were pounded with as much as eight inches of rain in just 24 hours.
    0 0
  2. Great work in this 2011 review. When will the climate deniers realize that their repudiation of scientific data in substantiation of man's contribution to global warming is counterproductive and putting everyone in jeopardy? Unfortunately, history has proven that nothing is done until circumstances become so dire that the impact is catastrophic. Thank you for providing informative, interesting content. I particularly enjoy the graphs and stastical analyses. Since discovering your website, I have spent hours poring over the articles, clicking on every embedded link (which I greatly appreciate). Keep up the good work.
    0 0
  3. It's been mentioned previously at this site, but worth mentioning again. Dr Hansen has written a brief on heat waves, which shows pretty clearly that the incidence of heat waves has steadily increased over the last 30 years and is now 10 times what it was in the previous 30 years. "...there is no need to equivocate..." There is some fuzziness because there are better data available in the 1950-1980 period than prior to that time, but by that time the global heat content was already on the move. Nevertheless, the rising trend is unmistakable.
    0 0
  4. Chris G - there's an upcoming post about the Hansen paper. Shouldn't be too far away.
    0 0
  5. newcrusader - please tell me CT is planning on burying its power lines now?
    0 0
  6. Apocalypse 2011: The year of climate alarms, ” is another excellent year-in-review-article posted on RTCC.
    0 0
  7. Here in Australia the only national newspaper,"The Australian" has published a devastating article in today's edition (31 December)titled "Cherry-picking contrarian geologists tend to obscure scientific truth". The article by Mike Sanford, professor of geology at University of Melbourne takes Ian Plimmer apart and shows Plimmer's errors and misinformation such as Plimmer claiming that volcanoes contribute much more carbon dioxide than human activity or his recent declaration that Antarctic ice cores show that carbon dioxide levels were higher in 1900 (330 ppm) than Mauna Lau Hawaiian measurements in 1960 (260 ppm). The Australian is a Murdoch paper that,in the main, has run a global warming skepticism/denial campaign and it has given far too much paper space to deniers such as Monckton, Carter and Plimmer. Hopefully the publishing of today's article is an indication that the editorial staff are starting to get the message that misinformation by the likes of Plimmer will not be tolerated.
    0 0
  8. tonyabalone @7 no such luck. The Australian published a similarly devastating review of "Heaven and Earth", but that has not stopped them from publishing his articles in opinion pages, and citing him as an expert in their news articles. Therefore I expect no change in their editorial policy or practice.
    0 0
  9. tonyabalone@7 The article from "The Australian" newspaper titled "Cherry-picking contrarian geologists tend to obscure scientific truth" is online.
    0 0
    Moderator Response: [Rob P] No more comments about Plimer here thanks. Try the Plimer vs Plimer thread.
  10. UK experiences 2nd warmest year on record:- http://www.metoffice.gov.uk/news/releases/archive/2011/december-and-annual-statistics
    0 0
  11. Longer term trend in UK, at least, seems flat to getting cooler, however, but remains above long term average. http://www.metoffice.gov.uk/climate/uk/actualmonthly/
    0 0
  12. Rob, (#4) Glad to hear that. I've seen some critiques of that communication that struck me as an abuse of statistics. Yeah, there was the dust bowl in the US in the time period prior to the baseline chosen by Hansen, but I don't know how extreme the actual heat wave was or how many other events around the world happened in close proximity chronologically. I'm guessing some of these are being addressed already, but just in case, and if there is time for it, I'd be eager to see something succinct on them. A bit of laziness or my part perhaps, but I don't see any need to reinvent the wheel, and as I've gotten older, I've learned that carpenters are generally better at carpentry than I am.
    0 0
  13. Church and White ar very outdated as far as the supposed acceleration of the sea level rise is considered. Unbiased examination of the Colorado data shows, that - contrary to popular belief - the rate of rise of the sea level has decreased. Of course it is possible to draw a straight line with a positive slope for the period 1992-2011. But with a more sophisticated analysis it can be shown, that - despite the high noise in the data - there has been a significant decrease in the rate of rise: 2001-2005: average rise 4.22 mm/year, standard deviation 4.87, 179 data points, 2006-2010: average rise 1.84 mm/year, standard deviation 5.522, 179 data points. A simple statistic test shows that this difference is significant. This is still a very elementary approach. Non-linear trend analysis (for instance with help of the LOESS-function) confirms this conclusion, and shows that there is a continuous decrease of the rate of sea level rise, having reached a complete standstill in the last 2 years. There is no accelaration of the sea level rise at all. Denying this fact is the real climate change denial!
    0 0
    Moderator Response: [Rob P] Check out:Sea level fell in 2010. This is your problem:

    Given that 2011 was still in the grip of La Nina, and therefore a lot more rainfall occurring over the major land basins, the "pothole"is hardly surprising.

    And note the latest from AVISO:

    Since the huge El Nino of 1997-98 saw a massive surge in sea level rise of 20mm, it's not unreasonable to expect things will be back on track with the next El Nino. So please no more ironic comments about denial.
  14. Your link "suggest moving the capital" second paragraph repeats the link"record-breaking snowmelt" in the 1st paragraph. You may have wanted this one: suggest moving the capital" Noel
    0 0
  15. @ fydijkstra #13: Context is everything. Here's the entire paragraph about sea level rise. "Satellite measurements of sea level show a rise of +3.2 mm/year, an acceleration of about 90% from last century's average (Church & White, 2006). Last year NASA reported a 'pothole on the road to higher seas', where it rained so hard that the seas fell. This couldn't continue forever (Australia, Pakistan, Sri Lanka and Colombia surely didn't want it to last any longer), and as the oceans have warmed, floodwater has filtered back to the oceans and ice has continued to melt in 2011, sea levels rose once again." Nice try, but no cigar!
    0 0
  16. ydijkstra, Are you saying that warming temps don't cause thermal expansion and melting Greenland and Glacier ice do not add to sea level? Or are you suggesting that these things are not happening? I do not know the relative volumes for all that flooding compared to how it should effect sea level, but it seems at least plausible to me that it could cause a short term decrease in global sea level. I assume that it would impact the areas around the flooding the most but I wonder if anyone here has more info.
    0 0
    Moderator Response: [JH] Contrary to popular opnion, sea level rise is not spread uniformly throughout the world's ocean system. See SkS post, “Thinning on top and bulging at the waist: symptoms of an ailing planet.”
  17. The first few paragraphs were plainly written to garner an emotional response. While there is a possibility that one day these weather events in 2011 and other years may be conclusively linked to climate change (whether anthropogenic or not), articles like this reek of alarmism. Sure, the tornado season was extremely active and "tore apart towns", but that is what tornados do. I live in the South and personally have seen the devastation that these forces of natures create. Certainly, 2011 was a record year, but that record year will not alter the slight downward trend of "Strong to Violent" tornados since 1950 as shown in this graph from NOAA. Also, as human populations grow, and towns therefor grow, it becomes more probable that tornados are going to hit "something that matters". But, thanks to the advancement of technology, increased knowledge and improved construction, humans have adapted to better survive these extreme weather events as shown in the graph below. An active extreme event year in weather related disaster no more indicates AGW than a year with few weather related disasters indicates the opposite.
    0 0
  18. Pirate - So according to the second graph (US tornado deaths) and your reasoning, US citizens in the early 1990's were more advanced, had increased knowledge and better construction techniques than the 'noughties?' Do you have links to any studies that support your claim? I don't doubt that it is partially right, but intuition is hardly science. As for rating of tornado strength. Peer-reviewed studies have looked at the record and found it pretty unreliable. Can you inform us how tornadoes have been categorized over time?
    0 0
  19. A massive tornado outbreak between April 25 and 28 of this year (2011) spanned five states in the southeastern United States. The deadliest day was on April 27, when 122 tornadoes killed 316 people across parts of Mississippi, Alabama, Tennessee, Virginia and Georgia. Fifteen of the reported tornadoes were deemed “violent,” meaning they ranked 4 or 5 on the Enhanced Fujita Scale. This outbreak is the third deadliest in U.S. history, and it contributed to 2011 being tied as the second deadliest tornado year on record. In addition to the death toll, more than 2,400 people were injured and the area experienced more than $4.2 billion in property loss. Source: “NOAA's National Weather Service completes assessment of historic tornado outbreak - 2011 tied as second deadliest tornado year in U.S. history”, NOAA News Release, Dec 20, 2011 To access the complete NOAA news release, click here.
    0 0
  20. pirate#16, Let us not forget that Jeff Masters names 2011 "The Year of the Tornado". For slight trends, I'll see your 'slight downward trend' with this slight upwards trend: -- source Masters, above As far as "humans have adapted to better survive these extreme weather events," if you call better building codes adaptation, I suppose so. An adaptation in biology is a trait with a current functional role in the life history of an organism that is maintained and evolved by means of natural selection. Building codes? That's a form of government regulation. Can't have that.
    0 0
  21. #11 mace: The UK is only one small region, and experiences a lot of interannual variability so the temperature series has a lot of noise. It takes about ~17 years (Santer et al, 2009) to get statistical confidence in (less noisy) global changes, so you'd expect even more time for just the UK before you can be confident about saying anything... If you look at what you linked to, and switch to average temperatures, you see the smooth points downwards in some months, but upwards in others. Annually, it's flat at the end, but it's sensitive to the final datapoint which was cool thanks to the massive blocking event last winter that gave us a very cold January and December. Once this year (2nd warmest) is added, it won't look the same. And as I said, I'm not sure you can take anything from this curve fitting exercise. All you can say is that the last decade was the warmest.
    0 0
  22. #13 fydijkstra : Have these results been published? In the context of that paragraph, we can see rigorously that the full satellite record shows faster sea level rise than we measured last century. I'm not aware of any study showing a significant 'slowdown', especially not in the global warming 'signal'. We had a strong La Nina which depresses sea levels. So there might very well be a statistically significant negative trend over that very short time period, but it doesn't say anything about the background trend. Which is what Foster & Rahmstorf worked on with atmospheric temperatures in their paper. You can get statistical results you like by picking certain periods, but considering the physical reality also helps. Given that over the past 20-odd years there's been a slight downwards trend in the MEI index, if anything, I felt confident that using the FULL satellite record would better represent the real signal.
    0 0
  23. #14 noelfuller : thanks, fixed! #17 apiratelooksat50 : I have to admit, I reacted emotionally to the disasters. A lot of other people do too, and 'did climate change cause x disaster?' is a common question. As a science communication site, we should answer these questions & I don't think we should be afraid of reporting the science and the context it's in because some people feel an emotional reaction to it. As long as the scientific content is clear and correct (which I believe it is), that's what's important. The recent series of record-breaking natural disasters that are now beginning to be detected as most probably human caused is one of the biggest science stories of 2011 IMO. It would have been ridiculous to leave them out as an appeasement policy, and the science on them needs to be communicated. I obviously agree with "An active extreme event year in weather related disaster no more indicates AGW than a year with few weather related disasters indicates the opposite", but the attribution studies work around this, and that was what I reported.
    0 0
  24. Pirate: The first few paragraphs were plainly written to garner an emotional response. So if an article on AGW is disturbing or depressing, it can be discounted. And if it expresses basic human sympathy for victims of tragic events, it can be mocked as "emotional" (subtext: feminine and foolish). A nice way to win every argument before it begins! Do you apply the same stringently rational litmus test to articles positing a "Great Global Warming Swindle"? Or the "dangers" of reducing CO2 emissions? Aren't inactivist arguments about some grave existential threat to "liberty" equally emotional? And isn't there an intense emotional gratification in believing oneself to be smarter and better informed than expert climatologists? Or for that matter, in believing on principle that nothing really bad will come of AGW? Are you equally wary of these pitfalls? Do you look as consistently and carefully for these appeals to emotion and wishful thinking in your own rhetoric as you do in other peoples'? Be honest, now.
    0 0
  25. Well here in the UK we have had the second hottest year on record in 2011. The spring in the South was dry as has been the autumn, two trees I got planted in the winter were struggling a bit in the spring. Rivers and reservoirs are low this winter and there have been hose pipe bans in some places in the autumn, which is practically unheard of. Unless we get substantial amounts of rain (which may produce flooding, if the vast amounts needed come in a short time) then we will be seeing a drought in 2012.
    0 0
  26. The debate on weather disturbances being usual, unusual, part of a pattern & what the possible pattern might be influenced by, will be best understood by our insurance companies. From what I know, their rising premiums and recent tendency to exclude high-risk regions tells the story convincingly enough.
    0 0
  27. Phila at 24 I don't agree with your statement about emotion being feminine and foolish. It's human nature. Science should be about the scientific method and facts. Passion for your discipline is necessary, but emotion should be reserved for children and puppies.
    0 0
  28. Suggested reading: “Portraits of the Southwest in the Shadow of Drought.”New York Times, Dec 26, 2011 This article reviews two recently published books: 1. “A Great Aridness : Climate Change and the Future of the American Southwest” by William deBuys, a conservationist based in New Mexico; and, 2. “Bird on Fire: Lessons from the World's Least Sustainable City” by Andrew Ross, a social scientist at New York University.
    0 0
  29. apirate @ 27... Are you capable of applying the same standards of discipline to the economic aspects of the issues? The knife cuts both ways. I find that most people who choose to reject AGW do so first out of an emotional response to the idea of taxing carbon. After that they are merely looking for confirmation of the conclusion they prefer.
    0 0
  30. Suggested reading: “Top climate change stories of 2011” by Andrew Freedman, Capital Weather Gang blog, Washington Post, Jan 4, 2011 Although Freedman plows some of the same ground that MarkR does in the above, there are some significant differences in the focus of the two articles. Freedman covers the following: 1. Advances in understanding global warming and extreme weather 2. Surface temperature record holds up to (another) review 3. “Climategate 2” falls flat 4. Congress Nixes National Climate Service
    0 0
  31. Suggested reading “As wild weather hits Latin America, experts look to both La Nina and climate change”, Washington Post/AP, Jan 6, 2012 To access this article, click here.
    0 0

You need to be logged in to post a comment. Login via the left margin or if you're new, register here.


The Consensus Project Website

THE ESCALATOR

(free to republish)


© Copyright 2024 John Cook
Home | Translations | About Us | Privacy | Contact Us