


 Arguments


2017 SkS Weekly Climate Change & Global Warming Digest #24
Posted on 18 June 2017 by John Hartz
Story of the Week... Toon of the Week... Video of the Week... Coming Soon on SkS... Poster of the Week... SkS Week in Review... 97 Hours of Consensus...
Story of the Week...
May Continues a Ridiculous Warm Streak for the Planet
Another month is in the global temperature record books. While May just missed setting a record, the data is another reminder that climate change is making the world hotter and pushing it into a new state.
This May was the second-warmest May on record, according to NASA data released on Thursday. The planet was 1.6°F (0.88°C) warmer than normal last month, trailing 2016 by just a 10th of a degree.
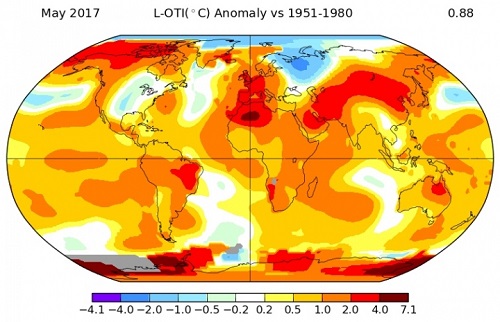
This May was the second-hottest May on record. Credit: NASA GISS
Widespread hot spots stretched from pole to pole, showing no corner of the globe is untouched by the impact of rising carbon dioxide levels in the atmosphere. Temperatures soared up to 13.8°F (7.1°C) above normal in parts of Antarctica while a wide swath of heat cooked northern Africa and western Europe.
With May in the record books, NASA data also shows that this was the second-warmest spring on record, again trailing only 2016. NASA climate researcher Gavin Schmidt said the first five months of the year make it likely that this will be the second-hottest year on record trailing only, you guessed it, 2016.
Last year’s record heat got a boost from El Niño. The absence of El Niño this year in some ways makes the planetary heat even more shocking, though it certainly fits a pattern.
After all, May marked an all-time monthly peak for carbon dioxide levels in what’s become an annual rite of passage. Scientists found that carbon dioxide at Mauna Loa Observatory, the marquee measuring station, reached 409.65 parts per million (ppm) last month. That coupled with the second-hottest May on record are major markers of the current state of the world’s climate.
May Continues a Ridiculous Warm Streak for the Planet by Brian Kahn, Climate Central, June 15, 2017
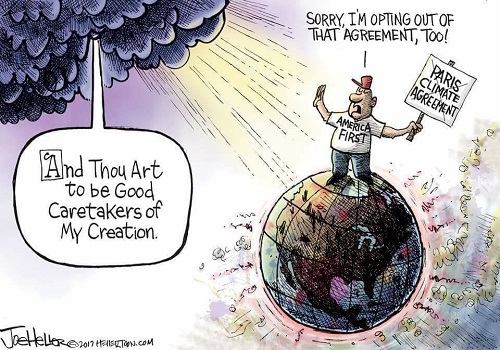
Toon of the Week...
Video of the Week...
5 Surprising Climate Change Effects
Yoda, Luke and C3PO explain surprising climate change effects.
- Climate Change May Increase Volcanic Eruptions
- Predictions Implicit in “Ice Melt” Paper and Global Implications
- Ice melt, sea level rise and superstorms: evidence from paleoclimate data, climate modeling, and modern observations that 2 °C global warming could be dangerous
- Jim Hansen: Hell Will Break Loose – Ice Melt, Sea Level Rise and Superstorms
- Wet-bulb temperature
- Bill McGuire: Will climate change cause earthquakes? (2012)
- Waking the Giant: Climate Force and Geological Hazards
- Expert explains Future Sea Level Rise (2017)
- Future Sea Level Rise Summary (Eric Rignot 2017)
- Carbon dioxide is ‘driving fish crazy’
- IUCN Explaining Ocean Warming: Causes, scale, effects and consequences and PDF
Video footage by Lucasfilm Ltd.
5 Surprising Climate Change Effects, Climate State/You Tube Video, June 13, 2017
Coming Soon on SkS...
- Factcheck: Grenfell Tower fire and the Daily Mail’s ‘green targets’ claim (Leo Hickman)
- Guest Post (John Abraham)
- We are heading for the warmest climate in half a billion years (Gavin Foster)
- Claiming that Listerine alleviates cold symptoms is false: To repeat or not to repeat the myth during debunking? (Steve Lewandowsky)
- Climate scientists just debunked deniers' favorite argument (Dana)
- 2017 SkS Weekly Climate Change & Global Warming News Roundup #25 (John Hartz)
- 2017 SkS Weekly Climate Change & Global Waming Digest #25 (John Hartz)
Poster of the Week...

SkS Week in Review...
- 2017 SkS Weekly Climate Change & Global Warming News Roundup #24 by John Hartz
- Explainer: Dealing with the ‘loss and damage’ caused by climate change by multiple authors (Carbon Brief)
- SkS Analogy 8 - I'll take the specialist by Evan
- New research may resolve a climate ‘conundrum’ across the history of human civilization by Dana Nuccitelli (Climate Consensus - the 97%, Guardian)
- The Trump Effect - Making Lemonade from Lemons by BaerbelW
- The Larsen C ice shelf collapse hammers home the reality of climate change by John Abraham (Climate Consensus - the 97%, Guardian)
- 2017 SkS Weekly Climate Change & Global Warming Digest #23 by John Hartz
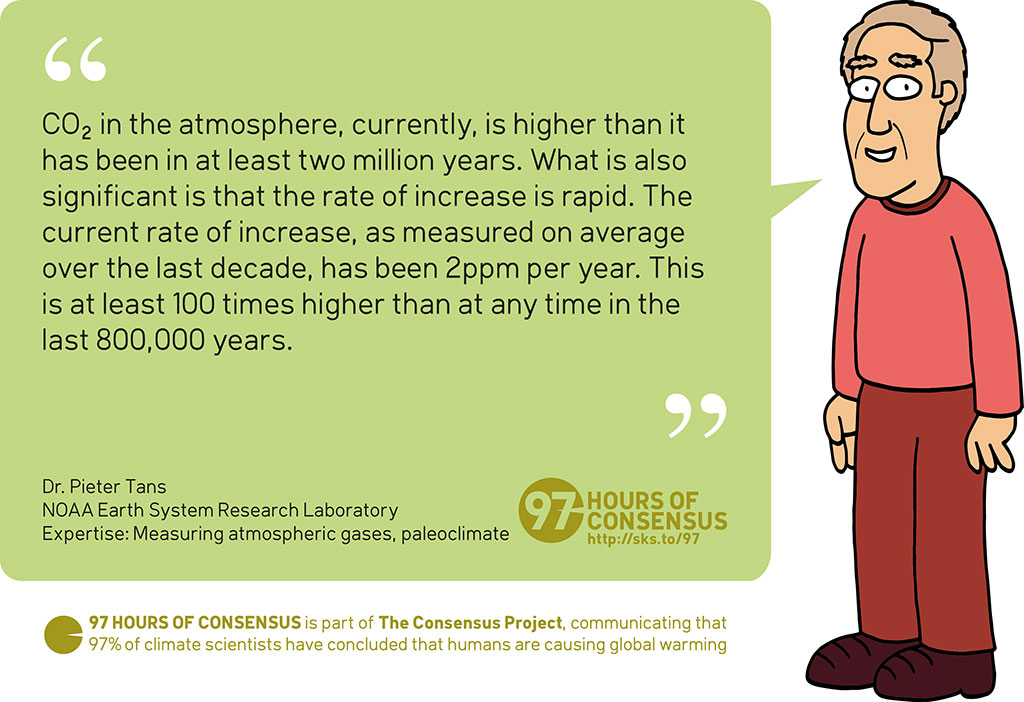
97 Hours of Consensus...


The Greenhouse effect is a temperature - that resulting from the heat held by all the gases in the atmosphere.
Therefore, ALL gases in the atmosphere are greenhouse gases.
[It is immaterial how the gases absorb this heat, eg by convection, conduction, diffusion or infrared. That is an (infra) red herring!]
The amount of heat each gas component holds is roughly in proportion to its percentage.
Therefore, as carbon dioxide’s level is only about 0.04%, its contribution to global warming is puny – perhaps 0.01C!
[PS] Sloganeering. You cant start with a incorrect understanding of the greenhouse effect and then expect to prove it wrong. Firstly, try to understand how the greenhouse effect works - virtually everything you said was wrong. I recommend Science of Doom, for good textbook treatment. If you still want to object, find an appropriate topic (use search or argument buttons at top) and support your argument with references/data. Your objection needs to fit with all of the observation/measurements made, including direct measurements.
OK Moderator. Mine is simply a thermodynamic statement; difficult to refute. (My PhD is in that area.) You just can’t simply write that what I’ve written is wrong, without showing why.
My observation fits the Greenhouse effects on Venus, Earth and Mars, something which AGW’s known to be incorrect redefinition of Greenhouse Effect (see eg Wikipedia and countless others), cannot.
[Mars has 14x CO2 level of Earth’s but almost zero Greenhouse effect – in line with the total pressure being so low. You can get an expanded explanation at my site.]
[PS] Then use your PhD skills to read a text book on radiative thermodynamics instead of framing nonsense.Starting with the GHE is NOT a temperature resulting from heat held by gases. If you learnt that in your PhD, then you need a refund.
Unfortunately, your skills dont seem to include how to understand our comments policy.
Pjcarson2015, the reason temperatures on mars are a bit cool despite high CO2 concentrations might just be something to do with very low atmospheric mass, and very low surface pressure, compared to both earth and venus. Mars also has a lack of water vapour, and mars gets considerably less sunlight than earth.
I'm not a scientist, but even I can figure it out. You have a phd in thermodynamics? I simply do not believe you, full stop.
pjcarson2015 @5, the continuous parade of climate "skeptics" who pontificate on what "AGW predicts" without ever bothering to look up what climate science actually predicts is tiresome. In your case you claim AGW predicts a stronger greenhouse effect on Earth, whereas it actually predicts a much weaker GHE on Mars:
On Earth, as a convenience, the effect of the greenhouse effect is determined as a function of percentage change in the atmospheric concentration of CO2 on Earth as a convenience, but in the full theory, the effect of the greenhouse effect is determined by the partial pressure profile with altitude of CO2 (and other greenhouse gases).
High partial pressures of non-IR active gases (such as O2 and N2) can effect the strength of the greenhouse effect by lifting CO2 to a higher altitude, thereby increasing the partial pressure of CO2 at that altitude. But without the GHG, IR inert gases will have no greenhouse effect, and no tendency to increase surface temperature above the simplified black body estimates. (They will slightly increase surface temperature by equalizing temperature between poles and equator, but the simplified black body estimates assume equal temperature at all points, so this effect cannot raise the temperature above that value.)
For a more detailed account of what "AGW theory" predicts about the temperature of Mars, I refer you to Toigo et al (2012).
[PS] I think pdCarson has outstayed is welcome. No further comments please.
Worth noting that the temp anomaly was referenced against 1951-1980 which was a relatively cool interval thanks to AMO / PDO phases, so the anomaly is made to look slightly more severe that what it would if the previous 30 years was also included.
Art Vandelay @5, I don't think that is correct. While it is likely that the 1940s were warmer than the 1970s, the 1920s and 30s were definitely cooler than any following decade:
Art Vandelay @5:
The period 1921-1980 was 0.06°C and 0.05°C colder in the Berkeley Earth and NASA record respectively than their reference period 1951-80, so including those 30 years would make the temp anomalies that much larger, not smaller.
Note: Berkeley Earth presents two versions of their temperature record, but they recommend using the one with air temperature above sea ice, not water temperature below it.