


 Arguments
Software
Resources
Comments
The Consensus Project
Translations
About
Support
Arguments
Software
Resources
Comments
The Consensus Project
Translations
About
Support
![]()
![]()
![]()
![]()
![]()
![]()
![]()
![]()
![]()
![]()


![]()


Latest Posts
- Skeptical Science New Research for Week #26 2026
- What Americans can learn from London’s war on cars
- New Publication: Identifying Flawed Reasoning in Contrarian Claims about Climate Change
- The Merchants of Doubt are coming for Extreme Event Attribution science
- 2026 SkS Weekly Climate Change & Global Warming News Roundup #25
- Cooking up the Climate Stripes, with Ed Hawkins
- Skeptical Science New Research for Week #25 2026
- How ‘balcony solar’ could help fight rising utility costs
- Fact brief - Does solar energy need subsidies to compete with fossil fuels?
- Plateauing CO2 emissions have slowed atmospheric growth
- 2026 SkS Weekly Climate Change & Global Warming News Roundup #24
- Skeptical Science New Research for Week #24 2026
- June update: Help still needed to get translations prepared for our website relaunch!
- How many people does heat actually kill?
- Check out the brand-new hurricane ‘cone of uncertainty’ graphics arriving this season
- 2026 SkS Weekly Climate Change & Global Warming News Roundup #23
- SkS Housekeeping: Updating the Comments Policy
- Skeptical Science New Research for Week #23 2026
- Nobody knows the future of energy
- Fact brief - Do electric vehicles almost always have a lower carbon footprint than gasoline-powered cars?
- Solar, wind, and EVs have knocked out a doomsday climate scenario
- 2026 SkS Weekly Climate Change & Global Warming News Roundup #22
- Skeptical Science New Research for Week #22 2026
- The next era of Atlantic hurricanes could be far more destructive
- On the death of RCP8.5
- RCP8.5 Update
- 2026 SkS Weekly Climate Change & Global Warming News Roundup #21
- Skeptical Science New Research for Week #21 2026
- What’s a ‘super El Niño’? And other El Niño questions, answered
- Fact brief - Does electromagnetic radiation from wind turbines pose a threat to human health?
Archived Rebuttal
This is the archived Intermediate rebuttal to the climate myth "It's El Niño". Click here to view the latest rebuttal.
What the science says...
|
The El Nino Southern Oscillation shows close correlation to global temperatures over the short term. However, it is unable to explain the long term warming trend over the past few decades. |
The paper claiming a link between global warming and the El Niño Southern Oscillation (ENSO) is Influence of the Southern Oscillation on tropospheric temperature (McLean 2009). What does the paper find? According to one of it's authors, Bob Carter,
"The close relationship between ENSO and global temperature, as described in the paper, leaves little room for any warming driven by human carbon dioxide emissions."
In other words, they claim that any global warming over the past few decades can be explained by El Niño activity.
How do they arrive at this conclusion? They begin by comparing satellite measurements of tropospheric temperature to El Niño activity. Figure 1 plots a 12 month running average of Global Tropospheric Temperature Anomaly (GTTA, the light grey line) and the Southern Oscillation Index (SOI, the black line).
Figure 1: Twelve-month running means of SOI (dark line) and MSU GTTA (light line) for the period 1980 to 2006 with major periods of volcanic activity indicated (McLean 2009).
The Southern Oscillation Index shows no long term trend (hence the term Oscillation) while the temperature record shows a long term warming trend. Consequently, they find only a weak correlation between temperature and SOI. Next, they compare derivative values of SOI and GTTA. This is done by subtracting the 12 month running average from the same average 1 year later. They do this to "remove the noise" from the data. They fail to mention it also removes any linear trend, which is obvious from just a few steps of basic arithmetic. It is also visually apparent when comparing the SOI derivative to the GTTA derivative in Figure 2:
Figure 2: Derivatives of SOI (dark line) and MSU GTTA (light line) for the period 1981–2007 after removing periods of volcanic influence (McLean 2009).
The linear warming trend has been removed from the temperature record, resulting in a close correlation between the filtered temperature and SOI. The implications from this analysis should be readily apparent. El Niño has a strong short term effect on global temperature but cannot explain the long term trend. In fact, this is a point made repeatedly on this website (eg - here and here).
This view is confirmed in other analyses. An examination of the temperature record from 1880 to 2007 finds internal variability such as El Nino has relatively small impact on the long term trend (Hoerling 2008). Instead, they find long term trends in sea surface temperatures are driven predominantly by the planet's energy imbalance.
There have been various attempts to filter out the ENSO signal from the temperature record. We've examined one such paper by Fawcett 2007 when addressing the global warming stopped in 1998 argument. Similarly, Thompson 2008 filters out the ENSO signal from the temperature record. What remains is a warming trend with less variability:
Figure 3: Surface air temperature records with ENSO signal removed. HadCRUT corrections by Thompson 2008, GISTEMP corrections by Real Climate.
Foster and Rahmstorf (2011) used a multiple linear regression approach to filter out the effects of volcanic and solar activity and ENSO. They found that ENSO, as measured through the the Multivariate ENSO Index (MEI), had a slight cooling effect of about -0.014 to -0.023°C per decade in the surface and lower troposphere temperatures, respectively from 1979 through 2010 (Table 1, Figure 4). This corresponds to 0.045 to 0.074°C cooling from ENSO since 1979, respectively. The results are essentially unchanged when using SOI as opposed to MEI.
Table 1: Trends in °C/decade of the signal components due to MEI, AOD and TSI in the regression of global temperature, for each of the five temperature records from 1979 to 2010.
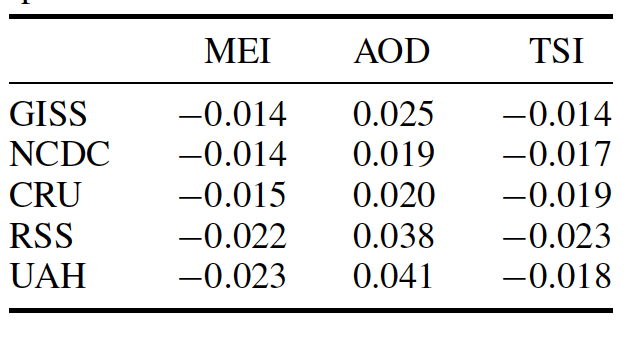

Figure 4: Influence of exogenous factors on global temperature for GISS (blue) and RSS data (red). (a) MEI; (b) AOD; (c) TSI.
Like Foster and Rahmstorf, Lean and Rind (2008) performed a multiple linear regression on the temperature data, and found that although ENSO is responsible for approximately 12% of the observed global warming from 1955 to 2005, it actually had a small net cooling effect from 1979 to 2005. Overall, from 1889 to 2005, ENSO can only explain approximately 2.3% of the observed global warming.
Ultimately, all the data analysis shouldn't distract us from the physical reality of what is happening to our climate. Over the past 4 decades, oceans all over the globe have been accumulating heat (Levitus 2008; Nuccitelli et al. 2012, Figure 5). The El Niño Southern Oscillation is an internal phenomenon where heat is exchanged between the atmosphere and ocean and cannot explain an overall buildup of global ocean heat. This points to an energy imbalance responsible for the long term trend (Wong 2005).
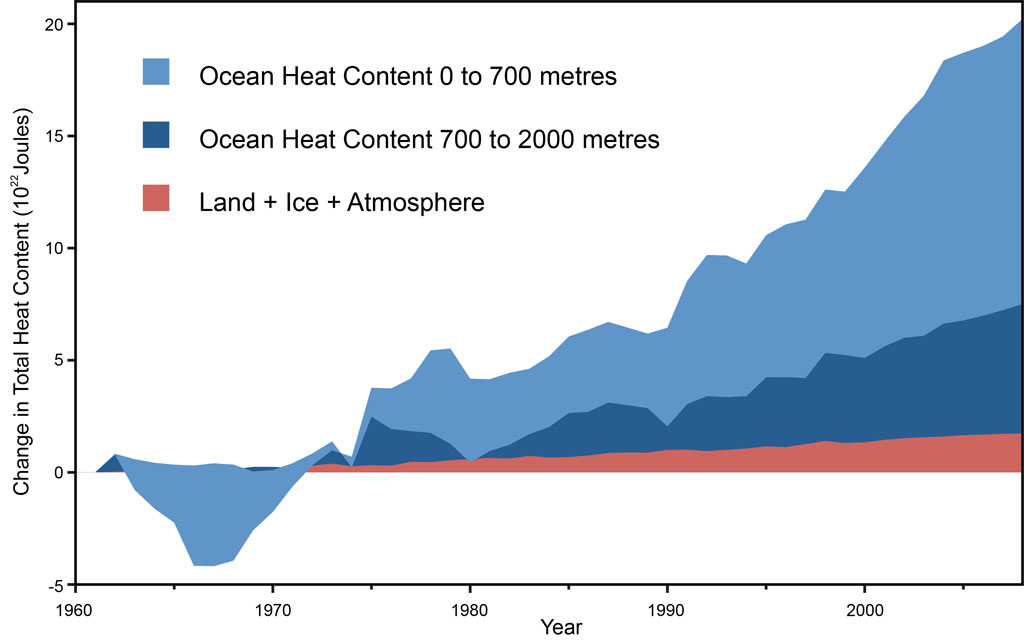
Figure 5: Land, atmosphere, and ice heating (red), 0-700 meter OHC increase (light blue), 700-2,000 meter OHC increase (dark blue). From Nuccitelli et al. (2012),
Data analysis, physical observations and basic arithmetic all show ENSO cannot explain the long term warming trend over the past few decades. Hence the irony in Bob Carter's conclusion "The close relationship between ENSO and global temperature leaves little room for any warming driven by human carbon dioxide emissions". What his paper actually proves is once you remove any long term warming trend from the temperature record, it leaves little room for any warming.
Intermediate rebuttal written by dana1981
Update July 2015:
Here is a related lecture-video from Denial101x - Making Sense of Climate Science Denial
Updated on 2015-07-10 by pattimer.


THE ESCALATOR

(free to republish)