Climate Science Glossary

Term Lookup

Enter a term in the search box to find its definition.

Settings

Use the controls in the far right panel to increase or decrease the number of terms automatically displayed (or to completely turn that feature off).

Term Lookup

Settings


All IPCC definitions taken from Climate Change 2007: The Physical Science Basis. Working Group I Contribution to the Fourth Assessment Report of the Intergovernmental Panel on Climate Change, Annex I, Glossary, pp. 941-954. Cambridge University Press.

Home Arguments Software Resources Comments The Consensus Project Translations About Support

Bluesky Facebook LinkedIn Mastodon MeWe

Twitter YouTube RSS Posts RSS Comments Email Subscribe


Climate's changed before
It's the sun
It's not bad
There is no consensus
It's cooling
Models are unreliable
Temp record is unreliable
Animals and plants can adapt
It hasn't warmed since 1998
Antarctica is gaining ice
View All Arguments...


Username
Password
New? Register here
Forgot your password?

Latest Posts

Archives

The human fingerprint in global warming

What the science says...

Select a level... Basic Intermediate Advanced

Multiple sets of independent observations find a human fingerprint on climate change.

Climate Myth...

It's not us

'What do the skeptics believe? First, they concur with the believers that the Earth has been warming since the end of a Little Ice Age around 1850. The cause of this warming is the question. Believers think the warming is man-made, while the skeptics believe the warming is natural and contributions from man are minimal and certainly not potentially catastrophic à la Al Gore.' (Neil Frank)

At-a-glance

Since the pre-industrial era, we have burned ever-increasing amounts of fossil fuels. This we can see for ourselves, often just by looking out of the window or hear, by listening to the flow of traffic. The sights and sounds of fossil fuel burning, constant, perpetual.

We cannot see or taste carbon dioxide, one of the two main products of that combustion, the other being water vapour. But it's constantly heading up into our atmosphere – in 2021 alone the figure for such emissions, according to the International Energy Agency, was 36,300,000,000 tonnes of the stuff. Just imagine for a moment that amount of sand piled up in a heap!

Once up there, one key difference between carbon dioxide and water vapour becomes critically important. Water vapour condenses to form clouds and freezes to form ice crystals. Rain, hail, sleet and snow all fall from clouds – it's a constant, ongoing cyclic process, even though different places see much more – or much less precipitation.

Carbon dioxide has no liquid state at the pressures encountered in Earth's atmosphere. Instead, at normal atmospheric pressures, it sublimes from solid to gas at −78 °C. Solid carbon dioxide is also known as dry ice, but cannot form in the range of temperatures found within Earth's atmosphere, although it is produced industrially for various purposes. So as opposed to water vapour, carbon dioxide is an example of a non-condensing gas: once up there it stays up there for a long time. That's why our vast CO2 emissions are causing levels of the gas to build and build.

If you needed a smoking gun in order to accept the above, there is one: carbon dioxide derived from fossil fuel burning has a very distinct chemical fingerprint that is readily measurable in air samples. To find out how we do that, read the further details below. Such measurements, with a trend precisely following the pathway we would expect due to our increasing emissions, show that far from being someone else's problem, one way or another we are all bang to rights in this case.

Please use this form to provide feedback about this new "At a glance" section. Read a more technical version below or dig deeper via the tabs above!


Further details

If you wanted to find a smoking gun with respect to human carbon emissions and their role in global warming, where would you look? There are several and the Intermediate version of the rebuttal lists and describes many of them, but we’ll start here with the most important one.

Fossil fuel production and usage is all well-documented. For that reason, CO2 emissions are also well-documented. In 2019, some 44.25 billion tons (or gigatons) were emitted to the atmosphere (IPCC AR6, WG III Technical Summary 2022). That figure was the highest recorded in a steady year-on year upward annual trend.

So we know all too well that every year of late we have added tens of billions of tonnes of CO2 to the atmosphere. How do we detect that fossil fuel signature in the air? 

Human fingerprints

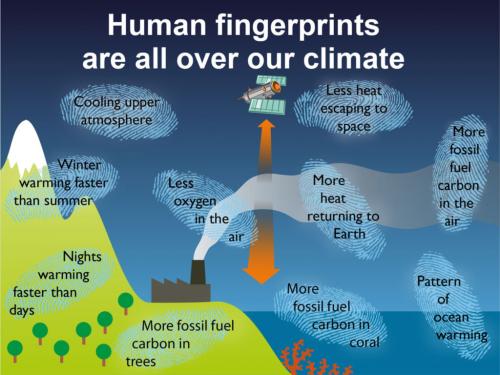
Fig. 1: human fingerprints on the crime-scene of climate change. Note several lines of evidence refer to 'fossil fuel carbon'. Now read on….

The answer lies in carbon isotopes.

Most chemical elements exist in nature as more than one version. These different versions are an element's isotopes. Carbon is no exception to the rule. Its most important natural isotopes are carbon 12, carbon 13 and carbon 14, written 12C, 13C and 14C. All three contain six protons in their atomic nuclei – that's carbon's atomic number and it's fixed. But carbon 12 atomic nuclei contain six neutrons whereas 13C has seven and 14C has eight.

Carbon 14 only occurs in tiny traces – about one atom per gram of carbon is a ballpark figure. It forms in nature through neutron bombardment of nitrogen atoms from cosmic rays near the top of our atmosphere. Man has had a hand here too: nuclear explosions also produce high-energy neutrons and the weapons-testing mania last century increased the amount of 14C by two orders of magnitude. The isotope is useful since it is radioactive and can be used to radiometrically date geologically young materials. Because its decay-rate is rapid (half-life of 5,700 years), anything more than about 50,000 years old is too 14C-depleted for radiocarbon dating. The fossil fuels, millions to hundreds of millions of years old, are devoid of 14C.

Carbon 12 is stable and very common, constituting 98.93% of all carbon on Earth, with carbon 13 making up the remainder, apart from the tiny amount of carbon 14. In that vital process of photosynthesis, carbon dioxide and water are absorbed by plants. These raw ingredients are converted into nutrients (sugar) and as a by-product, two thirds of their contained oxygen are released to the atmosphere, making it breathable by us and our fellow life-forms. The important bit is that during photosynthesis, carbon isotopes fractionate, meaning that the proportions of 12C and 13C are changed by the chemical reactions involved, with a preferential uptake of 12C in that sugar. So photosynthesis produces a shift in favour of 12C.

Any carbon-bearing sample – a bottle of oil, lump of coal, a piece of calcium carbonate such as limestone or a sea-shell, a flask of air - there are numerous examples – can be analysed and its carbon isotopic composition determined. Therefore, its ratio of 13C to 12C (known as delta or d13C) can be calculated and compared to an internationally-agreed standard composition. The equation is as follows:

delta 13C = ((13C/12C sample)/(13C/12C standard) -1) x 1000%

Now, because of that preferential take-up of 12C in plants, the d13C value, expressed in ‰, of anything derived from their decomposition, combustion, preservation or consumption will be similar. As such the smaller (or more negative) d13C value spreads up the food chain, gets preserved in coal, oil or gas deposits, in carbonate rocks like limestones and in shelly fossils.

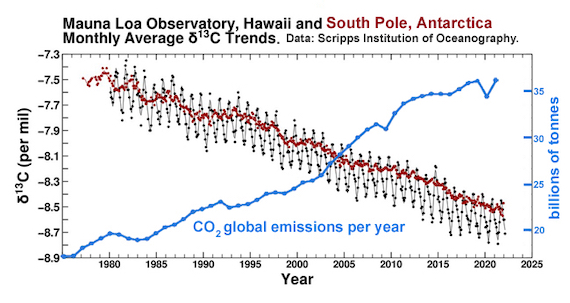
It should come as no surprise, then, that if you dig up and set fire to fossil fuels, the CO2 emitted in that process will give the atmosphere a more negative d13C – and that's exactly what we find. If all the CO2 in the atmosphere was that outgassed by volcanoes, we would see d13C closer to zero; instead the ongoing trend is more and more negative; a cumulative plot from the Mauna Loa and South Pole air sampling stations (fig. 1) shows values of -7.5‰ in 1980, heading steadily downwards to -8.5‰ in 2020. The estimated pre-industrial value is around -6.6‰ (Graven et al. 2020). This is one smoking gun of man-made carbon dioxide emissions. Another is that because the fossil fuels are devoid of 14C, it follows that fossil fuel CO2 emissions are, too - thereby further diluting the already tiny amount of 14C in the atmosphere.

The carbon isotope record


Fig. 1: the carbon isotope record, 1975-2022. Black Dots: Monthly average carbon isotope ratio (d13C) of atmospheric carbon dioxide at Mauna Loa Observatory, Hawai. As with the Keeling Curve of CO2 levels, the graph shows the seasonal wobble caused by photosynthetic plants as leaves grow and then die.Red Dots: Monthly average d13C of atmospheric carbon dioxide at the South Pole, Antarctica.

Carbon isotope ratios are also very useful in geology. Sudden changes in their values, known as positive or negative “excursions”, tell us something monumental has occurred. For example, one of the biggest negative d13C excursions in the geological record marks the end-Permian mass extinction, 250 million years ago (Saitoh & Isozaki 2021).

That one of the most prolonged and voluminous episodes of volcanism in the past 500 million years occurred at the same time as the end Permian mass extinction suggests a lot of CO2 was released back at the time. But volcanogenic CO2, originating in Earth's Mantle, has a “heavier” or more positive d13C of around -6‰. It cannot have caused the negative excursion, but one thing could. In the sedimentary basin through which the magma rose from deep in the Earth there were vast oil and coal deposits and they got comprehensively roasted in the process. It is estimated that as a consequence, the Siberian Traps eruptions released between ten trillion and one hundred trillion tons of carbon dioxide over just a few tens of thousands of years, some of volcanic origin but a heck of a lot from those cooked fossil fuel deposits. What happened in Siberia 250 million years ago thereby presents Mankind with its starkest possible warning about messing with Earth's carbon cycle.

Last updated on 2 July 2023 by John Mason. View Archives

Printable Version  |  Offline PDF Version  |  Link to this page

Argument Feedback

Please use this form to let us know about suggested updates to this rebuttal.

Further reading

Professor Scott Mandia has a detailed explanation of why more CO2 causes stratospheric cooling that is well worth a read.

Denial101x video

Here is a related lecture-video from Denial101x - Making Sense of Climate Science Denial

Comments

Prev  1  2  3  

Comments 51 to 67 out of 67:

  1. As well as nights warming faster than days, I would add winter warming faster than summer (if it was the sun, it would be the other way around), mentioned in the Scientific Guide to Global Warming Skepticism.
  2. In the advanced version of The human fingerprint in global warming dana1981 writes: "Trenberth et al. (2009) used satellite data to measure the Earth's energy balance at the top of the atmosphere (TOA) and found that the net imbalance was 0.9 Watts per square meter". This proposition is false. What Trenberth has actually found in said paper is this: "There is a TOA imbalance of 6.4 W m−2 from CERES data and this is outside of the realm of estimates of global imbalances that are expected from observed increases in carbon dioxide and other greenhouse gases in the atmosphere" That is, Trenberth says satellite data are useless for measuring Earth's energy balance. Then he continues: "The TOA energy imbalance can probably be most accurately determined from climate models and is estimated to be 0.85 ± 0.15 W m−2". So. The energy imbalance is not measured, it is determined using computational climate models. Then, what he actually did to satellite data is described like this: "An upper error bound on the longwave adjustment is 1.5 W m−2, and OLR was therefore increased uniformly by this amount in constructing a best estimate. We also apply a uniform scaling to albedo such that the global mean increase from 0.286 to 0.298 rather than scaling ASR directly, as per Trenberth (1997), to address the remaining error. Thus, the net TOA imbalance is reduced to an acceptable but imposed 0.9 W m−2 (about 0.5 PW)". That is, he increased both OLR and albedo relative to actual data by amounts he considered acceptable in order to arrive at an imposed value of TOA imbalance. Therefore it's not true he has "found that the net imbalance was 0.9 Watts per square meter", but took a value based on model calculations and imposed it on satellite measurements. What Trenberth did is questionable, but defensible in a sense. Whenever you have next to useless data with unknown but large error margins, you either throw it away or do odd things to it in the hope at least something can be saved. If the data are as expensive to collect as CERES data are, NASA scientists have no choice but follow the latter path. On the other hand grave misrepresentation of Trenberth's pain as it is put by dana1981 above, is indefensible. Calculations can be verified against measurements, but they can never be verified against (the same!) calculations. That is, Trenberth's figure of 0.9 W/m2 net imbalance at TOA is still an unverified claim. There is an important difference in science between true and false statements. The latter kind implies anything along with its own negation, therefore it's a bit ill suited for deriving meaningful results.
  3. Dikran, KR + Julian. I have no background in climate, I'm a computer scientists; loving your debate. KR is correct in saying that since we did add 'xyz' amount of CO2, then it is humans who can be attributed to that amount - but KR/Dikram - Julian is correct to point out that it could be entirely meaningless. KR you are throwing straws on the camel's back, maybe you broke the camels back, Julian is pointing out that your straws - though technically 'added' are irrelevant given that others were adding and removing straws from the camels back by an unknown amount. KR - Julian is not proposing a 'Green Little Man' argument - he's indicating that the other sources/sinks for CO2 could indeed be quite vast. If they are - and they are highly variable - then his assertions are not only correct, but meaningful. You are sharing a bank account with a 'black box'. You know the black box withdraws and adds X amount every month. You know that you add $16 every month. The bank account seems to be rising by ~$16 every month. You know for sure that the 'black box' NET contributions monthly are 0 - but you have no idea why, or what the net attributions are. To KR's point, it is reasonable to conclude that since you are adding $16 every month - well - you are adding $16 every month - no doubt about it. KR is technically correct - but his point may be mute. Julian's point is that the black-box may be inserting/removing 1000's every month - you don't know. If this is the case - then KR your point is mute - it doesn't matter if we are adding $16 a month. Dikram, your analysis would be off. The Dikram/KR/Julian debate boils down to this: If the plus/minus CO2 contributions via sinks/sources from 'non man made sources' (I'n not going to use the proper scientific term since I'm not sure of it's meaning) is rather large, and it varies quite a lot over time - then Julian's position is not only technically correct, but it is very valid. If those net contributions can be definitely characterized as stable and small, then we can safely follow Dirkam's points on the matter and KR's point that 'we are adding X amount every year' matters - because our contributions are meaningful. I'm guessing however, that we don't really understand the size and magnitude of these other heat-sinks, and that they may be highly variable. If this is the case then Julian's point should be considered. KR is technically correct but his point is mute - and Dikram's analysis must be flawed.
  4. jomamax - I would have to forcefully disagree. If we know: * We are contributing X to the bank balance * We know the total balance to be increasing at X/2 Then: * Other contributions and deductions from that balance are such that other contributions are X/2 less than deductions; that the other influences on the balance are a net sink. It doesn't matter how much those other contributions/deductions vary in toto - the difference between them is established to be negative X/2 by observing our contributions and the total balance. By knowing how much CO2 we put out and how much the atmospheric levels increase - we know two of the four values, and hence we really do know the difference between the other two. Stable, varying, whatever; it just doesn't matter. We know what the difference is between the natural sinks and sources, and it adds up to about half of our emissions - nature is a net sink. There's just no other way possible to work the math, barring Little Green Men (LGM's) adding or subtracting carbon from the biosphere. And if you make that kind of causal assertion, well, I'm going to feel completely justified at laughing...
  5. This debate is also going on in the Murray Salby thread. jomamax: you have several "ifs" that are "aren'ts". 1) "black-box may be inserting/removing 1000's every month - you don't know.". Yes, we do know, with a fair degree of accuracy (but not perfectly). The known fluxes in the carbon cycle don't have error bars that large. 2) "If the plus/minus CO2 contributions via sinks/sources from 'non man made sources' (I'n not going to use the proper scientific term since I'm not sure of it's meaning) is rather large, and it varies quite a lot over time". It is large, but it's not varying that much over time - at least, not in amounts that we don't know about (point 1). CO2 was fairly steady (with a seasonal cycle) for a long time before people started burning fossil fuels, and we know a lot about the cycles. 3) "If those net contributions can be definitely characterized as stable and small,". They don't need to be small, and they don't need to be stable for us to have reasonable estimates of them. You'd need to have large, variable errors in the measurements of those fluxes, and that's not the case (point 1). 4) "I'm guessing however, that we don't really understand the size and magnitude of these other heat-sinks". You'd be guessing wrong. (I presume you meant CO2 sinks.) In addition, you have to remember that in the bank balance scenario, you are also using marked bills. Unless the other sources/sinks are marking the bills exactly the same way, the source is obvious. CO2 from fossil fuels is depleted in C14, and has a C12/C13 mix that does not match other sources of CO2 that are depleted in C14.
  6. jomamax The mass balance argument is correct regardless of how large natural emissions are. It is easy to show why this is true using the savings analogy. Say I share a savings jar with my wife (who represent the natural environment), that is guarded by loyal ninja to make sure only she and I can make deposits and withdrawals. If I put in $16 a month and notice that our savings rise by only $8 a month, then I know that my wife is spending $8 more a month than she is saving. This is true whether she saves $1 a month and spends $9, or if she saves $10 a month and spends $18, or if she saves $100 a month and spends $108, ..., or if she save $1,000,000,000 and spends $1,000,000,008. As it happens, we do know that natural emissions are much larger than anthropogenic emissions. We know this because the residence time of CO2 in the atmosphere is only 4-5 years, which means there must be a very large exchange flux that swaps about 20% of atmospheric CO2 each year with CO2 from the oceans and terrestrial biota. However this exhange is just that, a straight swap of CO2 between reservoirs, and has no effect whatsoever on atmospheric CO2 concentrations. As Murray Salby says, it is only the difference between total emissions and total uptake that matters, and the mass balance equation shows that even if natural emissions are much bigger than anthropogenic emissions, natural uptake is bigger still. This means the natural environment is actively opposing the rise. If you think Julian is right and the absolute magnitude of natural emissions matters (rather than the difference between natural emissions and natural uptake), then it should be possible for you or Julian to come up with a counter example, in the form of values for natural emissions, natural uptake, anthropogenic emissions and the annual rise in CO2, where the natural environment is a net carbon source and the observed rise is less than anthropogenic emissions, and doesn't violate conservation of mass. You will find that you can't. Note I challenged Julian to do so, and he ducked the challenge, and did not reply to my post pointing out that he had ducked the challenge.
  7. Hi and thank you all for this very interesting and enlightening discussion. Great website here! If I understand correctly, the LGM ("little green men") point is the key point here. The mass balance is right by logic, but I think Julian points out that the mass balance may not be all about it (might be "the wrong level of abstraction") because nature sources/sinks might not be as constant as we assume. Let me try the challenge issued by Dikran: year 1: +70.000 natural +200 humans -70.100 natural -> +100 year 2: +70.000 natural +0 humans -70.100 natural -> -100 so far the mass balance argument, as I understand it. Now suppose the "little green men" like this: year 3: +70.000 natural +0 humans -69.900 natural -> +100 or, with human contribution still in the picture, like this: year 2bis: +70.000 natural +200 humans -70.050 natural -> +150 What has happened here? Little green men? Yes, but natural little green men, if you will. In year 3, human is still +0, but a natural sink suddenly decreased, by a small amount. Or, alternatively, in year 2bis, human is still contributing, but natural sinks have suddenly decreased. This is outside the mass balance argument, but this seems to be Julian's point: Nature's part is so huge in comparison, that even small fluctuations may happen arbitrarily, which completely make human's part arbitrary in the long term picture. Julian, does this capture your point? Of course, this is just about that the mass balance argument alone is not enough. If we add indications, theories and evidence, we should be back to the result that human contribution is decisive, because any such thinkable natural fluctuations have not been evidenced so far. And I think that is the core of Julian's criticism. Is that conclusion from evidence valid? Basically, you all here point out, yes. But why? But this refers to a point made from outside the mass balance logic, so maybe we should admit to that the mass balance argument alone is not proof, but rather strengthens existing evidence? If we came so far, how exactly is existing evidence strengthened by the mass balance? Because the past shows us clearly a constant natural net (200ppm), until human contribution kicks in (to 395ppm)? How do we know human contribution is +195ppm? If I understand correctly, fossil isotopes in the atmosphere are only about 5%, which would be roughly 20ppm. So, there is even more evidence to be linked. Which?
  8. Falkenherz, I believe Tom Curtis has addressed some of this recently here. It should probably be incorporated into this article.
  9. DSL, I read it, and it provides for several indicators of evidence. But I meant specifically the mass balance argument, and the comments here provide for much more detail already than in that article. I, as Julian, might just have a gap of logic here, and I hope that listing these very simplified figures will make it clear for me, if someone can point it out where they goe offroad.
    Response: [DB] A deeper-level analysis of the mass-balance problem for "skeptics" is found here.
  10. Thanks, I will be commenting over there.
  11. Falkenherz, the problem is that your example assumes we only know one variable... the total atmospheric accumulations (the end result of each of your calcualtions). That is incorrect. We know accumulations and human emissions. The mass balance argument only works when using both of those values. Thus, your counter argument is 'correct' only if we ignore some of the data we have.
  12. I wrote to Prof Essenhigh a couple of years back when his paper came out. Not having received a response since, I thought I'd write an open letter to him: Open letter to Prof Essenhigh Brilliant that there's a peer review response now (Skeptical Science's Dikran Marsupial's response)
  13. Response to Sphaerica from 'Inuit Perspectives on Recent Climate Change' - transferred to this thread at moderator's request. Sphaerica: Just to reinforce my point – more observations from the real world. Ice conditions in the Baltic Sea vary a lot from one year to another. The maximum ice covered area varies between 52,000 and 422,000 square kilometres(12-100 per cent of the total Baltic Sea area) Baltic Sea Portal: itameriportaali.fi/en/tietoa/jaa/jaatalvi/en_GB/jaatalvi Clearly the Baltic Sea has remained free of the malign influence of CO2. Here’s more: JOURNAL OF GEOPHYSICAL RESEARCH, VOL. 106, NO. C3, P. 4493, 2001 doi:10.1029/1999JC000173 'Influence of atmospheric circulation on the maximum ice extent in the Baltic Sea' Anders Omstedt Swedish Meteorological and Hydrological Institute, Norrköping, Sweden Deliang Chen Department of Earth Sciences, University of Göteborg, Göteborg, Sweden This work analyzes long-term changes in the annual maximum ice extent in the Baltic Sea and Skagerrak between 1720 and 1997. It focuses on the sensitivity of the ice extent to changes in air temperature and on the relationships between the ice extent and large-scale atmospheric circulation. A significant regime shift in 1877 explains the decreasing trend in the ice extent. The regime shift indicates a change from a relatively cold climate regime to a relatively warm one, which is likely a result of changed atmospheric circulation. In addition, the analysis shows that a colder climate is associated with higher variability in the ice extent and with higher sensitivity of the ice extent to changes in winter air temperature. Moreover, the ice extent is fairly well correlated with the North Atlantic Oscillation (NAO) index during winter, which supports the results of earlier studies. However, the moving correlation analysis shows that the relationship between the NAO index and the ice extent is not stationary over time. A statistical model was established that links the ice extent and a set of circulation indices. It not only confirms the importance of the zonal flow but also implies the impact of meridional wind and vorticity. The usefulness of the statistical model is demonstrated by comparing its performance with that of a numerical model and with independent observations. The statistical model achieves a skill close to that of the numerical model. We conclude that this model can be a useful tool in estimating the mean conditions of the ice extent from monthly pressures, allowing for the use of the general circulation model output for predictions of mean ice extent. Finally, the globe is warming? Is it? http://data.giss.nasa.gov/gistemp/graphs_v3/Fig.C.gif
  14. Carbon500 - With regards to your extended reference, yes, ice extent certainly does vary based on a number of influences. Relevance? In regards to the graph you refer to, containing temperature data only from 1996, I would refer you to the Did global warming stop in 1998, 1995, 2002, 2007, 2010 thread. Cherry-picking short intervals proves nothing about long term trends - that's weather. If you look at those long term trends, however, at climate, you see something quite different (GISTEMP and 10 year averages).
  15. Carbon500, Sorry, but your gish-gallop is 100% silliness. My original point was: "And what evidence do you have that your anecdotal evidence is equivalent to what we are seeing today?" And you respond with yet more anecdotal evidence, in this case, a narrowly focused view of ice in one part of the world, as if that is then evidence that the entire globe is not warming. I'm sorry, Carbon500, this is a 100% fail. You're going to have to try a lot harder than just listing whatever papers you can find with google-search.
  16. Carbon500, from your post here: I've seen a reproduction of this quote in quite a number of places - it seems to be a bit of a darling quote of the so-called 'skeptics' - a report from the early 20th Century indicating that conditions in the Arctic are notably warmer than in the late 19th Century. You quoted this as though it's somehow surprising or that it refutes anthropogenic causes for global warming. A 1920s observer in the Arctic might notice that, compared to the late 19th Century, glaciers had retreated somewhat and that sea ice was reduced in extent. An observer in the early 21st Centuey can observe that the same glaciers are considerably further back and continuing to retreat at a rapid rate [Some slightly readvanced in the 1960s-1980s in response to favourable conditions in the 1960s and 1970s]. A 21st Century glacial geomorphologist can observe that glaciers in Iceland, Norway, the Alps and elsewhere reached their greatest "Little Ice Age" extent in the late 19th Century (historical records, lichenometry etc) leaving large moraines behind. This is no surprise! We know there has been warming sice at least the late 19th Century. We have a pretty good idea of the causes of the warming through the 20th century: early warming had a large component of solar activity and a reduction in volcanic activity in addition to the initial component of post-Industrial Revolution greenhouse gas emissions. As we moved through the 20th Century, the GHG forcing increased to be the strongest of all the forcings, such that we cannot explain our current trajectory of warming if we ignore GHG physics (unless you believe in climate fairies, which I don't). The Arctic is continuing to respond to those forcings. The skeptics' claims that early 20th Century observations of the beginning of the thaw of the high Arctic, which is contiuing through the present day somehow contradicts our understanding of GHGs and climate, is frankly absurd. It's a transparent attempt to mislead the unwary reader by drawing a false parallel between the 1920s and today. We see that the Arctic is a much less ice-covered place than it was 40 (or 80, or 120 years ago), an observer in the 1920s saw that the Arctic was less ice-covered than in the 1880s. That 1920s observer would be astonished to see how little ice is in the Arctic now compared to the 1920.
  17. KR: The point I made is that ice melting depends on many influences, and I think that caution is needed when attributing ice melt extent to CO2. That’s why I gave the Omstedt and Chen reference as an example. Regarding global temperatures, I am of course aware of the other graphs you mention, and the argument that the current stalling of warming is too short a period from which to draw firm conclusions – and yes, I am aware of the difference between weather and climate. (-snip-)? Sphaerica: (-snip-). Skywatcher: We agree that warming has in essence been in progress since the 19th century, but I’m more cautious than you about the 20th century. (-snip-). Another reason for my caution goes further back in the climatic record. (-snip-) Clearly Nature can surprise us. (-snip-) (-snip-). (-snip-)?
    Response: [DB] Multiple off-topic and inflammatory snipped. As constructed, this comment comprises a Gish Gallop. Future such comments will be deleted in their entirety.
  18. Carbon500 - In some respects the graph you posted earlier is very interesting. Go to the Temperature Trends tool here, and look at GISTEMP (I will note in passing that you did not identify the source of your graph, or the selections from which it was generated - very bad form). Set a starting point of 1996 and smoothing of 1 month, as per that graph (source identified only from the URL), and look at the trend. 2σ uncertainties are calculated with added uncertainty due to autocorrelation, so this is a reasonably conservative estimate. Trend: 0.123 ±0.130 °C/decade (2σ) What does this set of data mean? There is a temperature trend of 0.123°C/decade, but it is is not quite statistically significant over that period. More data, more time is needed to truly distinguish that trend from the null hypothesis of no warming. But even your "no warming" example actually shows warming consistent with 30 and 40 year trends. Your claim that "this sixteen year old record cannot be ignored" is a strawman argument (it's not ignored, but it's not statistically significant - it's part of the data that is statistically significant), and indicates that you are lacking in statistical insight - as your presented evidence contradicts your claims (since it indeed shows warming). In other words, your use of that graph in an attempt to claim no warming is (IMO) quite demonstrative of denial myths - myths that sources like SkS are (I am happy to see) working to dismiss as the silliness they are. Finally, regarding experimental evidence of CO2 trapping heat - take a look at Harries 2001 directly showing energy entrapment at CO2 frequencies, which is discussed here regarding incremental effects as well as here regarding empirical evidence. If you disagree with the evidence, present your evidence on the appropriate threads. WRT water vapor, search using the SkS "Search" box for water vapor, or look at Google Scholar. Your claim that the role of CO2 as a greenhouse gas hasn't been experimentally proven is, to be blunt, complete and unsupported nonsense.
  19. KR: Sometimes it's useful to stand back and just look at the contours of a graph rather than playing games with trend lines and placing all your faith in statistical results. I have a good reason for saying this. In an industrial research project on which I was engaged many years ago the statistics of a crucial experiment showed significance (and yes the correct test was used, in case you're wondering), but because I was suspicious further experiments ensued and a great deal of time and money was subsequently saved on the project on which I was engaged. The section of graph I'm talking about is quite different in character from what precedes it. Never mind, you look at it your way, I'll look at it mine. Where have I made the claim that the role of CO2 as a greenhouse gas hasn't been experimentally proven? Have I even suggested that I have issues with satellite data? Had you read what I said properly, you would have noted that I was enquiring as to whether a laboratory experiment using an artificial atmosphere had ever been carried out to assess the effects of CO2.
  20. Carbon500 wrote: "Sometimes it's useful to stand back and just look at the contours of a graph rather than playing games with trend lines and placing all your faith in statistical results." So... avoid any hint of actual math and just let your preconceived notions guide your 'understanding' of the data? "The section of graph I'm talking about is quite different in character from what precedes it." True, in that it does not show as rapid an increase in atmospheric temperatures... but you implied ("Finally, the globe is warming? Is it?") that it doesn't show an increase at all, which is simply false. Even if it weren't false it would be the wrong graph for what you purport to be disputing. That's a graph of lower atmospheric temperatures, not "the globe". The oceans of the world are a vastly greater reservoir of energy than the lower atmosphere... and measurements of ocean water continue to show a high rate of warming. Finally, even if we could use just the lower atmosphere to determine whether the globe was warming, while ignoring the vastly more significant oceans, and we pretended that the lower atmospheric graph you posted did not show the warming trend it actually does... your 'conclusions' would still be wrong because there has been extensive research on the various factors at play in atmospheric temperatures over the past hundred years and the 'difference in character' you note has been explained by measured changes in factors other than the greenhouse gas forcing. Basically, greenhouse gas warming continues to increase and is the primary driver of the continuing warming trend. The short term variability you cling to is the result of other smaller factors (e.g. solar radiation, volcanic eruptions, soot, et cetera) varying up and down enough to change the slope of the trend over short time frames... but not enough to stop the inexorable upwards march.
  21. Carbon500 - "Where have I made the claim that the role of CO2 as a greenhouse gas hasn't been experimentally proven?" Let me refresh your memory. In your last post, which I replied to before it was snipped for being a Gish Gallop, you said:
    Does this really mean that the foundation stone of the CO2 story hasn’t been verified experimentally, and that calculated forcings are all the evidence there is?
    You did indeed make that claim - and it is indeed completely unsupportable given direct evidence such as Harries 2001.
  22. KR: It depends on what you mean by an experiment. To me an experiment is something which has been set up so that variables can be controlled by the experimenter, hence my comments regarding an artificial atmosphere. CBDunkerson: the graph I'm talking about is entitled 'Monthly Mean Global Surface Temperature'- you don't agree with the way I see it; so be it. (-snip-)
    Response: [DB] Off-topic snipped. Please follow the link that Adelady was kind enough to provide for a discussion of that newspaper article.
  23. carbon500, You need to check out the latest SkS post.
  24. Carbon500, if you make reality a matter of perception then we have no common basis for discussion. Either the globe consists of more than the surface atmosphere (e.g. oceans, higher layers of the atmosphere, et cetera) or it does not. Either the graph you posted showed a warming trend or it did not. If you truly believe the 'not' position on either of these issues then 'the way you see it' is at odds with perceived reality 'the way I see it'.
  25. adelady: thank you for your comment. CBDunkerson: I agree - clearly we have no common basis for discussion. Ditto KR.

Prev  1  2  3  

Post a Comment

Political, off-topic or ad hominem comments will be deleted. Comments Policy...

You need to be logged in to post a comment. Login via the left margin or if you're new, register here.

Link to this page


The Consensus Project Website

THE ESCALATOR

(free to republish)


© Copyright 2024 John Cook
Home | Translations | About Us | Privacy | Contact Us