Climate Science Glossary

Term Lookup

Enter a term in the search box to find its definition.

Settings

Use the controls in the far right panel to increase or decrease the number of terms automatically displayed (or to completely turn that feature off).

Term Lookup

Settings


All IPCC definitions taken from Climate Change 2007: The Physical Science Basis. Working Group I Contribution to the Fourth Assessment Report of the Intergovernmental Panel on Climate Change, Annex I, Glossary, pp. 941-954. Cambridge University Press.

Home Arguments Software Resources Comments The Consensus Project Translations About Support

Bluesky Facebook LinkedIn Mastodon MeWe

Twitter YouTube RSS Posts RSS Comments Email Subscribe


Climate's changed before
It's the sun
It's not bad
There is no consensus
It's cooling
Models are unreliable
Temp record is unreliable
Animals and plants can adapt
It hasn't warmed since 1998
Antarctica is gaining ice
View All Arguments...


Username
Password
New? Register here
Forgot your password?

Latest Posts

Archives

Sun & climate: moving in opposite directions

What the science says...

Select a level... Basic Intermediate Advanced

The sun's energy has decreased since the 1980s but the Earth keeps warming faster than before.

Climate Myth...

It's the sun

"Over the past few hundred years, there has been a steady increase in the numbers of sunspots, at the time when the Earth has been getting warmer. The data suggests solar activity is influencing the global climate causing the world to get warmer." (BBC)

At a glance

Thankfully for us, our Sun is a very average kind of star. That means it behaves stably over billions of years, steadily consuming its hydrogen fuel in the nuclear reaction that produces sunshine.

Solar stability, along with the Greenhouse Effect, combine to give our planet a habitable range of surface temperatures. In contrast, less stable stars can vary a lot in their radiation output. That lack of stability can prevent life, as we know it, from evolving on any planets that might orbit such stars.

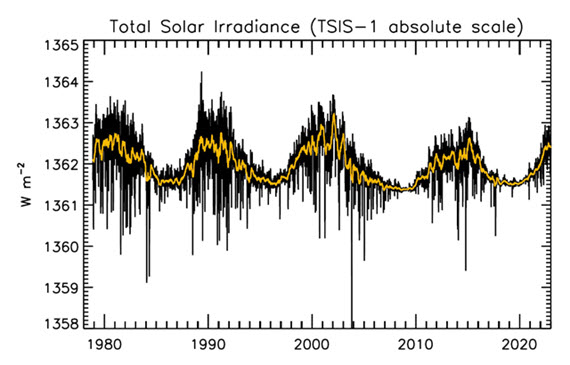
That the Sun is a stable type of star is clearly demonstrated by the amount of Solar energy reaching Earth's average orbital position: it varies very little at all. This quantity, called the Total Solar Irradiance, has been measured for around forty years with high accuracy by sensitive instruments aboard satellites. Its average value is 1,362 watts per square metre. Irradiance fluctuates by about a watt either way, depending on where we are within the 11-year long sunspot cycle. That's a variation of no more than 0.15%.

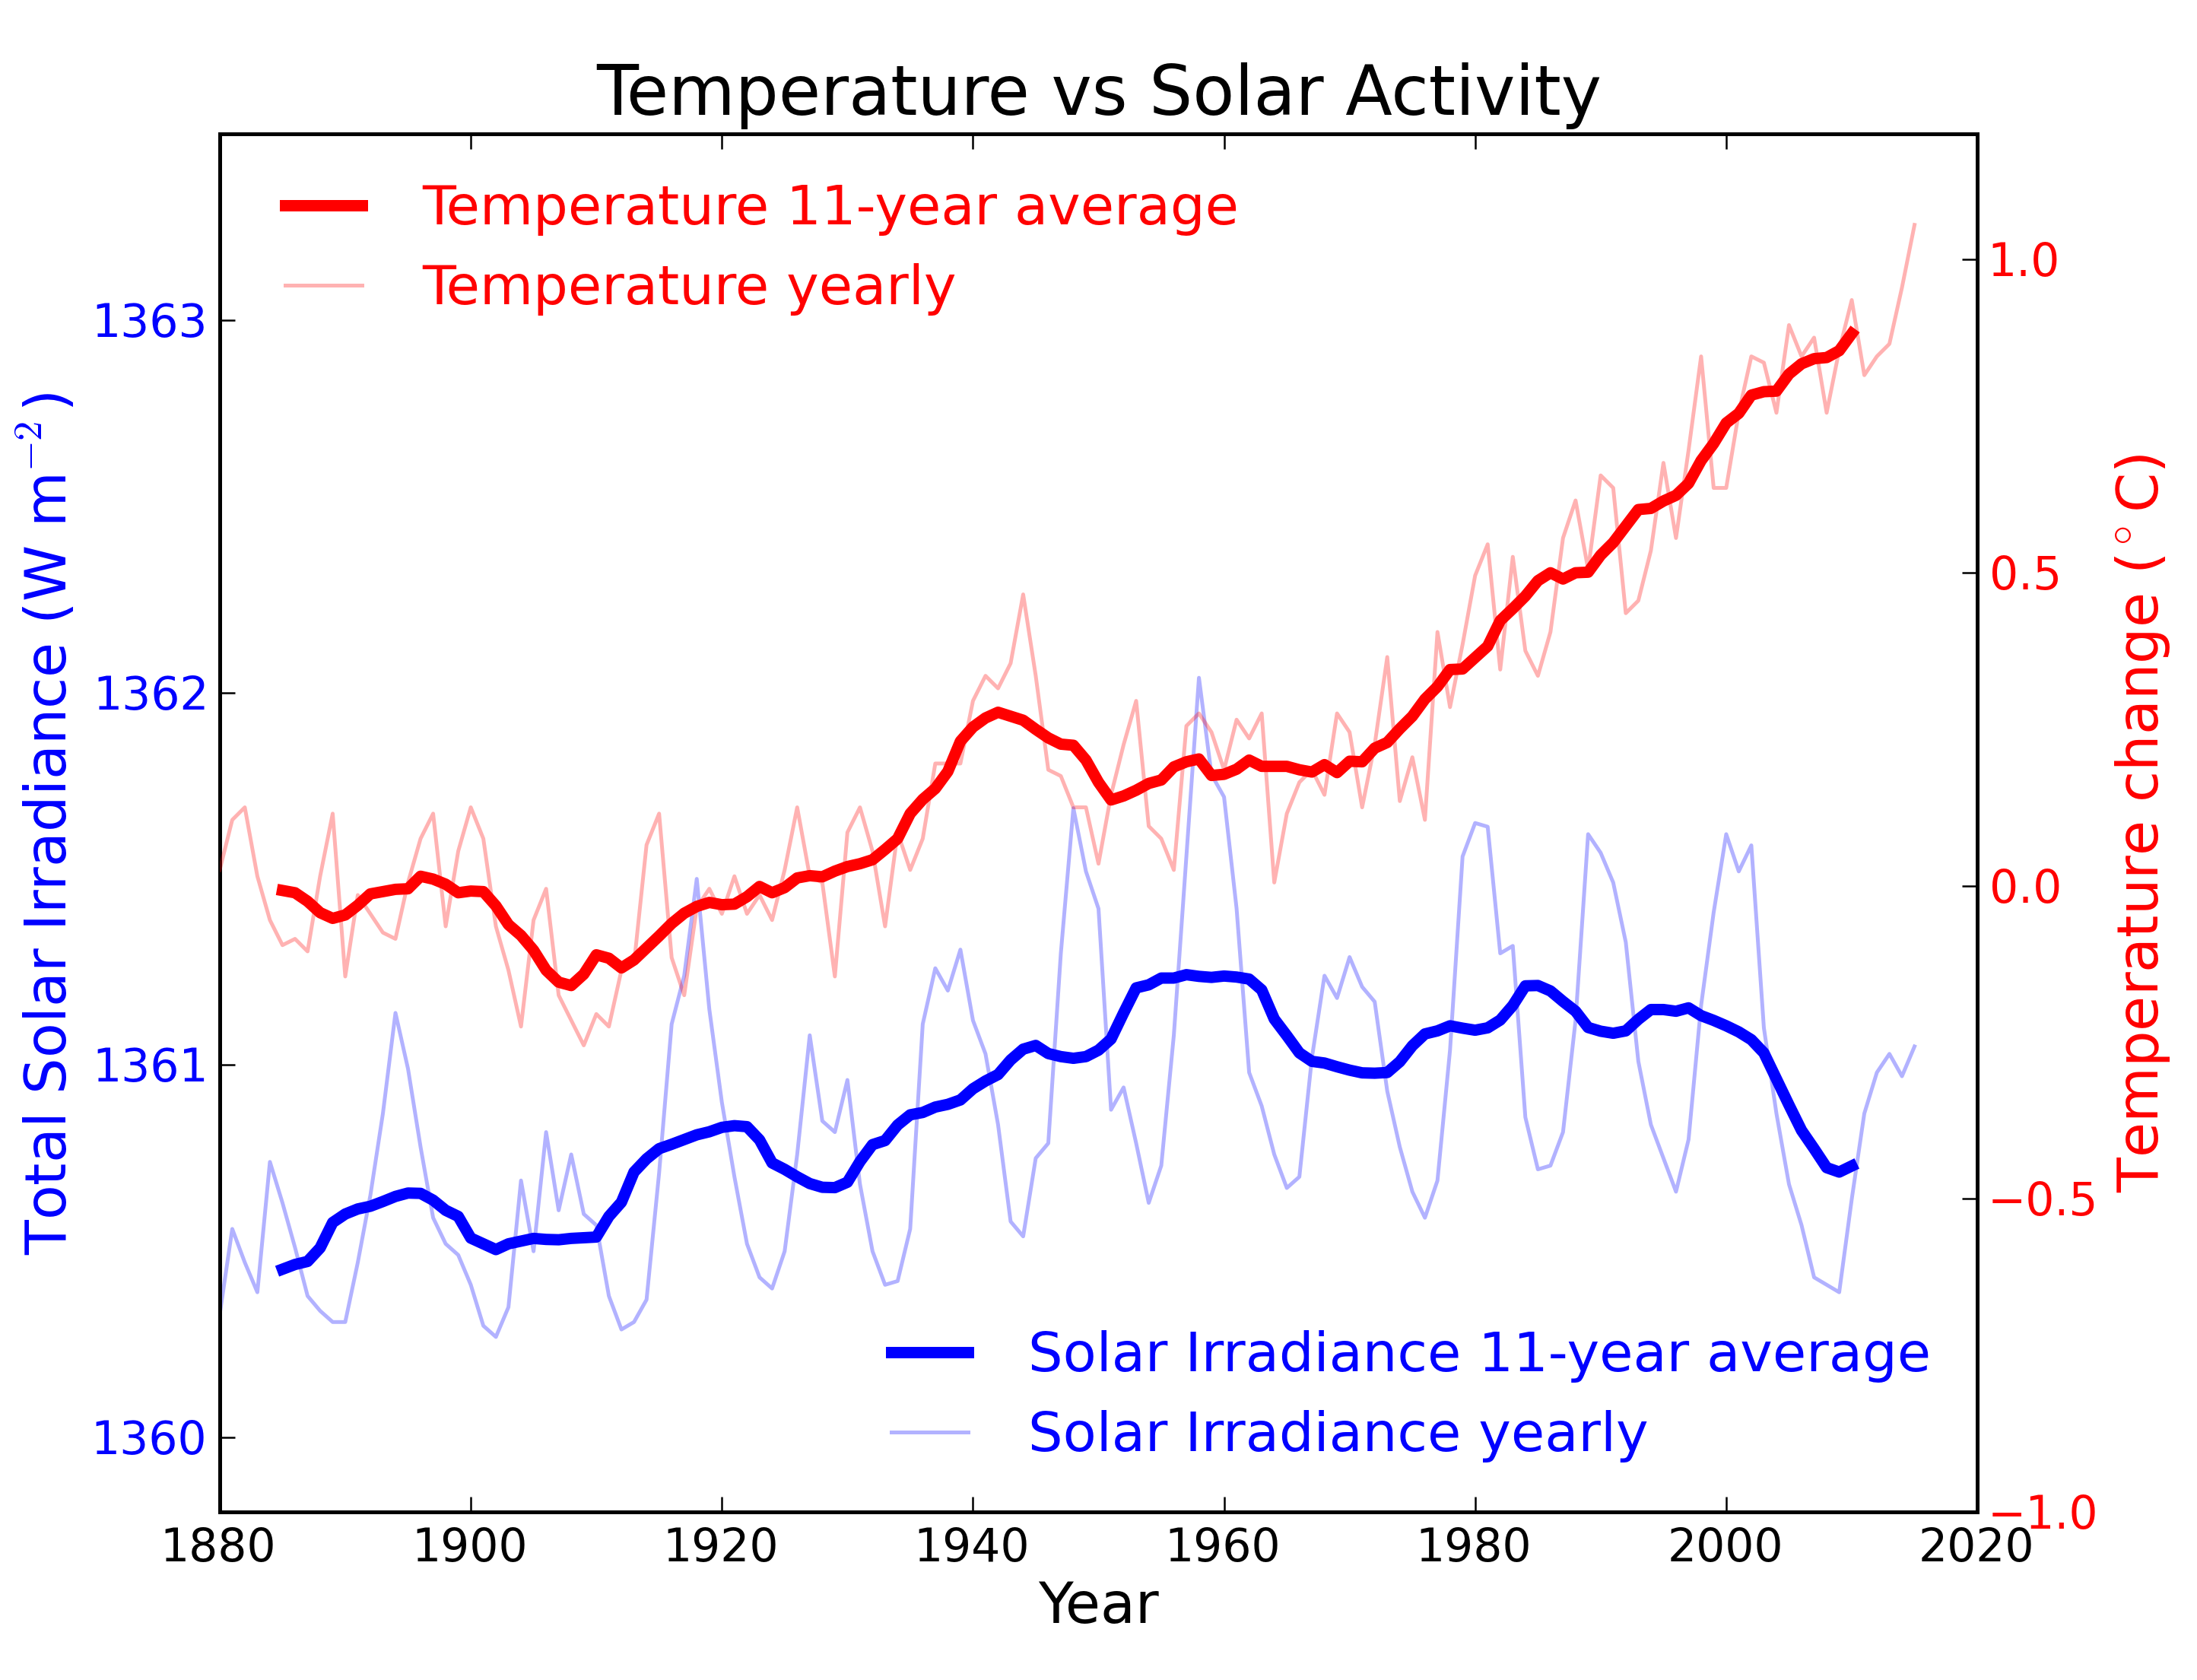
From the early 1970s until today, the Solar radiation reaching the top of Earth's atmosphere has in fact shown a very slight decline. Through that same period, global temperatures have continued to increase. The two data records, incoming Solar energy and global temperature, have diverged. That means they have gone in opposite directions. If incoming Solar energy has decreased while the Earth continues to warm up, the Sun cannot be the control-knob of that warming.

Attempts to blame the sun for the rise in global temperatures have had to involve taking the data but selecting only the time periods that support such an argument. The remaining parts of the information - showing that divergence - have had to be ditched. Proper science study requires that all the available data be considered, not just a part of it. This particular sin is known as “cherry-picking”.

Please use this form to provide feedback about this new "At a glance" section, which was updated on May 27, 2023 to improve its readability. Read a more technical version below or dig deeper via the tabs above!


Further details

Our Sun is an average-sized main sequence star that is steadily using its hydrogen fuel, situated some 150 million kilometres away from Earth. That distance was first determined (with a small error) by a time consuming and complex set of measurements in the late 1700s. It led to the first systemic considerations of Earth's climate by Joseph Fourier in the 1820s. Fourier's number-crunching led him to realise a planet of Earth's size situated that far from the Sun ought to be significantly colder than it was. He was thereby laying the foundation stone for the line of enquiry that led after a few decades to the discovery of what we now call the Greenhouse Effect – and the way that effect changes in intensity as a response to rising or falling levels of the various greenhouse gases.
TSI Solar cycles

Figure 1: Plot of the observational record (1979-2022) on the scale of the TSIS-1 instrument currently flying on the space station. In this plot, the different records are all cross calibrated to the TSIS-1 absolute scale (e.g., the TSIS1-absolute scale is 0.858 W/m^2 higher than the SORCE absolute scale) so the variability of TSI in this plot is considered to be its “true variability” (within cross calibration uncertainties). Image: Judith Lean.

The Sun has a strong magnetic field, but one that is constantly on the move, to the extent that around every 11 years or so, Solar polarity flips: north becomes south, until another 11 years has passed when it flips back again. These Solar Cycles affect what happens at the surface of the Sun, such as the sunspots caused by those magnetic fields. Each cycle starts at Solar Minimum with very few or no sunspots, then rises mid-cycle towards Solar Maximum, where sunspots are numerous, before falling back towards the end. The total radiation emitted by the Sun – total solar irradiance (TSI) is the technical term – essentially defined as the solar flux at the Earth's orbital radius, fluctuates through this 11-year cycle by up to 0.15% between maximum and minimum.

Such short term and small fluctuations in TSI do not have a strong long term influence on Earth's climate: they are not large enough and as it's a cycle, they essentially cancel one another out. Over the longer term, more sustained changes in TSI over centuries are more important. This is why such information is included, along with other natural and human-driven influences, when running climate models, to ask them, “what if?"

An examination of the past 1150 years found temperatures to have closely matched solar activity for much of that time (Usoskin et al. 2005). But also for much of that time, greenhouse gas concentrations hardly varied at all. This led the study to conclude, "...so that at least this most recent warming episode must have another source."
TSI vs. T
Figure 2: Annual global temperature change (thin light red) with 11 year moving average of temperature (thick dark red). Temperature from NASA GISS. Annual Total Solar Irradiance (thin light blue) with 11 year moving average of TSI (thick dark blue). TSI from 1880 to 1978 from Krivova et al. 2007. TSI from 1979 to 2015 from the World Radiation Center (see their PMOD index page for data updates). Plots of the most recent solar irradiance can be found at the Laboratory for Atmospheric and Space Physics LISIRD site.

The slight decline in Solar activity after 1975 was picked up through a number of independent measurements, so is definitely real. Over the last 45 years of global warming, Solar activity and global temperature have therefore been steadily diverging. In fact, an analysis of solar trends concluded that the sun has actually contributed a slight cooling influence into the mix that has driven global temperature through recent decades (Lockwood, 2008), but the massive increase in carbon-based greenhouse gases is the main forcing agent at present.

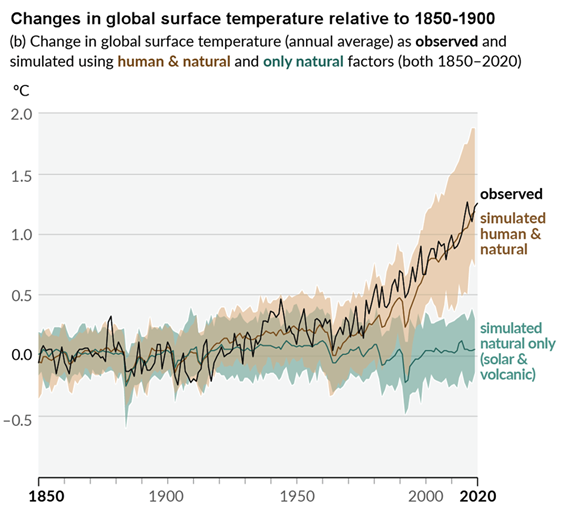
Other studies tend to agree. Foster & Rahmstorf (2011) used multiple linear regression to quantify and remove the effects of the El Niño Southern Oscillation (ENSO) and solar and volcanic activity from the surface and lower troposphere temperature data.  They found that from 1979 to 2010, solar activity had a very slight cooling effect of between -0.014 and -0.023°C per decade, depending on the data set. A more recent graphic, from the IPCC AR6, shows these trends to have continued.

AR6 WGI SPM Figure 1 Panel p

Figure 3: Figure SPM.1 (IPCC AR6 WGI SPM) - History of global temperature change and causes of recent warming panel (b). Changes in global surface temperature over the past 170 years (black line) relative to 1850–1900 and annually averaged, compared to Coupled Model Intercomparison Project Phase 6 (CMIP6) climate model simulations (see Box SPM.1) of the temperature response to both human and natural drivers (brown) and to only natural drivers (solar and volcanic activity, green). For the full image and caption please click here or on the image.

Like Foster & Rahmstorf, Lean & Rind (2008) performed a multiple linear regression on the temperature data, and found that while solar activity can account for about 11% of the global warming from 1889 to 2006, it can only account for 1.6% of the warming from 1955 to 2005, and had a slight cooling effect (-0.004°C per decade) from 1979 to 2005.

Finally, physics does not support the claim that changes in TSI drive current climate change. If that claim had any credence, we would not expect to see the current situation, in which Earth's lower atmosphere is warming strongly whereas the upper atmosphere is cooling. That is exactly the pattern predicted by physics, in our situation where we have overloaded Earth's atmosphere with greenhouse gases. If warming was solely down to the Sun, we would expect the opposite pattern. In fact, the only way to propagate this myth nowadays involves cherry-picking everything prior to 1975 and completely disregarding all the more recent data. That's simply not science.

Longer-term variations in TSI received by Earth

It's also important to mention variations in TSI driven not by Solar energy output but by variations in Earth's orbit, that are of course independent of Solar activity. Such variations, however, take place over very long periods, described by the Milankovitch orbital cycles operating over tens of thousands of years. Those cycles determine the distance between Earth and the Sun at perihelion and aphelion and in addition the tilt the planet's axis of rotation: both affect how much heat-radiation the planet receives at the top of its atmosphere through time. But such fluctuations are nothing like the rapid changes we see in the weather, such as the difference between a sunny day and a cloudy one. The long time-factor ensures that.

Another even more obscure approach used to claim, "it's the sun" was (and probably still is in some quarters) to talk about, "indirect effects". To wit, when studies can't find a sufficiently large direct effect, bring even lesser factors to the fore, such as cosmic rays. Fail.

In conclusion, the recent, post 1975 steep rise in global temperatures are not reflected in TSI changes that have in fact exerted a slight cooling influence. Milankovitch cycles that operate over vastly bigger time-scales simply don't work quickly enough to change climate drastically over a few decades. Instead, the enormous rise in greenhouse gas concentrations over the same period is the primary forcing-agent. The physics predicted what is now being observed.

Last updated on 27 May 2023 by John Mason. View Archives

Printable Version  |  Offline PDF Version  |  Link to this page

Argument Feedback

Please use this form to let us know about suggested updates to this rebuttal.

Related Arguments

Further viewing

Related video from Peter Sinclair's "Climate Denial Crock of the Week" series:

Further viewing

This video created by Andy Redwood in May 2020 is an interesting and creative interpretation of this rebuttal:

Myth Deconstruction

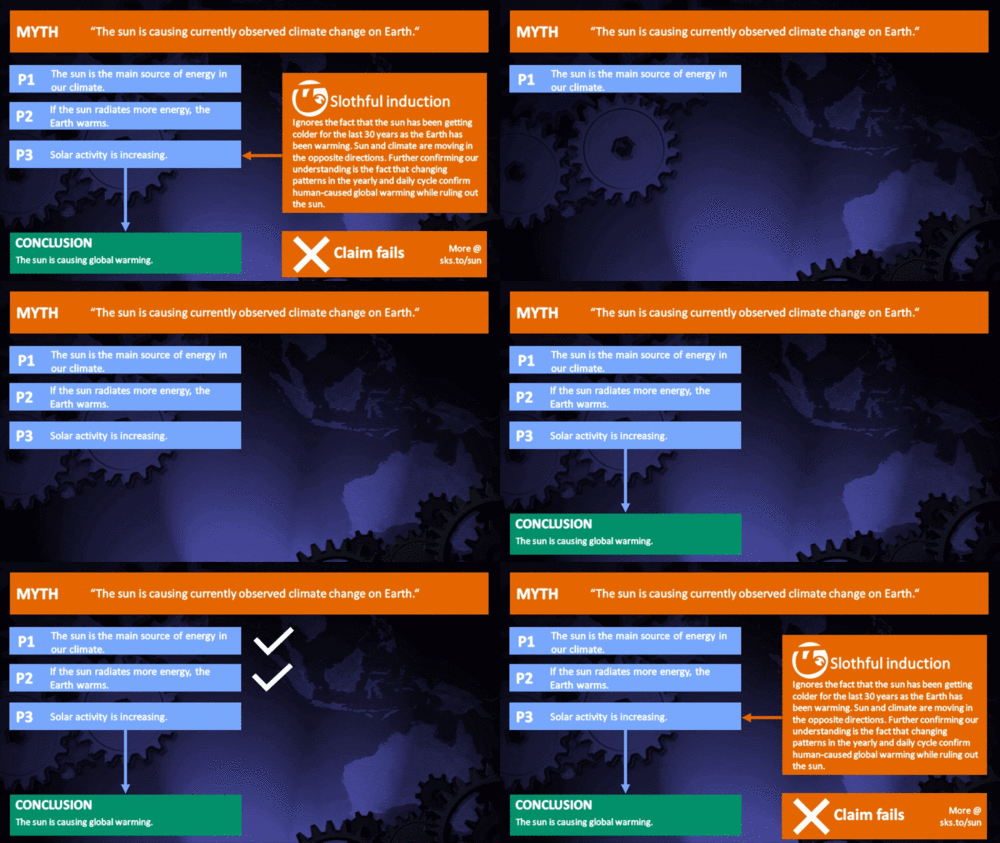
Related resource: Myth Deconstruction as animated GIF

MD Sun

Please check the related blog post for background information about this graphics resource.

Denial101x videos

Related lecture-videos from Denial101x - Making Sense of Climate Science Denial

and

Additional video from the MOOC

Expert interview with Mike Lockwood

Comments

Prev  6  7  8  9  10  11  12  13  14  15  16  17  18  19  20  21  22  23  24  25  Next

Comments 376 to 400 out of 1232:

  1. Dan - another point before getting back to a simple illustration of climate sensitivity and feedback: You mentioned a lack of correlation of temperature to CO2 in recent times. Less than perfect correlation does not mean zero correlation. Over any given time period, even when there is cause and effect between two variables, one may find less or more correlation - there will be a scattering of correlations. This scattering will become large if the time periods are short. Why? 1. There can be other forcings. I think the effect of solar forcing has been minor compared to anthropogenic effects in total and especially in the last few decades, but I wouldn't say it is zero, and there could be some climate variation corresponding to shorter-term cycles (11 years, etc.). There is also the occasional volcanic eruption. Anthropogenic aerosol forcing (of various types, but adding up to a net cooling effect) has not been in constant proportion to anthropogenic greenhouse gas forcing; this could explain part of the lack of warming between ~1940 and ~1970. 2. There is internal (unforced) variability that originates from the climate system. El Nino years tend to be warmer than non-El nino years, for example. I don't know about the temperature relationship with the PDO (I suspect Spencer's analysis about cloud feedback is incorrect - I have looked at it and I didn't find it convincing). The AMO may contribute some multidecadal oscillation. Climate models do simulate such variability (maybe not the AMO specifically ??? - but in general, and they do reproduce at least some specific modes of internal variability, such as ENSO) - climate models, all of which produce a warming in response to a CO2 increase, also produce short term warming and cooling trends that have no correlation to CO2. CO2 has been a positive feedback in the glacial-interglacial variations. Going farther back in time, During the Phanerozoic eon (going back over 500 million years) the major 'ice-house' periods (including glaciations and also periods with less but still significant ice, such as now (Antarctica, Greenland) correspond to periods with lower CO2 (there had been some lack of correlation for the brief cold snap of the Ordivician, but newer work suggests that a sufficient drawdown in CO2 at that time could have or would have been caused by enhanced chemical weathering caused by the rise of the Appalachian mountains). I am not saying that other factors have not contributed, although sometimes they may contribute via CO2 as well as or instead of in addition to CO2.
  2. Simple illustration: Suppose there is a radiative forcing change of 4 W/m2. Warming occurs. As warming occurs, several things happen: 1. water vapor increases - a positive feedback. 2. snow and sea ice area decrease - a positive feedback. 3. Large land ice sheet area decreases - a positive feedback. 4. the chemical weathering rate increases - a negative feedback that removes CO2 from the atmosphere. Water vapor tends to approach an equilibrium with temperature over a several days. Snow and sea ice might take a bit longer (it may depend on how well they initially preserve themselves by keeping the local temperature response less than proportional to the global average response and the equilibrium proportions). But I think both of these respond faster than the temperature itself responds to the forcing (because of thermal inertia - that is, the heat capacity of the oceans). Thus, these feedbacks amplify the equilibrium temperature fully by the time equilibrium temperature is reached. Now we have, after a few decades or so, a new equilibrium climate, with a full response of the atmosphere and upper ocean (aside from any other changes yet to occur). However, there are some areas of upwelling of water from the deep ocean that will still warm up - they will warm up as the warmth spreads from the warmer upper ocean through the deep ocean, to return in upwelling regions. Also, the land ice sheets take time to fully respond to a temperature increase. Thus, there is still warming in store. It may not be at a constant rate because of the idiosyncracies of how ice sheets shrink. But eventually, some new equilibrium is reached with the ice sheets in equilibrium with the temperature and the temperature of the deep ocean in equilibrium with the upper ocean and atmosphere, etc. But during all this time, chemical weathering has increased. The increase is, however, a small rate. As CO2 is removed from the air, the chemical weathering rate will slow both because of cooling and because there is less CO2 to remove, so it is a negative feedback that results in a reduced (but not zero) warming. Because it is slow, it does not not reach any such equilibrium before the other processes have gone to equilibrium. Hence, the temperature reaches a peak from the other positive feedbacks, and then slowly declines until this negative feedback (and the positive feedbacks' reaction to it) reaches equilibrium.
  3. Snowbal Earth: What may have happened: In the Archean eon, methane had been building up in the atmosphere as a result of methanogens metabolizing the products of oxygenic photosynthesis (some methane can also be produced by oxydation of ferrous Fe as in hydrothermal activity; this could have been important in the origin of life). Oxygen reacted with ferrous Fe to produce ferric Fe - this removed Fe from the oceans (ferrous Fe is more soluble than ferric Fe), producing BIFs (banded iron formations - a present day source of iron for human industries). Oxygen could also react with some of the reduced carbon produced by life. However, methane in the atmosphere would eventually be dissociated by UV radiation. Because methane (unlike water) does not condense in the atmosphere, it mixes more easily into the upper atmosphere, and photolysis of this methane would enhance H escape to space. This ultimately left oxygen (from the photosynthesis that fed the methanogens) behind, so after enough had reacted with ferrous Fe, etc, it accumulated in the atmosphere. While CH4 was in the atmosphere, the warmth would have allowed some rate of chemical weathering to keep CO2 levels lower than otherwise. The increased oxygen in the atmosphere would cause CH4 levels to plumet. Cooling sets in, enhanced by positive snow/ice albedo feedback and water vapor feedbacks in particular. This slows the chemical weathering rate, allowing CO2 to build up from geologic emissions. But that is a slow process, and perhaps happen fast enough to prevent a complete freezer-over. A Snowball Earth But once the Earth is locked in ice with a high albedo, it takes much more CO2 to start a thaw than would have been sufficient to prevent the freeze. With the chemical weathering shut down and the oceans frozen over, geologic emissions to the air are free to build up over millions of years. Eventually, this warms the equatorial regions to just above freezing. The ice recedes. The climate is unstable when the ice line is at such low latitudes, and the ice rapidly recedes to higher latitudes, and then melts completely. With all the CO2 it took to start the thaw, the reduction of albedo now leaves the Earth in a sauna-like state. This may be the one kind of Earthly situation when chemical weathering is rapid. Although slow, there was some very weak water cycle during the Snowball, with evaporation from some ice surfaces and accumulation to produce glaciers, which, given millions of years, could cause some significant mechanical erosion. After the thaw, the high temperatures, the surface area of glacial debris, and the high CO2 level itself cause a rapid CO2 drawdown. Carbonate minerals are rapidly deposited in the ocean. The climate cools. Oxygen levels never decrease again to where they were in the Archean eon, but they are not as high as now. During the middle of the Proterozoic eon, there is enough oxygen to make the uppwer oceans oxic, but the deep oceans are still anoxic, and the effect of the oxygen on the sulfur cycle has made the deep ocean sulfidic, which reduces the solubility of a couple of key nutrients in the ocean that are involved in nitrogen fixation, perhaps slowing the evolution of life. Eventually the deep oceans become more oxic. But the oxygen levels are still not as high as in the Phanerozoic eon. Perhaps due to the breakup of the supercontinent Rodinia and the low-latitude concentration and arrangements of the continents, or maybe for some other reason?, (this might not be exactly the scenario proposed; but something like it has been suggested) methane might be produced at a greater rate. It can never become as abundant as it was in the Archean, but it can have an effect. A sudden change in the methane supply due to ecological interactions with ocean currents or... etc, could lead to a rapid reduction in methane in the air (continually lost to oxydation), and if the reduction is fast enough, cooling could set in faster than the resulting chemical weathering feedback could moderate it. Because of the continents being at low latitudes, the chemical weathering rate might be less sensitive to temperature changes. Sea ice forms and grows, and when it gets to low enough latitudes, complete freeze over is imminent. And so on... There are variations on this concept (the 'Slushball Earth', etc...). It is harder to have a Snowball Earth now because the sun has gotten gradually brighter over hundreds of millions of years. The coriolis effect also slowly weakens with time due to the tidal drag on the Earth's rotation that causes the moon to recede from the Earth. My understanding is that a larger coriolis effect (from faster rotation) would reduce the horizontal heat transports that occur for a given thermal gradient, allowing the pole-to-equator thermal gradient to be larger; this affects the sensitivity of the ice line to temperature changes. Biological evolution has important effects; I forget what but I have read that some change in biology may reduce the likelihood of a snowball Earth episode from occuring again. ------------------- A prolonged glaciation tends to reduce the chemical weathering rate, which is a negative feedback via CO2. However, lowered sea level may increase chemical weathering by exposing more land to erosion (but would carbonaceous sediment oxydize as well, increase geologic CO2 emission?). Also, glaciations cause mechanical erosion, and repeated fluctuations between glacials and interglacials may enhance the longer-term average chemical weathering rate because of the glacial debris that is left behind during warm periods. Sediment produced by mountain glacial erosion can of course be transported downhill to warmer levels where chemical weathering occurs. Land vegetation also affects erosion and chemical weathering. Geological factors can force the chemical weathering rate. The formation of mountain ranges at low latitudes in moist climates (Himalayas) will increase the chemical weathering rate (note also that geography plays a role in the precipitation rate on the Himalayas by affecting the monsoons). The erosion of some minerals is better at removing CO2 from the air than some other minerals. ------------ Ice ages: Milankovitch cycles do not involve much global annual average radiative forcing. What this orbital forcing does to a large degree is rearrange the distribution of solar heating over latitude and season. When this results in cooler summers, even if the winters are warmer (more snow?) but not too warm, then winter snow accumulation can linger longer into the summer. This has a regional and global albedo feedback, and when the snow doesn't completely melt in the summer, multiannual accumulations can form glaciers and ice sheets. The albedo feedback causes global cooling and can allow ice sheets to spread or grow more. Slowly, vegetation shifts, causing an additional positive albedo feedback. This may actually release CO2 into the air. Cooling of the oceans allows the oceans to hold more CO2 for a given atmospheric concentration, but this cannot draw the atmospheric concentration down so much. DEPENDING ON continental arrangments, ocean current configurations, etc, the change in climate may cause some combination of changes in ocean currents and changes in marine photosynthesis that cause the CO2 level to build up in the deep ocean. This doesn't necessarily involve any organic carbon burial in sediments (generally a slow process - part of the geologic portion of the carbon cycle), but could involve sinking organic matter from biologically productive regions of the upper ocean that oxydizes in the deep ocean. This adds CO2 to the deep ocean and takes it out of the upper ocean, which takes CO2 out of the air. When deep water upwells, that CO2 can be returned to the surface water and air. But if ocean circulation is reconfigured or if biological productivity is redistributed or increased (such as from fertilization from wind-blown dust due to climate change), a greater amount of CO2 can be stored in the deep ocean either by increasing the CO2 concentration or increasing the time it takes to reach upwelling areas from where it is added. There could be other possible mechanisms I haven't mentioned... So CO2 decreases as a result of cooling, and this also amplifies the cooling...
  4. The climate response to orbital forcings is a bit more complex than forcings like solar brightenning or externally-imposed CO2 forcing. If the climate is not cool enough, ice sheets will not form at all and there might not be any global average cooling. There are other things I could say about it but I have to take a break from this. Except one other important point: When discussin climate sensitivity to radiative forcing by CO2 and CH4, feedbacks that work through CO2 and CH4, important though they may be, are not actually counted toward the climate sensitivity to the CO2 and CH4 forcing - they add to the forcing. Climate sensitivity thus depends on context. Generally, feedbacks that are slower-acting than a change being considered may be treated as forcings. Radiative feedbacks can be described by their radiative 'forcing', but that is not to imply that they are not feedbacks. The total greenhouse effect may be a radiative forcing of about 155 W/m2 - but that includes water vapor and cloud LW effects. If only CO2 were removed, much of the water vapor forcing would also be revoved as a feedback.
  5. Dan Pangburn - re: Your Post #384 Thanks for the link to the video at http://www.climate-skeptic.com/ Here are some more links that really describe a positive feed-back loop. The Greenhouse Effect "Absorption of longwave radiation by the atmosphere causes additional heat energy to be added to the Earth's atmospheric system. The now warmer atmospheric greenhouse gas molecules begin radiating longwave energy in all directions. Over 90% of this emission of longwave energy is directed back to the Earth's surface where it once again is absorbed by the surface. The heating of the ground by the longwave radiation causes the ground surface to once again radiate, repeating the cycle described above, again and again, until no more longwave is available for absorption." http://www.physicalgeography.net/fundamentals/7h.html ---- Tutorial on the Greenhouse Effect- University of Arizona "In this case, the Earth still gains 240 Watts/meter2 from the sun. It still loses 240 Watts/meter2 to space. However, because the atmosphere is opaque to infrared light, the surface cannot radiate directly to space as it can on a planet without greenhouse gases. Instead, this radiation to space comes from the atmosphere. However, atmospheres radiate both up and down (just like a fire radiates heat in all directions). So although the atmosphere radiates 240 Watts/meter2 to space, it also radiates 240 Watts/meter2 toward the ground! Therefore, the surface receives more energy than it would without an atmosphere: it gets 240 Watts/meter2 from sunlight and it gets another 240 Watts/meter2 from the atmosphere -- for a total of 480 Watts/meter2 in this simple model." http://www.lpl.arizona.edu/~showman/greenhouse.html ----- Somehow, they must have missed the fact that the Sun is the only energy source and what they describe is really a perpetual motion machine in a positive feed-back loop.
  6. Dan Pangburn - Here is a funny cartoon that illustrates the positive feedback in the Greenhouse Effect physics. (it shows a reflective mirror and CO2 is not reflective, but it does demonstrate the absurdity of the positive feedback used in some of the Greenhouse Effect literature) Global Warming Physics Explained http://www.ilovemycarbondioxide.com/ipcc_oven.html
  7. Chris 390: There is no muddling. Milankovitch cycles are far too long to significantly influence the trends. Trends remote from the glacial/interglacial and interglacial/glacial transitions are intentionally considered to avoid the issue. Chris 392: The insight that the Climate Science Community is lacking which is readily obtained using Control Theory is that atmospheric carbon dioxide has no significant influence on average global temperature. The consequences of failure to determine this is that a whole lot of people have been misled and freedom and prosperity are at risk. A lot of resources that could be spent usefully are being spent to investigate a non-problem. The use of Control Theory in assessment of whether the feedback from average global temperature is significant and positive is quite different (simpler) than the usual control problem which is to design a controller to accomplish some desired result. Engineers familiar with Control Theory quickly understand it. I have also observed that the use of the concept of “feedback” as successfully used in Control Theory when applied by engineers in designing real systems differs somewhat from the concept of “feedback” as applied in atmospheric physics and other elements of climate-related science. They are similar in that the response influences the stimulus. Engineering systems often have a feedback of one or more. What happens to the function 1/(1-F) as used in climate science when the feedback, F, equals 1? At low values of feedback there is no significant difference between the function used by climate scientists and the function used in engineering which is 1+F. The idea that climate scientists appear to have which is that there are different feedbacks and they can have different response times is bogus. Patrick 395, 396 Control Theory analysis shows that added atmospheric carbon dioxide has no significant influence on average global temperature. It does not get mired in the minutia of climate details because all factors are lumped together in ‘all of the factors that influence average global temperature’. All statements and assumptions that added atmospheric carbon dioxide has a significant influence on average global temperature lack substantiation. Referring to the multi million year long Ordovician ice age as a “cold snap” is strange.
  8. Regarding approximating a log function as a linear function over a short period of time. This is true, however, the long term cycles for CO2 and Temperature that the Vostok Ice core data shows (over about 400 Thousand Years)is also very strong evidence that the relationship between Temp and CO2 is linear. Ex. An audio amplifier is considered to be a "linear amplifier" if the output follows the input signal linearly. The amplifier may have a "Gain" and a "feedback loop" (or multiple feedback loops) but the transfer function relating the output and input has to be linear. This is part of Feedback and Control Theory and Practice used in Electrical Engineering. In fact, this is a common method used in Electrical Engineering lab exercises. You are given a "black box" with some circuitry inside which is unknown to the student. By applying an input signal and viewing the output, you can fundamentally describe the circuitry in the "black box". If one applies enough input signals and analyses the output signals with respect to "rise times", "amplification or loss", "linearity and distortion" etc. you would be surprised how accurately one can determine the contents of the "black box"! This practice is commonly called "Reverse Engineering", a term most people probably have heard of before. Linearity over multiple cycles combined with shorter term measurements that confirm linearity is very strong evidence that the relationship between Temp and CO2 is linear.
  9. re #401 Dan, there is a muddle in your posts. And you're not reading my post correctly. I specifically stated that:
    "it's not just the glacial-interglacial transitions that are dominated by Milankovitch cyclesbut also the sub-transitions occurring largely within the glacial period which is what I suspect you're talking about (it would help if you were a little more specific!)."
    Why not be specific and highlight some specific periods. Which specific trends are you talking about? The reason that we know that it's not just the major glacial-interglacial transitions that are dominated by Milankovitch cycles, but also much of the slow transitions within (largely) the glacial periods, is because the ice core data has retained a faithful record of these. It's well established that the earthh's orbital parameters have three major cycles that have periods near 100,000 years (eccentricity), ~41,000 years (obliquity) and ~23,000 years (precession). Since these cycles are out of phase a rather complex insolation pattern accrues from the "summation" of the cycles which matches the ice core data quite well. As shown in a recent study, the ice core proxy temperature and 18-O signals in the cores can be Fourier transformed to pull out the dominant freequency components. The power spectrum shows clear strong peaks at 111,000, 41,000 and 23,000 years. In other words the temperatures are varying as a strong function of the intermixed contributions of the various Milankovitch cycles. So clearly the Milankovitch cycles are clearly not "far too long to influence trends". In fact the dominate the trends in the entire record. In these circumstances CO2 levels and their resultng feedbacks are a secondary consequence on the slowly varying insolation patterns driven by the earth's orbital properties. That in itself says very little about the magnitiude of the feedbacks which requires a rather more careful analysis. Kawamura et al (2007) "Northern hemisphere forcing of climate cycles in Antarctica over the past 360,000 years" Nature 448, 912-919. Your comments about Control Theory are just unsupported assertions. That's more "mantra" than science! A very obvious problem with your misapplication of control theory concepts to atmospheric physics is in your suggestion that engineering-style feedbacks and feedbacks in the climate system are similar in that "the response influences the stimulus" . But that's not quite right. When solar warming or changing insolation patterns during ice age cycles produece a water vapour and CO2 and albedo warming feedback, these "responses" don't "influence the stimulus". Clearly enhanced atmospheric water vapour and enhanced CO2 doesn't "influence" the sun nor the Earth's orbital properties. So there's something fundamentally wrong with your application of engineering concepts to the climate system in that respect. Of course there are engineering-style elements of feedbacks in the climate system. Enhanced CO2 results in a water vapour feedback that both enhances the warming resulting in enhanced water vapour and (very slightly) further enhanced CO2. There's nothing difficult to understand about that. Again we can observe this in the real world. As atmospheric CO2 levels rise so the atmopssphere warms and atmospheric water vapour levels rise. Following major eruptions the atmosphere undergos a transient aerosol-mediated cooling and water vapour levels drop amplifying the cooling. These are all well-characterized observations in the real world [***]. One can't argue away reality by assertion! [***]Santer BD et al. (2007) Identification of human-induced changes in atmospheric moisture content. Proc. Natl. Acad. Sci. USA 104, 15248-15253 Soden BJ, et al (2005) The radiative signature of upper tropospheric moistening Science 310, 841-844. Dessler, A.E., Z. Zhang, and P. Yang, The water-vapor climate feedback inferred from climate fluctuations, 2003-2008, Geophys. Res. Lett., 35, L20704 ...and so on...
  10. "Referring to the multi million year long Ordovician ice age as a “cold snap” is strange. " It was a snap compared to the later Paleozoic cold period and the recent Cenozoic cold period (that we are still in). That's all I meant by 'snap' in that context. As to how intense it was, I'm not sure.
  11. "very strong evidence that the relationship between Temp and CO2 is linear." Well, maybe the relationship between temperature and radiative forcing from CO2 is nonlinear, then. Which does not necessarily imply the same for temperature response to CO2 as an external forcing, because the climate response to orbital forcing is complex. "If one applies enough input signals and analyses the output signals with respect to "rise times", "amplification or loss", "linearity and distortion" etc. you would be surprised how accurately one can determine the contents of the "black box"!" ... "This practice is commonly called "Reverse Engineering", a term most people probably have heard of before." So control theory in the context of climatology is called 'paleoclimatology' and 'observations', plus analysis. Okay. We have people who do that. Why do we need to call it by a different name. And why must we ignore what we know about the physics of the contents of the black box from other fields/kinds of research? Dan - It might be easier for me to understand your logic if you describe what you'd expect to see from your black box if there are positive feedbacks. "The idea that climate scientists appear to have which is that there are different feedbacks and they can have different response times is bogus." The known physics suggests otherwise. (If we have the ability to open up the black box and peek inside, why should we not allow ourselves that benifit?) A more tangible analogy: I have a mass that is supplied with heat by a heat source and is cooled by a heat sink. The mass has two rods attached to it, with sensors at the end that adjust the heat source in response to measured temperature. One is short and thick, made of aluminum, and the sensor at the end sends a signal to increase the heat source in response to an increase in temperature. One is long and thin, made of rubber, and it's sensor sends a signal to decrease the heat source in response to an increase in temperature. There is also a third sensor embedded in the mass that sends a signal to increase the heat source in response to an increase in temperature. The mass has a heat capacity C. What happens if you reduce the heat sink?
  12. (from chris: "Clearly enhanced atmospheric water vapour and enhanced CO2 doesn't "influence" the sun nor the Earth's orbital properties. So there's something fundamentally wrong with your application of engineering concepts to the climate system in that respect." ) That is a very important point. In my 'tangible analogy', one could have the sensors sending signals to control secondary heat sources or heat sinks seperate from those controlled 'manually'. Of course, in the climate system, some devices (CO2, CH4, etc.) have multiple knobs and inputs...
  13. Actually, in my tangible analogy, it doesn't matter how thick the rods are if they are of constant thickness along their whole lengths.
  14. Dan, about Gord's comment 398: 1. http://www.ilovemycarbondioxide.com/ipcc_oven.html That's one of the most idiotic things I've ever seen. Gord and I both agree that the chicken will not heat itself up. But Gord insists (by analogy from his actual comments) that this implies that the mirror cannot reflect photons back to the chicken. If a chicken is placed inside a mirrored container (mirrored at the relevant wavelengths), it will not increase in temperature because of the photons that return to the chicken after leaving it. But, if a warm chicken is placed inside a mirrored container, or if it is wrapped in aluminum foil, the reflection of photons back to the chicken will keep the chicken from cooling off (Setting aside convection and conduction). Even if the chicken is not completely covered, it will cool at a slower rate than if it were left completely exposed to a cooler environment (it loses heat to a cooler environment because (setting aside convection and conduction) there is less radiant flux per unit area reaching the chicken from the cooler environment than there is leaving the chicken to the cooler environment; it is a net energy flow). If heat is being supplied to the chicken at some wavelength that can pass through the mirrors or foil, the chicken will reach an equilibrium temperature when the rate at which it radiates heat to the cooler environment equals the rate at which heat is supplied; if the chicken is less exposed to the cooler environment, it needs to get to a higher temperature in order to get the same heat energy per unit time radiated out into the cooler environment. What if the foil is replaced by a sheet of carbon that absorbs radiation from the chicken? If the chicken recieves heat by some form of energy that can pass through the carbon, then - assuming the sheet of carbon completely covers the chicken and is perfectly opaque (and is tight around the chicken - so it's surface area exposed to the cooler environment is approximately the same as the surface area of the chicken)- it must lose heat to the carbon at the same rate if in equilibrium. But in equilibrium, the carbon must also lose heat at the same rate to the cooler environment. The equilibrium temperature of the carbon sheet will be the same (or approximately so) as the temperature of the chicken when the chicken is completely exposed. The chicken must be at an even higher temperature in order to lose heat to the carbon sheet. If the carbon sheet does not completely cover the chicken, the chicken's equilibrium temperature will drop the more it is exposed. If additional layers of carbon sheet are added, each raises the equilibrium temperature of all layers inside. This works both for radiation and for convection and conduction - additional sheets do not do much more to stop convection but they increase the distance through which heat must conduct to reach the outermost surface, and the rate of heat conduction per unit area is proportional to the temperature variation per unit distance. This is how winter coats work - they slow the loss of heat by conduction, convection, and radiation, from your skin to the environment, for a given temperature difference between your skin and the environment; thus, if your skin is heated at the same rate by your metabolism, it will rise to a higher temperature before it loses heat at the same rate to the environment when that heat must get through your coat. ------ Gord also mentions feedbacks purely between radiant fluxes and temperature. These do exist, but are not generally considered as 'climate feedbacks' - they are included in the the 'zero feedback climate response'. What are considered as feedbacks to the zero feedback climate response include changes in the tropospheric lapse rate**, and changes in composition and phase - humidity and clouds, dust, etc, snow and ice and anything else affecting the albedo of the surface, etc, and their arrangement relative to solar radiation and temperature distribution. The zero feedback climate response is understood to be the temperature response (including how it reacts to itself by changes in radiation with emissivity and absorptivity, scattering and reflectivity held constant****) with the arrangment of humidity, clouds, and the tropospheric lapse rate** in space and time (annual and daily cycles, internal variability) artificially and unrealistically held constant. **** at least in so far as optical properties are a function of composition and physical phase. Optical properties also vary due to temperature itself, but the change in optical properties due to a moderate-size temperature change are small compared to the variation over height...
  15. Dan - you shoud also know that Gord thinks (as is infered from the way he uses the term 'perpetual motion machine') that any object that is warmer than 0 K (absolute zero) must be a perpetual motion machine because of the constant activity on the molecular scale. Well, to be serious, he just doesn't seem to believe that there is such activity on a molecular scale. Or maybe he does and just refuses to be logical about the consequences. By his logic, you would burn yourself if you ever walked by a functioning mirror, and thus, functioning mirrors are physically impossible.
  16. Other quick points about ice ages: The ~ 100,000 year cycle is the eccentricity cycle. It modulates the effect of the precession cycle (if/when the eccentricity is near zero, the precession cycle has little effect). The 100,000 year cycle actually varies over a longer period of time. The ~ 40,000 year cycle is the obliquity cycle, in which the tilt of the Earth's axis relative to the normal of the orbital plane varies a few degrees. Higher obliquity increases the amplitude of the seasonal cycle, and in the annual average, redistributes incident solar radiation from the tropics polar regions. The obliquity cycle has a greater effect at high latitudes than at lower latitudes (the increase or decrease in insolation at low latitudes is smaller than the compensatory opposite change at higher latitudes because the area at high latitudes with the opposite change is smaller than that at low latitudes (as I recall**); also the seasonal cycle caused by obliquity is much larger at higher latitudes). The ~ 20,000 year cycle is the precession cycle. It is actually the result of a somewhat longer cycle in the orientation of the tilt of the Earth combined with a longer period cycle in the orientation of the semimajor axis of the Earth's orbit. In the precession cycle, the Earth's axis wobbles about the normal of the Earth's orbit, so that the timing of the seasons shift around relative to the timing of perihelion and aphelion. The precession cycle has opposite effects in each hemisphere. Currently, perihelion occurs in Northern hemisphere winter (near the solstice) and Southern hemisphere summer, making the seasonal cycle larger in the Southern hemisphere and smaller in the Northern hemisphere. It also increases the annual average insolation in the Southern middle and high latitudes and reduces it in the Northern middle and high latitudes, because the increase in solar insolation at perihelion relative to aphelion is in proportion to the solar insolation recieved at the time of year at the latitude considered, so the increase in insolation at perihelion is closer to the winter solstice cannot fully make up for the decrease at aphelion when aphelion is closer to the summer solstice. The precession cycle could have a global average effect even if the Earth were symmetrical across the equator with differences between perihelion and aphelion alignments with the solstices verses alignments with the equinoxes. However, the Earth is not symmetical - in land distribution and topography, oceans and their currents, etc, so there can be a global average difference between when the perihelion occurs near the Northern hemisphere winter soltice verse the Southern hemisphere winter solstice. Note that the major ice sheet changes between glacials and interglacials of the Pleistocene have occured in the Northern Hemisphere; that aside, this also playes a role in the vegetation and seasonal snow feedbacks. Not that the Southern hemisphere doesn't have sea ice. Of course, the dominance of water at Southern midlatitudes means that even when orbital forcing tends to increase the seasons' amplitudes there, the seasonal variations might still be small... --------- Effects: The effects depend on the arrangments of continents and oceans, etc, the general climate state and other forcings, and the biological species present. Even when there are not glacial-interglacial variations, the precession cycle continues to have an effect on low-latitude monsoons (this is why the Saraha desert was significantly wetter several thousand years ago). There are thresholds involved... the forcing must at least reach some level to have some effect (such as producing lakes in the Sahara), and that may not happen each time the cycle repeats because of the eccentricity cycle. Ice sheets and glaciers can only form as fast as snow accumulates, but can melt and disintegrate faster. As solar insolation is redistributed over space and time, it is possible the global albedo may vary - for example, higher obliquity and winter perihelion may direct more sunlight onto snow and ice, reducing the total solar energy absorbed. Conceivably, sometimes the same pattern that would favor warming by deglaciation might actually cause some initial global cooling (?). When ice sheets form and grow, they thicken, and the surface elevation increases. Over time, isostatic adjustment occurs, but the ice surface elevation is still higher than the initial land surface elevation. This elevation causes the surface to be colder than it otherwise would be. Thus, in addition to the regional effect of albedo, it may be necessary to go beyond the threshold of forcing that allowed glaciation to start in order to actually cause deglaciation - however, melting and evaporation around the edges of an ice sheet will cause greater flow out of the higher middle and thin the middle that way. Also, if/when ice sheet loss is faster than isostatic rebound, the surface elevation will get lower than otherwise for the same thinning of the ice sheet. It may be the case that the first several Northern hemisphere glaciations of the last millions of years produced ice sheets that flowed faster for a given elevation gradient due to lubrication underneath from soil and loose rock/sediment. This faster flow would make the ice sheets thinner. Eventually this lubrication would be lost as successive glaciations scoured away the loose material. Thus later ice sheets could have grown thicker. It has been suggested that this is why, around 900,000 or 700,000 years ago (which one?), the dominant period in glacial-interglacial variations shifted to the longer 100,000 year cycle. Whether or not that is why, it is possible that the 100,000 year eccentricity cycle can dominate if conditions occur such that only 1 in 5 peaks or so in the precession cycle are able to pass the threshold that causes large deglaciation, as opposed to most or all.
  17. In the middle ages, various officials, bureaucrats etc could not accept the idea that the earth is relegated to sub-ordinance to the sun (ie the earth revolves around the sun, rather than the other way around), because it conflicted with everything they learnt in bringing order and direction to the world, and from a well-defined social hierarchy. Modellers, and those in government agencies today, I would argue also don’t like attributing the sun to climate change partly because it conflicts with their need to bring order to a disordered world, and makes them, and all of what they have learned and can influence, irrelevant. It relegates human influence (or human-induced global warming) irrelevant. I would contend that the same psychological processes regarding resistance to the sun’s influence is going on today, because officials, and governments, essentially don’t change psychologically. But the sun will eventually win the climate debate, just as it did in the middle ages, because eventually the data will become unequivocal.
  18. thingadonta - There are reasons why people believe things that are not true, but the fact that it's possible to imagine a reason why people believe something does not make everything that people believe not true. To hold that changes in the sun are the dominant factor in the last several decades of climate change requires a leap of faith.
  19. With regards to your comment, I would say it is a leap of faith to argue that human affairs and a trace gas is driving global warming to catastrophic global climate change, when human and geological history shows otherwise. More on human history and the sun: In contrast to Europe's middle ages, many ancient societies had the sun at the centre of their 'social affairs' (eg Egypt, Aztec etc), for reasons that are quite simple- changes in seasons, droughts, floods, seasonal crop yields etc etc were all directly related by whether or not the great ball in the sky was being favourable to their particular needs. If there was too much sun there would be drought, too little there would be flood etc, or so the thinking went. The sun was pretty much responsible for their longer term welfare. This largely explains sun worship that developed in many ancient cultures. A different kind of society developed in parts of the Middle East, Europe, and some other places, where the sun was relegated to a far more subordinate role. Human affairs would be controlled largely by bureaucrats, officials, and the existing social order, not the pie in the sky. Particularly in areas where the seasons and climate didn’t fluctuate a great deal, the role of the sun, naturally, was relegated. One of these areas was Europe, where the seasons are predictable and aspects of climate like rainfall is fairly uniform over the years, and where bureaucrats, and their influence, therefore got the better of things. Humans and human influences would control social affairs, not something as irrelevant as the sun. And one could argue that this is a natural development over the centuries in a continent where climate doesn’t vary much, but human needs and social affairs certainly do. And by no means would the sun be at the centre of things- humans and the existing social order- would be at the centre of social affairs. And so there was strong resistance to the idea that the earth revolved around the sun and that it, and human affairs, was subordinate to it, in much the same way that today there is resistance to the idea that the sun drives climate change and associated politics and ‘social affairs’. It is simply not in the traditional bureaucratic psyche of the western world to be favourable to the idea that the sun controls ‘human affairs’, and that bureaucrats and their influence, is irrelevant.
  20. Chris 403 I am sorry that you have trouble understanding my posts. I often make the mistake of assuming that others have my insight. Here are a few trends obtained ‘by eyeball’ off graphs of CDIAC-ORNL data. The numbers are all in ybp Downtrend 57,000 to 54,600 Uptrend 54,600 to 50,300 Downtrend 50,300 to 45,200 Uptrend 45,200 to 42,000 Downtrend 42,000 to 36,500 The shortest Milankovitch is about 23,000 years so there can be no significant coupling. If you are familiar with the concept of impedance mismatch you will understand this immediately. It is obvious that you have little knowledge of Control Theory. In Control Theory, feedback is a dimensionless number that is defined as the influence that the response has on the input to the control/plant (my use of the word stimulus was apparently misleading). As used in climate science, feedback usually has units that can not be normalized by being divided by energy input. Thus these climate science feedback values are not directly applicable in Control Theory. Sometimes in climate science, feedback is defined in a way indicating that it is unitless such as described at http://climatesci.org/2008/04/08/has-the-ipcc-inflated-the-feedback-factor-a-guest-weblog-by-christopher-monckton/. One reference which gives their definitions for use in both climate science and Control Theory is at http://www.answers.com/topic/feedback . To avoid ambiguity, I will use CT feedback when referring to it as always used in Control Theory as first described by Bode in 1945. However, the difference in meaning of feedback as used in climate science and CT feedback as used in Control Theory is not relevant to determining the sign of CT feedback. The trends, like the five listed above, prove that CT feedback was not then and can not now be significantly positive. When the IPCC says that the max temperature increase with doubling carbon dioxide level is 1.2 °C if there is no feedback, it doesn’t matter what definition of feedback they are using. (Remember that I think that this increase is too high and that most of it has already occurred). Your failure to recognize that the sign of CT feedback in earth’s climate can be determined using Control Theory (and paleo temperature data) is understandable considering your lack of understanding of Control Theory. It is easy to understand the concept of enhanced GW. But the observations are that GW does not get enhanced. Some have proposed that clouds change to cancel it. Control Theory with paleo temperature data proves that GW does not get enhanced.
  21. Patrick 412 For a possible explanation (which excludes a significant contribution from CO2 increase) of much of the temp rise during the 20th century see 371 (A recheck of the graph shows the start of the GSM runup to be closer to 1930 with a small rise to 1945). I am aware that TSI itself is not enough but global temps are very sensitive to cloud cover and clouds are sensitive to sunspots (Google cloud sunspot)so sunspot activity acting as a catalyst on clouds could well be the cause of most of the observed 20th century temperature rise. The Grand Solar Maximum combined with the PDO uptrend to produce the rapid rise starting about 1976. Since about 2002 PDO is in a downtrend and the sun hasn't been this quiet this long since 1913 ftp://ftp.ngdc.noaa.gov/STP/SOLAR_DATA/SUNSPOT_NUMBERS/MONTHLY.PLT so it looks like the GSM has ended. The good news is that the huge thermal capacitance of the oceans will calm whatever happens.
  22. Dan - It doesn't seem like Control theory has anything additional to add to climate science since climate scientists are fully aware of feedback loops and how they work. Of course there are different ways to measure a feedback; as long as the variables are defined, that is not a problem. ( Example: Say a radiative forcing R of 1 W/m2 results in an equilibrium change of 0.3 deg C temperature change T0 without feedbacks. R/T0 = 3.3 W/(m2 K) Now suppose water vapor adds a radiative feeback F1 = 0.5 W/m2 per 0.3 deg C, or F1 = 1/2 * R/T0; then let f1 = F1/(R/T0), so f1 = 1/2. Then the equilibrium change T for a given R is given implicitly by: (T*F1 + R)/T = R/T0 [F1/(R/T0)] * T * (R/T0) + R = T * (R/T0) f1 * T * (R/T0) + R = T * (R/T0) R/T = (R/T0) * [ 1 - f1 ] T/T0 = 1/(1 - f1) So for f1 = 1/2, T/T0 = 2. ) The feedback might also be described by f2 = T/T0. The two descriptions of feedbacks: f1, f2 (with rounding) 0.1, 1.11 0.2, 1.25 0.33, 1.5 0.5, 2 0.67, 3 0.75, 4 0.8, 5 0.9, 10 0.95, 20 0.99, 100 1, infinity or undefined. And you could also use f3 = f2-1.
  23. Re #414 O.K. Dan. Now we know what you’re looking at we can address your confusion. A very good data source for understanding what is happening in the Antarctic during these periods is the output of the new high resolution analysis of the European Project in Ice Coring in Antarctica (EPICA) Dome C core. This data resolve temporal relationships between temperature and greenhouse gas forcings (CO2 and methane) in the Antarctic and Greenland, and their relationships with latitude-dependent orbital forcings resulting from slowly varying oscillations of the orbital (Milankovitch) cycles. This is published here (I expect you can find the archived data by Googling): Jouzel, J. et al (2007) Orbital and Millennial Antarctic Climate Variability over the Past 800,000 Years Science 317, 793-796. Let’s focus on the glacial period preceding the most recent transition to the current (Holocene) interglacial (around 115,000 to 18,000 BP). This encompasses the time periods that you are exercised over. Here’s what the data show: 1. Outwith the major glacial/interglacial transitions (the intensity of which seems to be a function of the interplay between the obliquity and precession elements of the Earth’s orbital variation – Milankovitch cycles), the Earth’s orbital properties drive periodic “sub-transitions” within the glacial periods associated with small temperature rise and falls over periods of many thousands of years. 2. These are most closely linked with the obliquity component of the Milankovitch cycles. So the last interglacial period pretty much “sits” on top of the rising (warming) part of the obliquity period, and temperatures at the end of the interglacial fall with the falling (cooling) part of the period. The period between around 110,000 and 70,000 BP which saw temperatures rise a bit (by 2-3 oC in the cores, corresponding to 1.5-2 oC gobally) and then fall, associates with the warming and cooling phase of the next obliquity cycle. The last but one obliquity cycle gave rise to the broad warming/cooling sub-transition 65,000-25,000 years ago. Again the global temperature variations were very small (1.5-2 oC globally). This is the period that contains the transitions you are considering. Let’s look more closely: 3. Note that these transitions are very slow and involve very small changes in radiative forcing (around 1 W/m^2 max to min, from the obliquity component itself, but applied over several millenia), and result in very small changes in atmospheric CO2 (20-30 ppm rises taking many hundreds of years) as a feedback. 4. We can calculate the radiative forcing resulting from the changes in very small changes in greenhouse gas levels (Jouzel et al cited above very conveniently do this for us! – see their Figure 3). These are of the order of 0.5 W/m^2. Even at equilibrium, these are expected to give only around 0.4 oC contribution to the small warming during the rising periods of these events, including all the feedbacks associated with an approx 3 oC of warming per doubling of atmospheric CO2 [note that the enhanced radiative forcing arising from raised CO2 during the full glacial to interglacial transition is around 2-2.5 W/m^2 – see Jouzel 2007 Figure 3]. 5. So that explains the general slow rise and fall in temperature over the period that you are considering. These are driven by the obliquity component of the Milankovitch cycles, are associated with very small changes in atmospheric CO2 (around 10 years worth at current rates of anthropogenic release but rising then aroubd 50-100 times more slowly!) with associated small contributions to radiative forcing. 6. Within these temperature sub transitions there are “sub-sub-transitions” with even smaller temperature variations. These are what you are considering. These seem to occur independently of Milankovitch cycles. Analysis of temporal relationships with events in Greenland cores indicates that these match temporally with the Dansgaard-Oeschger (DO) events that are prominent in Greenland cores. 7. DO events are not completely characterized but most likely arise from ice sheet dynamics in the Arctic in which glacial expansion and discharge with massive periodic release of meltwater in the high latitudes temporarily shut off the Atlantic conveyer that draws heat from the mid latitudes to the high Northern regions. In time (centennial timescale most likely) the heat transfer resumes, and the high Arctic regions warm suddenly again. These events are “sensed” in the Antarctic cores but are significantly “damped” with respect to the rather abrupt changes observed in Greenland cores. The Antarctic warms a tad and cools a tad in phase (with a lag) relative to the DO events in Greenland. 8. So these phenomena are starting to be reasonably well understood. The main events, and sub-transitions are driven by Milankovitch cycles, with greenhouse gas feedbacks contributing amplification (warming in the warming phase of the cycles equivalent to around 3 oC of warming per doubling of atmospheric CO2 - perhaps more). The transitions within the sub-transitions are seemingly damped responses to DO events in Greenland that likely lead to very considerable and temporary changes in the ocean currents that carry heat from the low to high latitudes.
  24. Some people just don't get it! The Greenhouse Effect "Absorption of longwave radiation by the atmosphere causes additional heat energy to be added to the Earth's atmospheric system. The now warmer atmospheric greenhouse gas molecules begin radiating longwave energy in all directions. Over 90% of this emission of longwave energy is directed back to the Earth's surface where it once again is absorbed by the surface. The heating of the ground by the longwave radiation causes the ground surface to once again radiate, repeating the cycle described above, again and again, until no more longwave is available for absorption." http://www.physicalgeography.net/fundamentals/7h.html ---- This link is a perfect example of a "positive feedback" loop: 1)The Earth has a starting temperature, TE. 2)The absorbtion of the longwave radiation radiation (provided by the Earth) heats the atmosphere to temperature TA. 3)The heated atmosphere transfers 90% of it's energy back to the Earth, where it is absorbed causing the Earth to heat up even more. The Earth is now warmer than it was in (1) and TE has INCREASED. 4)The now warmer Earth radiates even more energy to the atmosphere where it is absorbed and causes the atmosphere to heat up even more. The atmosphere is now warmer than it was in (2) and TA has increased. 5)The now further heated atmosphere transfers 90% of it's increased energy back to the Earth, where it is absorbed causing the Earth to heat up even more than it was in (3). 6)The now further heated Earth radiates even more energy to the atmosphere where it is absorbed and causes the atmosphere to heat up even more. The atmosphere is now warmer than it was in (4) and TA has increased. The cycle continues over and over again, with each cycle producing more heating of the Earth and the Atmosphere. The link states that "...repeating the cycle described above, again and again, until no more longwave is available for absorption." which is wrong because it will never happen. Since each heating cycle produces more longwave radiative heat energy, the ultimate outcome is an infinite temperature increase of both the Earth and the Atmosphere. What starting temperature TE, is required to start these constantly increasing temperature cycles? Answer: TE must be greater than "absolute zero"....that is the ONLY requirement! It DOES NOT REQUIRE ANY ADDITIONAL ENERGY! ------------------ Global Warming Physics Explained Free Energy Oven "Interior has a mirror finish which reflects black body radiated heat back to the chicken, increasing its temperature. Warmer chicken will then re-radiate more infrared energy to the reflecting surfaces with additional heating occurring in a rapid cascade effect. Chicken must be above absolute zero when initially started. (Warning: observe temperature rise carefully and remove when internal temperature reaches 185 degrees). No power required. UN IPCC approved. Chicken not included." http://www.ilovemycarbondioxide.com/ipcc_oven.html -------- The only difference between "The Greenhouse Effect" link process and the "Free Energy Oven" link process is the 90% back radiation vs the 100% reflectivity of the "oven". Both descriptions produce "free energy" (created energy) and both are "positive feedback" systems. Both are perpetual motion machines in a positive feed-back loop. Both are great comedy.
  25. Gord - I went to http://www.physicalgeography.net/fundamentals/7h.html I skimmed part of it. 1. "Increasing the Earth's temperature would cause the oceans to evaporate greater amounts of water, causing the atmosphere to become cloudier. " That's not necessarily true; more water vapor does not automatically lead to more clouds if the temperature increases. Furthermore, clouds also contribute to the greenhouse effect. Whether adding or removing some cloud causes warming or cooling depends on various factors, including height, latitude, and time of year and time of day. But I'm not going to scour this website for other errors; back to your point: "The heating of the ground by the longwave radiation causes the ground surface to once again radiate, " Yes, that is inaccurate. I agree. And sorry for not noticing the slip up earlier. (I had somewhere previously identified the other error which was that 90% of the atmospheric radiation to the surface and space is to the surface, which is incorrect as far as I know - it is more than half but not quite so close to 1.) But let's go over what is actually inaccurate about it. It's a clumsy explanation. It is also incomplete because it leaves out the role of convection, and thus may give people the impression that convection is not taken into account; it is - see my previous comments (as in the answer to: why is tropopause level forcing so important?). (You will find that explanations of the greenhouse effect meant for lay audiences are often quite clumsy. Maybe I don't always see how confusing it might sound because, knowing the mechanism as well as I do, I can see what they're trying to say. Climate scientists have a much better understanding than what one would get from websites such as the one you quoted above.) The description they use seems to be for a cold starting point, or at a time when the greenhouse effect is 'turned on'. The sun has heated the Earth and the Earth's surface temperature has risen to reach an equilibrium where it radiates to space at the same rate it is heated by the sun. Now add the greenhouse effect (or add to it). Less heat escapes to space because the colder atmosphere is blocking it. With continued heating by the sun and less heat escaping to space, heat energy is being stored somewhere, and except for phase changes, the temperature will rise. It rises until some part of the atmosphere and surface have increased in temperature enough to increase the radiation to space enough to reach equilibrium with the solar heating. But it is true that if portions of the atmosphere increase in temperature, then the downward radiation to the surface also increases. The surface temperature has to rise enough so that it's emitted radiation plus convective cooling ... ("convection" in this context is meant to include the initial conduction and evaporation and diffusion step that transfers heat from the surface material to the very thin layer of air next to it) ... to the atmosphere and space balances the downward radiation from the atmosphere absorbed by the surface; this includes the initial flux, the increase due to the greenhouse forcing change, and the increase from the temperature increase of the atmosphere. There is no reason to expect that this cannot reach an equilibrium value. Furthermore there is no creation of energy; before (other) feedbacks are considered, the solar heating rate is constant, so the increase in temperature whereever it occurs is the result of imbalances in fluxes where heat is being stored; the increase in emission due to an increase temperature restores balance once heat has been stored to raise the temperature sufficiently. It is like narrowing the width of a river channel; the water levels change until the difference in water levels is sufficient to drive a faster flow through the narrow portion, which then balances the flow so that the water levels stops changing. My description can be described in analogy with a mathematical equation that must be solved for temperature: dS(z)/dz - d[R(T(z'),O(z'),z)]/dz = G(z) + F(z) where R(z) is the net upward LW radiant flux + vertical convective heat flux (in this context, includes evaporation and diffusion of water from the surface into the air, and conduction between the surface and the air) at height z. S(z) is the net downward solar radiant flux at height z thus dR/dz = net LW cooling dS/dz = solar heating G(z) is the heat storage rate, and the time average G(z) = 0 at equilibrium F(z) is the horizontal export of heat, and in the global average, is zero for each value z. T(z) is the temperature at z O(z) is the optical properties of the atmosphere at z ---- Deriving a solution is iteratively follows the natural process of temperature response to heat flux convergence: That is, take (for simplicity of illustration, set F(z) = 0) dS(z)/dz - d[R(T(z'),O(z'),z)]/dz = G(z) And instead of solving the equation for T(z'), just use initial T(z'), and calculate G(z). dT(z')/dt = G(z')/C(z'), where C(z) is the heat capacity per unit area per unit z. For each time step dt, add dT(z') to the previous T(z'), and repeat. ---- What may be confusing about the explanation you were looking at is that, instead of finding T by iteration given the totality of S, R, etc, they instead focus on one package of energy, and look at what happens to it in the process of entering, moving through, and leaving the system, using an iterative description (as I did in comment 274 above: http://www.skepticalscience.com/argument.php?p=11&t=418&&a=18#2884 ). While the iteration is described as steps in a sequence, it must be kept in mind that the steps being described are not happening one at a time; each starts the moment the other is in process (as soon as some of the energy in a package reaches a point, some can start to leave that point). Each step taken in isolation could appear to violate the second law of thermodynamics (especially if a set of proportionalities are assigned to all the points where the energy flow splits where each proportionality is constant from one full cycle to the next), but that is not a problem because the steps can never actually happen in isolation, and a constant proportionality set applies if this is occuring in the context of an equilibrium state where other packages of energy are continually being added so all steps are occuring at a constant rate. And as each step is occuring for one package of energy, a new package of energy is delivered (from the sun), so - if in equilibrium - all the steps are occuring constantly at a fixed rate. For a given package of energy, after each cycle, some fraction has escaped to space. Thus the amount that remains in the climate system decayse exponentially - it never reaches zero but it approaches that value. When packages of energy are delivered continuously (from the sun), then the total energy in the system approaches a constant value (in this simplified description that sets aside daily and annual cycles and internal variability), where the sum of the decay of all remaining portions of all previous energy packages is balanced by the rate of delivery of new packages. This works mathematically: it is possible to reach a finite equilibrium even though none of the packages ever is perfectly 100% gone. Do the summation to prove it: package of energy delivery in time dt: S*dt decay of the remaining portion of any previously delivered package j, where Pj is the size of the remaining portion of package j: Pj * 1/tau * dt Notice that if all Pj are added to get the total energy in the system E, then the decay of E is: SUM(P1 * 1/tau * dt + P2 * 1/tau * dt + ...) = SUM(P1 + P2 + ...) * 1/tau * dt = E * 1/tau * dt Thus, the change in E over time dt is: dE = S * dt - E * 1/tau * dt In equilibrium: S*tau = E Rate of change of E dE/dt = S - E/tau What happens if S = 0? Then E decays exponentially at the same rate that the remaining portion of any individual package would decay: dE/dt = -E/tau E = A*exp(-t/tau)

Prev  6  7  8  9  10  11  12  13  14  15  16  17  18  19  20  21  22  23  24  25  Next

Post a Comment

Political, off-topic or ad hominem comments will be deleted. Comments Policy...

You need to be logged in to post a comment. Login via the left margin or if you're new, register here.

Link to this page


The Consensus Project Website

THE ESCALATOR

(free to republish)


© Copyright 2024 John Cook
Home | Translations | About Us | Privacy | Contact Us