Climate Science Glossary

Term Lookup

Enter a term in the search box to find its definition.

Settings

Use the controls in the far right panel to increase or decrease the number of terms automatically displayed (or to completely turn that feature off).

Term Lookup

Settings


All IPCC definitions taken from Climate Change 2007: The Physical Science Basis. Working Group I Contribution to the Fourth Assessment Report of the Intergovernmental Panel on Climate Change, Annex I, Glossary, pp. 941-954. Cambridge University Press.

Home Arguments Software Resources Comments The Consensus Project Translations About Support

Bluesky Facebook LinkedIn Mastodon MeWe

Twitter YouTube RSS Posts RSS Comments Email Subscribe


Climate's changed before
It's the sun
It's not bad
There is no consensus
It's cooling
Models are unreliable
Temp record is unreliable
Animals and plants can adapt
It hasn't warmed since 1998
Antarctica is gaining ice
View All Arguments...


Username
Password
New? Register here
Forgot your password?

Latest Posts

Archives

Does ocean cooling prove global warming has ended?

What the science says...

Select a level... Basic Intermediate

The most recent ocean measurements show consistent warming.

Climate Myth...

Oceans are cooling

“Ocean heat touches on the very core of the AGW hypothesis:  When all is said and done, if the climate system is not accumulating heat, the hypothesis is invalid.

[…]Now that heat accumulation has stopped (and perhaps even reversed), the tables have turned.  The same criteria used to support their hypothesis, is now being used to falsify it.” (William DiPuccio)

In 2008, climate change sceptic Roger Pielke Sr said this: “Global warming, as diagnosed by upper ocean heat content has not been occurring since 2004”. It is a fine example of denialist spin, making several extraordinary leaps:

  • that one symptom is indicative of the state of an entire malaise (e.g. not being short of breath one day means your lung cancer is cured).
  • that one can claim significance about a four year period when it’s too short to draw any kind of conclusion
  • that global warming has not been occurring on the basis of ocean temperatures alone

So much for the hype. What does the science say about the temperature of the oceans – which, after all, constitute about 70% of the Earth’s surface? The oceans store approximately 80% of all the energy in the Earth’s climate, so ocean temperatures are a key indicator for global warming.

No straight lines

Claims that the ocean has been cooling are correct. Claims that global warming has stopped are not. It is an illogical position: the climate is subject to a lot of natural variability, so the premise that changes should be ‘monotonic’ – temperatures rising in straight lines – ignores the fact that nature doesn’t work like that. This is why scientists normally discuss trends – 30 years or more – so that short term fluctuations can be seen as part of a greater pattern. (Other well-known cyclic phenomena like El Nino and La Nina play a part in these complex interactions).

Looking at the trend in ocean heat, this is what we find:
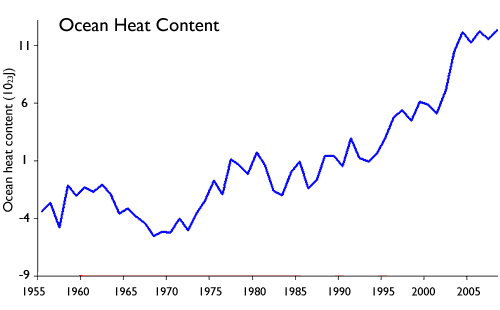
Source: Levitus 2009

There are, however, disputes about the accuracy of Argo buoys and expendable measuring devices dropped into the sea, and the reporting of temperatures down to only 700 metres. How do scientists resolve these kind of disputes – bearing in mind that such disputes are the very stuff of science, the essence of true scepticism? One way is to find more data sources – different ways of measuring the phenomenon in dispute. By using results from seven different teams of scientists, all using different tools and methods, we are able to see a clear trend. And while there is variation between team results due to the differences in technique and measurement methods, one thing they all agree on: long term, temperatures are going up.
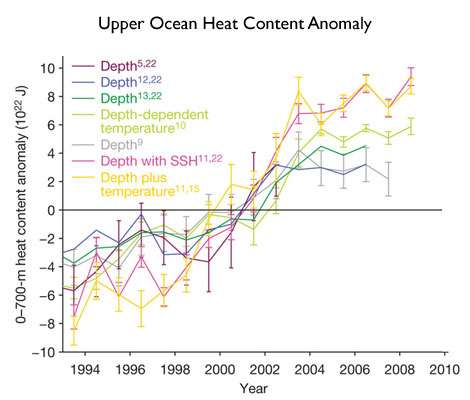
Source: Lyman 2010

The reaction of the oceans to climate change are some of the most profound across the entire environment, including disruption of the ocean food chain through chemical changes caused by CO2, the ability of the sea to absorb CO2 being limited by temperature increases, (and the potential to expel sequestered CO2 back into the atmosphere as the water gets hotter), sea-level rise due to thermal expansion, and the amount of water vapour in the atmosphere.

While there is a great deal we don’t know about how the oceans behave, we do however know that it’s safer to discuss all aspects of climate change using multiple sets of data, rather than just one, as Pielke Sr did. If ocean heat is a guide, then global warming is still on track to cause great disruption if we don’t modify our actions to reduce the release of anthropogenic CO2.

Claims that global warming is not happening on the basis of short-term ocean temperatures are not supported by the evidence.

Basic rebuttal written by GPWayne

Last updated on 1 August 2013 by gpwayne. View Archives

Printable Version  |  Offline PDF Version  |  Link to this page

Argument Feedback

Please use this form to let us know about suggested updates to this rebuttal.

Further reading

The IPCC AR4 section on Oceanic Climate Change and Sea Level (15Mb PDF) gives a good overview of ocean heat and sea level change. Interestingly, they use the ocean heat data with the erroneous 2003 cooling trend (see Figure 5.1).

Josh Willis writes a good overview of the challenges of measuring ocean temperatures in Is It Me, or Did the Oceans Cool?

Comments

1  2  3  Next

Comments 1 to 25 out of 74:

  1. "Dust Responsible for Most of Atlantic Warming", By LiveScience Staff, 26 March 2009 The results: More than two-thirds of this upward trend in recent decades can be attributed to changes in African dust storm and tropical volcano activity during that time. This was a surprisingly large amount, Evan said. The results, detailed in the March 27 issue of the journal Science, suggest that only about 30 percent of the observed Atlantic temperature increases are due to other factors, such as a warming climate. "This makes sense, because we don't really expect global warming to make the ocean [temperature] increase that fast," Evan said. http://www.livescience.com/environment/090326-dust-ocean-warming.html
  2. Lyman et al. 2006 and Gouretski and Koltermann 2007 both illustrate that the oceans have been cooling since 2003.
  3. Lyman et al. 2006 and Gouretski and Koltermann 2007 both illustrate that the oceans have been cooling since 2003. The same authors of Lyman et al. 2006 published a correction in 2007 noting that the apparent cooling had been an artifact of errors in the analytical method used. From their abstract: "Two systematic biases have been discovered in the ocean temperature data used by Lyman et al. [2006]. These biases are both substantially larger than sampling errors estimated in Lyman et al. [2006], and appear to be the cause of the rapid cooling reported in that work." Much has been published since then, including a followup by the same authors (Willis 2009)
  4. Over in another thread, Berényi Péter writes: Pre ARGO project OHC data are unreliable. I'm replying here, since the subject was off-topic for that thread and it's on-topic here. Pre-ARGO OHC data are sparser and more difficult to work with. But there are many papers that have successfully analyzed long-term trends in OHC. Here are just a few examples from the past two years: Levitus et al. 2009 Ishii and Kimoto 2009 Domingues et al. 2008 Much of the work from the Levitus et al. 2009 paper was also treated in this2009 presentation at CLIMAR. Note the following comment: "There was a concern that instrumental bias corrections might have affected the long-term trend (1955-2007) in ocean heat content that we previously reported. It will be demonstrated that, although some small corrections are indeed necessary, the instrument bias corrections do not affect the previously reported long-term trend in ocean heat content."
  5. #4 Ned at 21:37 PM on 5 April, 2010 "I'm replying here, since the subject was off-topic for that thread" OK, it was, indeed. However, it came there naturally, as things are interconnected. Just for reference: it was a response to #85 Ned at 00:29 AM on 5 April, 2010 under topic Does record snowfall disprove global warming? You have claimed there that "we've been in El Nino conditions for some time now and there's typically a short-term decrease in OHC when the cycle shifts from El Nino to La Nina". In #86 I have demonstrated beyond reasonable doubt, that recent decrease of OHC has nothing to do with ENSO. Just have a look at the figure. I have also noticed there, that the 2003 jump in OHC may be an artifact due to instrumental change. The NODC OHC graph shows an increase of about 5 × 10²² J in a single year. Since heat storage capacity of all other components of the climate system are negligible compared to the oceans, this energy could only come from an abrupt 3 W m-2 increase of radiative imbalance at TOA (Top of Atmosphere). Let us see. Well, if ISCCP data are considered reliable, nothing like that has happened. There was a sharp decrease of some 4 W m-2 in net incoming flux at TOA between 2000 and 2002. Since then it is practically flat. Therefore reconstruction of OHC history before ARGO is suspect. Sometimes you should use your own head. No amount of peer reviewed literature could save you that effort. #87 Riccardo at 06:43 AM on 5 April, 2010 in same thread wrote: "you're dangerously falling into a grim denialism. You do not bother to verify you claims and let other people do the dirty job to make your denialism apparent. It's a bit boring" Now. I kindly request our host to comment on this attitude. According to the site's Comments Policy "Comments using labels like 'alarmist' and 'denier' are usually skating on thin ice". A couple of other points come to mind as well. John, I would rather not ask you to delete that comment, as it also includes a false claim I'll comment on shortly, but it definitely deserves one of those green boxes. #87 Riccardo at 06:43 AM on 5 April, 2010 "Your claim about the jump in the deployment of Argo floats in 2003 which you immagine is the cause of the jump in OHC is blatantly false. Check youself (pag.4)." Riccardo, you are referring to this image: First things first. I have not claimed there was a jump in deployment. What I did claim, there is a jump in OHC reconstruction and at the same time instrumentation went through a huge change. However, as you may notice, there is indeed a jump in Pacific ARGO deployments during 2003. This jump is due to lack of ARGO floats in southern Pacific (to a lesser extent in southern Atlantic as well) during early 2003. The gap was filled in by December 2003, but it took another four months to get a reasonable distribution by random drift. As for the number of active ARGO floats, it went like this: 2002-04 465 2003-04 797 2003-07 832 2003-08 860 2003-12 1023 2004-04 1158 2004-07 1257 2004-11 1500 2005-04 1788 2005-05 1871 2006-05 2451 2006-11 2743 2007-11 3070 2008-05 3111 2009-07 3319 The histogram shows the annual number of profiles collected, the blue line is the number of active floats. Compare the distributions above to current status: It is only the Number 5 December 2004 issue of Argonautics Newsletter that declares: "Uses of Argo data    Perhaps the most important feature is that the array is now global and this permits us to start to address important scientific issues and to make the data useful to operational centres" You can see how sparse OHC data really are prior to ARGO: All other sources of OHC data also diminished dangerously by the year 2002. It is slide 6 in the Leviticus presentation: Caption: The number of 4°x2° boxes that meet the observation criteria as a function of time for both MBT and XBT comparisons based on computations from WOD data.
  6. Berényi Péter writes: Sometimes you should use your own head. No amount of peer reviewed literature could save you that effort. It's important to use your own head and think about things for yourself. But when considering a highly complex subject outside your own area of expertise it's equally important (or more important) to make an effort to understand what people who spend their whole careers studying that subject have to say. If one only uses one's own reasoning and disregards outside expertise, one is liable to be led into serious errors like this: "[Water vapor] feedback is not positive. If it would be positive, the scenario described above [a runaway greenhouse effect like on Venus] is inevitable. It is not climate science, not even physics. Just plain old math. Plus the empirical fact we are still alive." If you will forgive me for making a critical comment, I think that this kind of disregard for learning from active scientists is one of the weaknesses of many of your comments here. I rarely if ever see you engage at all with the peer reviewed literature, which is a bit puzzling -- this site is unique among climate science blogs because of John's emphasis on discussing the peer reviewed literature, so if you have no interest in that, why do you comment here? This current topic is a case in point. Many people have worked on reconstructions of ocean heat content from the 1950s or 1960s onward. There are debates within the field about the best ways to handle sparse data, the best ways to handle instrumentation biases, and whether there are sufficient data pre-1967 to permit a statistically valid reconstruction before that time. All of these are interesting topics and all of them are discussed in great detail in the literature. Against all that, we have your flat assertion that pre-ARGO ocean heat content data are unreliable. Why? Well, you just say "look at this graph". It's not clear what you think you see in that graph. Oddly enough, the graph itself (here) is actually from a paper titled "Global ocean heat content (1955-2008) in light of recent instrumentation problems," a paper in which the authors describe how they were able to reconstruct ocean heat content from 1955-2008 in spite of various difficulties associated with pre-ARGO instrumentation. Why would you link to that as justification for your claim that the pre-ARGO data aren't reliable? I have no doubt that when you write something like "In #86 I have demonstrated beyond reasonable doubt, that recent decrease of OHC has nothing to do with ENSO. Just have a look at the figure" you sincerely believe you have in fact demonstrated that beyond a reasonable doubt. But alas, what seems convincing to you may be completely unconvincing to others. This is the advantage of testing your understanding against the accumulated expertise of scientists working in the field.
  7. #6 Ned at 11:04 AM on 6 April, 2010 "If one only uses one's own reasoning and disregards outside expertise, one is liable to be led into serious errors" Yes. That's a risk one should accept. However, mistakes can (and should) be corrected. Let's discuss it under the proper topic, please. On the other hand, the only way to actually understand anything is by trying to reproduce it on your own. There is no royal road. "Now there are many things that seem to be grounded in truth and to follow from scientific principles but actually are at variance with these principles and deceive the more superficial. It was for this reason that Euclid set forth methods for intelligent discrimination in such matters, too. With these methods not only shall we be able to train beginners in this study to detect fallacies, but we shall be able to escape deception ourselves". You also ask: Why would you link to that as justification for your claim that the pre-ARGO data aren't reliable?" I suppose you have read the paper. If so, you can see it has nothing to say about the 2003 step-like increase of OHC. Without it most of the multi-decadal trend is gone. Energy conservation is a pretty solid principle. If it ever gets falsified, it would not happen in climate science.
  8. Berényi Péter, i apologize for my too strong wording. But since, contrary to you claim, it is evident from the very same graphs you show (e.g. your third graph) that nothing particular happened in 2003 it really makes me think that you did not go through the data thoroughly and just threw your hypothesis to negate the validity of the OCH data. I would not call this skepticism.
  9. Berényi Péter writes: Without it most of the multi-decadal trend is gone. I don't think so. Here's Levitus et al.2009 figure S9, showing a comparison of three different analyses of OHC from the 1950s onward. Since you think there is a problem in 2003 I've cropped the graph at 2002. The long-term multidecadal increase in OHC is obvious in all three studies. Figure S9 from Levitus et al. 2009. Yearly time series of ocean heat content (10E+22 J) for the 0-700 m layer from this study and from Domingues et al. [2008] and Ishii and Kimoto [2008]. Linear trends for each series for 1969-2008 given in the upper left portion of the figure. Reference period is 1957-1990. You still haven't given any evidence that pre-ARGO OHC data are "unreliable". Since that claim contradicts the results of multiple peer-reviewed studies showing long-term increases in OHC, one would demand very convincing evidence, but you provide no evidence at all, merely assertions. I think we can conclude that the oceans have in fact been warming over the past half-century. This should be no surprise, since oceans cover more than half the planet, and the surface and atmosphere are also warming.
  10. #9 Ned at 21:39 PM on 6 April, 2010 Since you think there is a problem in 2003 I've cropped the graph at 2002 With the same effort you could show us the entire graph. The huge divergence between reconstructions in 2003-2004 is clearly noticeable. If such problems occur in recent years, why would one believe any of it? Also, the choice of 1969-2003 as reference interval is nothing else but cherry picking.
  11. Actually, I could have showed the whole graph with less effort, but I cropped it at 2002 because you had been complaining about 2003. If you don't like the large increase in 2003 in the Levitus et al. data set, feel free to use either of the others.
  12. Berényi Péter pardon me for butting in but you're not the only person remarking on year 2003 as appearing as some sort of wild excursion. However, if you look at the data you that 2003 simply marks the onset of three years of temperature upticks. Looking at the rest of the graph, I don't see anything unusual about these years other than we see three upswings in row. In short, OHC in 2003 does not exhibit a "stepwise increase." 2003 itself is normal in terms of typical Y-axis behavior of this graph, as are other years subsequent to 2003. The "Gambler's Fallacy" tells us we should not be surprised by such an outcome.
  13. For clarification, my previous remark implies that the onset of the upswing begins in the third year of the decade.
  14. Wait a minute, perhaps Berényi Péter objects to the relatively large increase 2003-2004? But why should we arbitrarily decide a particular year's increase is an error simply because it's the largest difference on the graph? How would the record get stuck "up" after that year, if the year in question were indeed wrong? If anything, we ought to see an downward swing after such an error but we don't. Berényi Péter, perhaps you should supply a hypothesis to explain how one year's error can influence subsequent derivations of OHC?
  15. What strikes me about this figure is how close the agreement is among the three different teams. That's pretty remarkable. The general upward trend, on the other hand, is less remarkable. Since there are multiple other lines of reasoning to suggest that OHC ought to have been increasing over the past half-century, it's not really surprising. But it's a nice confirmation of what one would expect.
  16. #15 Ned at 05:04 AM on 7 April, 2010 What strikes me about this figure is how close the agreement is among the three different teams By the year 2004 the difference between Leviticus vs. Ishii & Kimoto is more than 6 × 10²² J. Of course you can call this agreement close, provided the meaning of this word is redefined. In fact the discrepancy between them is so large, that huge error bars are needed to make them consistent. With those error bars I would be surprised to find a trend different from zero at any reasonable level of significance. It would be nice to have all the data in digital format and perform such a test. Anyway. Even by eyeballing (and disregarding lack of significance) the trend between 1959-2001 is 0.2 × 10²² J/year perhaps. It translates to a 0.12 W/m2 net "forcing" at TOA on average during this 42 years long interval. On the other hand according to the Mauna Loa record, CO2 has increased from 315.98 ppmv to 371.07 ppmv. If we accept the estimated sensitivity of 3.7 W/m2 for carbon dioxide doubling given in IPCC AR4 WGI 2.3.1 as a reference point, it should mean a 0.86 W/m2 increase in "forcing" by the year 2001 relative to 1959. Log CO2 being almost linear, average should have been 0.43 W/m2. More than 70% of it is nowhere to be found. And not even feedbacks are taken into account yet. With them the effect measured is barely more than 10% of the radiative imbalance projected by IPCC. The artificial jump of 2003 introduced by Levicus at al. would not improve the situation much. It would make the figure above 15-20% perhaps (of expectations based on mainstream climate science). Either OHC history reconstructions are useless or theory misses some strong negative feedback.
  17. #15 doug_bostrom at 04:47 AM on 7 April, 2010 why should we arbitrarily decide a particular year's increase is an error simply because it's the largest difference on the graph? I have explained it above. The energy needed to create such a jump is missing. you should supply a hypothesis to explain how one year's error can influence subsequent derivations of OHC? No, I do not have to. But I have already supplied one anyway. Instrumentation and coverage changed a lot between fourth quarter 2002 & third quarter 2003.
  18. Berényi Péter, you do need to supply a hypothesis better than simply being suspicious of what could be a coincidental string of increases in observed OHC over 3 years. That's not really a workable hypothesis at all, not without elaboration. Assuming your notion about instrumentation changes is valid, I think you're missing a potential explanation for the "anomalous jump" you see, namely that adding instrumentation improved our ability to measure OHC. If I buy into the idea that 3 years of increasing OHC is down to instrumentation issues, I can as easily say the increase is due to better perception as you may say it's an error introduced by instrumentation changes. Without doing more work, neither of us can be believed. The problem is, neither of us really knows what we're talking about here, not with the degree of expertise needed to sort out the instrumentation problem you believe you see. Fortunately, we amateurs are not the last word on this matter, instead we've got actual scientists working on the case. After all of our handwaving is finished, they're still the horse's mouth with regard to this issue.
  19. I agree with Berényi Péter, it's a travesty that we can not track the energy flow through the climate system ... More details in the well known Trenberth's paper.
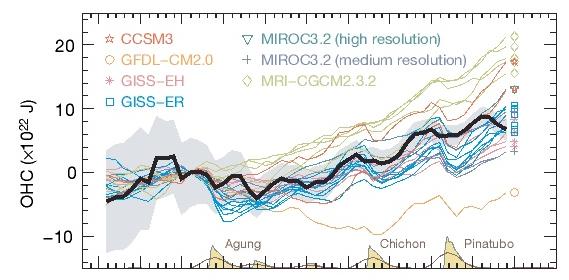
  20. BP writes: Anyway. Even by eyeballing (and disregarding lack of significance) the trend between 1959-2001 is 0.2 × 10²² J/year perhaps. It translates to a 0.12 W/m2 net "forcing" at TOA on average during this 42 years long interval. This seems a bit low. I get 0.26 W/m2 at the ocean surface, not 0.12 TOA, and TOA should be *higher* because of the albedo. Trend +2.4E21 J/year OHC700 (Ishii) or +3.2 (Levitus) or +4.1 (Domingues), from Levitus 2009 Conversion to watts 7.6E13 (Ishii) or 1.0E14 (Levitus) or 1.3E14 (Domingues) Area of oceans 3.61E14 m2 Trend at surface, not TOA +0.21 W/m2 (Ishii) or 0.28 W/m2 (Levitus) or 0.36 (Domingues) For comparison, NASA GISS has a table of annual net radiative forcings here. If you take the 1969-2003 forcings, multiply them by the area of the ocean and convert to J/year, the average over that time period is 1.0E22 J/year. So the OHC700 trend from those three papers is anywhere from 24% to 41% of what GISS suggests it should be. That's a bit low, even assuming some of the heat is going into the ocean below 700m. I'm going to have to read and think more about this; I may be forgetting something. For comparison, Domingues shows the following figure comparing their results to model predictions, including those of GISS: That seems to show their observations falling nicely in the middle of the ensemble of models, which is hard to reconcile with a trend that's only 24% to 41% of what would be predicted from forcings. Unfortunately at the moment Nature's website seems to be down so I'll have to go back and reread Domingues later to see how they explain this.
  21. All that said, I think Doug Bostrom has the most important point here: Without doing more work, neither of us can be believed. The problem is, neither of us really knows what we're talking about here, not with the degree of expertise needed to sort out the instrumentation problem you believe you see. Fortunately, we amateurs are not the last word on this matter, instead we've got actual scientists working on the case. I concur entirely with this.
  22. #21 Ned at 03:33 AM on 8 April, 2010 All that said, I think Doug Bostrom has the most important point here There are things I am as good at as an expert. Energy conservation is one of them. Here are the OHC anomaly data for each quarter between 1955 & 2009 according to the NODC Ocean Climate Laboratory: 1. quarter 2. quarter 3. quarter 4. quarter The error bars supplied are way too small if you take into account the differences between various reconstructions, but that's another story. According to the ISCCP-FD Radiative Fluxes database the 85-89 based Total Net Global Mean Anomaly at TOA is about -3 W/m2, basically flat between 2002 and 2005 with a rapid (sub-annual) oscillation. We do not know the correct offset, so the zero level is arbitrary, but there was no any climatically relevant change detected in this period. There might have been instrumental problems in 2000-2001, none later. Now. NODC OHC anomaly annual averages for 2002-2005 look like this: 2002 7.095 ± 0.527 × 10²² J 2003 10.481 ± 0.535 × 10²² J 2004 12.154 ± 0.494 × 10²² J 2005 11.247 ± 0.445 × 10²² J That is, from 2002 to 2003 OHC increased by 3.386± 0.751 × 10²² J and it has decreased by 0.907 ± 0.665 × 10²² J between 2004 and 2005. The difference is 4.293 ± 1 × 10²² J. It means that Earth has accumulated that much more heat in 2002-2003 than in 2004-2005. As Earth surface area is 5.1 × 10¹⁴ m2, the difference in net radiation balance is 8.42 ± 1.96 × 10⁷ J/m2. A year is 3.16 × 10⁷ sec. Therefore the difference in net radiation flux should have been 2.66 ± 0.62 W/m2. That is, from 2002-2003 to 2004-2005 Total Net Global Mean Anomaly at TOA should have decreased by at least 2 W/m2. It would be very visible in the ISCCP-FD graph, but in fact nothing like that can be seen. The extra heat needed to increase OHC in 2002-2003 could come from nowhere else than from TOA radiation anomaly, since there is no component in the climate system other than the oceans capable to store and supply that much energy. But it could not come from above. Therefore the NODC reconstruction is flawed. Q.E.D.
  23. BTW, even the Levitus OHC history reconstruction gives only a 0.14 °C increase in temperature for the upper 700 m of oceans for the entire 53 year period between 1955 and 2008. It is a problem indeed. Same author says average thermosteric sea level rise for this period was 0.39 mm/year. For a 700 m deep water column to expand by 20.7 mm in response to 0.14 °C warming, volumetric thermal expansion coefficient should be 2.1 × 10⁻⁴. It can only happen if average temperature of the upper 700 m is more than 20 °C. Now. In fact average temperature of ocean surface waters is 17 °C and this is the warmest layer. Below the thermocline (100-200 m on average) it gets really cold fast. At 700 m it can not be more than 5-6 °C. Therefore average temperature for the upper 700 m is somewhere around 10 °C. At this temperature volumetric expansion coefficient of water is only 0.88 × 10⁻⁴. It means that either OHC increased twice as much as Levitus claims or steric sea level rise was half of his value. There is of course a third, most unlikely possibility: temperature of seawater might have increased only in the warmest parts and layers of the ocean and nowhere else.
  24. #23 contd. Looks like volumetric thermal coefficient of seawater also depends on pressure and (to a lesser extent)salinity. It is 2.44 × 10⁻⁴ K-1 at 0 °C, 108 Pa (bottom of abyss). Pressure dependence may close the gap. IES 80 (UNESCO International Equation of State of Seawater 1980) Algorithms for computation of fundamental properties of seawater by Fofonoff & Millard, 1983 Sea Water Equation of State Calculator, Johns Hopkins University, Applied Physics Laboratory, Ocean Remote Sensing Group However, there is still room for improvement
  25. gpwayne - There's an updated chart of Argo and XBT data at the Argo data center through 2009, including the latest updates to XBT corrections. Well worth looking at.

1  2  3  Next

Post a Comment

Political, off-topic or ad hominem comments will be deleted. Comments Policy...

You need to be logged in to post a comment. Login via the left margin or if you're new, register here.

Link to this page


The Consensus Project Website

THE ESCALATOR

(free to republish)


© Copyright 2024 John Cook
Home | Translations | About Us | Privacy | Contact Us