Comparing CO2 emissions to CO2 levels
What the science says...
When CO2 emissions are compared directly to CO2 levels, there is a strong correlation in the long term trends. This is independently confirmed by carbon isotopes which find the falling ratio of C13/C12 correlates well with fossil fuel emissions.
Climate Myth...
CO2 emissions do not correlate with CO2 concentration
'It is easily demonstrated that there is no correlation between CO2 emissions and atmospheric CO2 concentration. Over the three years from 1979 to 1982 when CO2 emissions were decreasing due to the rapid increase in the price of oil that drastically reduced consumption, there was no change in the rate of increase in atmospheric concentration of CO2 proving that humans were not the primary source for the increase in concentration.' (Laurence Gould)
To directly compare CO2 emissions to atmospheric CO2 levels, both sets of data can be converted to gigatonnes of CO2. The CO2 emissions data is typically expressed in gigatonnes carbon (GtC). One gigatonne is equal to one billion tonnes. This means they've only included the carbon element of the carbon dioxide molecule. The atomic mass of carbon is 12, while the atomic mass of CO2 is 44. Therefore, to convert from gigatonnes carbon to gigatonnes of carbon dioxide, you simply multiply 44 over 12. In other words, 1 gigatonne of carbon equals 3.67 gigatonnes of carbon dioxide.
Atmospheric CO2 levels are expressed in parts per million by volume (ppm). To convert from ppm to gigatonne of carbon, the conversion tables of the Carbon Dioxide Information Analysis Center advise that 1 part per million of atmospheric CO2 is equivalent to 2.13 Gigatonnes Carbon. Using our 44 over 12 rule, this means 1ppm = 7.8 Gigatonnes of Carbon Dioxide in the atmosphere.
[Note that the conversion is different for Gigatonnes of Carbon Dioxide emissions, because natural sinks (ocean and biosphere) absorb approximately 55% of human emissions, so the "airborne fraction" added to the atmosphere is about 45%. This means 1ppm = 17.3 Gigatonnes of Carbon Dioxide emissions.]
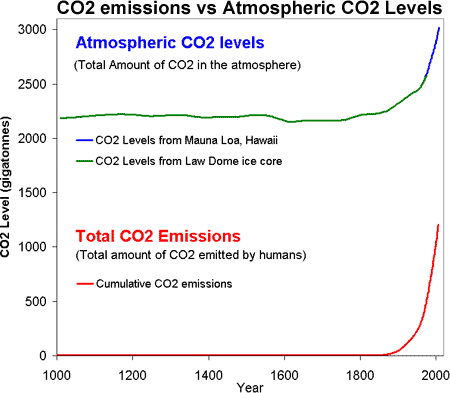
The two time series can both be plotted together expressed as gigatonnes of carbon dioxide:

Figure 1: CO2 levels (Green Line - Law Dome, East Antarctica and Blue line - Mauna Loa, Hawaii) and Cumulative CO2 emissions in gigatonnes of CO2 (Red Line - CDIAC).
So putting it all together, Figure 1 is a plot of the total amount of CO2 in the atmosphere (top) versus the total amount of CO2 humans have emitted into the atmosphere (bottom). Several features jump out. Firstly, the similar shape of the curves (dare I say hockey stick shaped). We have correlation but do we have causality?
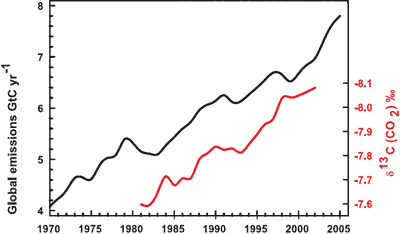
It isn't too much of a stretch to imagine the amount of CO2 we put into the atmosphere might have a causality link with the amount of CO2 that remains in the atmosphere. Nevertheless, further confirmation comes by analysing the types of CO2 found in the air. The carbon atom has several different isotopes (eg - different number of neutrons). Carbon 12 has 6 neutrons, carbon 13 has 7 neutrons. Plants have a lower C13/C12 ratio than in the atmosphere. If rising atmospheric CO2 comes fossil fuels, the C13/C12 should be falling. Indeed this is what is occuring (Ghosh 2003) and the trend correlates with the trend in global emissions.

Figure 3: Annual global CO2 emissions from fossil fuel burning and cement manufacture in GtC yr–1 (black), annual averages of the 13C/12C ratio measured in atmospheric CO2 at Mauna Loa from 1981 to 2002 (red). (IPCC AR4)
This rebuttal was updated by Kyle Pressler in September 2021 to replace broken links. The updates are a result of our call for help published in May 2021.
Last updated on 19 February 2020 by John Cook. View Archives


 Arguments


Dave... "If either of you gentlemen (or anyone else) find another error, or any misleading information, on my site, I will be grateful if you bring them to my attention."
I think you don't grasp that there is no reason for anyone to spend any time on your site at all. It is a multi-year Gish gallop. And here, in your posting efforts on SkS, you've demonstrated a stark unwillingness to update or alter your position on many errors pointed out by others.