


 Arguments


How do human CO2 emissions compare to natural CO2 emissions?
What the science says...
| Select a level... |
 Basic
Basic
|
 Intermediate
| |||
|
The natural cycle adds and removes CO2 to keep a balance; humans add extra CO2 without removing any. |
|||||
Climate Myth...
Human CO2 is a tiny % of CO2 emissions
“The oceans contain 37,400 billion tons (GT) of suspended carbon, land biomass has 2000-3000 GT. The atpmosphere contains 720 billion tons of CO2 and humans contribute only 6 GT additional load on this balance. The oceans, land and atpmosphere exchange CO2 continuously so the additional load by humans is incredibly small. A small shift in the balance between oceans and air would cause a CO2 much more severe rise than anything we could produce.” (Jeff Id)
At a glance
Have you heard of Earth's carbon cycle? Not everyone has, but it's one of the most important features of our planet. It involves the movement of carbon through life, the air, the oceans, soils and rocks. The carbon cycle is constant, eternal and everywhere. It's also a vital temperature control-mechanism.
There are two key components to the carbon cycle, a fast part and a slow part. The fast carbon cycle involves the seasonal movement of carbon through the air, life and shallow waters. A significant amount of carbon dioxide is exchanged between the atmosphere and oceans every year, but the fast carbon cycle's most important participants are plants. Many plants take in carbon dioxide for photosynthesis in the growing season then return the CO2 back to the atmosphere during the winter, when foliage dies and decays.
As a consequence of the role of plants, a very noticeable feature of the fast carbon cycle is that it causes carbon dioxide levels to fluctuate in a regular, seasonal pattern. It's like a heartbeat, the pulse of the Northern Hemisphere's growing season. That's where more of Earth's land surface is situated. In the Northern Hemisphere winter, many plants are either dead or dormant and carbon dioxide levels rise. The reverse happens in the spring and early summer when the growing season is at its height.
In this way, despite the vast amounts of carbon involved, a kind of seasonal balance is preserved. Those seasonal plant-based peaks and troughs and air-water exchanges cancel each other out. Well, that used to be the case. Due to that seasonal balance, annual changes in carbon dioxide levels form regular, symmetric wobbles on an upward slope. The upward slope represents our addition of carbon dioxide to the atmosphere through fossil fuel burning.
Fossil fuels are geological carbon reservoirs. As such, they are part of the slow carbon cycle. The slow carbon cycle takes place over geological time-scales so normally it's not noticeable on a day to day basis. In the slow carbon cycle, carbon is released by geological processes such as volcanism. It is also locked up long-term in reservoirs like the oceans, limestone, coal, oil or gas. For example, the "37,400 billion tons of 'suspended' carbon" referred to in the myth at the top of this page is in fact dissolved inorganic carbon in the deep oceans.
Globally, the mixing of the deep ocean waters and those nearer the surface is a slow business. It takes place over many thousands of years. As a consequence, 75% of all carbon attributable to the emissions of the industrial age remains in the upper 1,000 m of the oceans. It has not had time to mix yet.
Fluctuations in Earth's slow carbon cycle are the regulating mechanism of the greenhouse effect. The slow carbon cycle therefore acts as a planetary thermostat, a control-knob that regulates global temperatures over millions of years.
Now, imagine the following scenario. You come across an unfamiliar item of machinery that performs a vital role, for example life support in a hospital. It has a complicated control panel of knobs and dials. Do you think it is a good idea to start randomly turning the knobs this way and that, to see what happens? No. Yet that is precisely what we are doing by burning Earth's fossil fuel reserves. We are tinkering with the controls of Earth's slow carbon cycle, mostly without knowing what the knobs do - and that is despite over a century of science informing us precisely what will happen.
Please use this form to provide feedback about this new "At a glance" section. Read a more technical version below or dig deeper via the tabs above!
Further details
Before the industrial revolution, the CO2 content in the air remained quite steady for thousands of years. Natural CO2 is not static, however. It is generated by a range of natural processes, and absorbed by others. The carbon cycle is the cover-all term for these processes. It has both fast and slow components.
In the fast carbon cycle, natural land and ocean carbon remains roughly in balance and has done so for a long time. We know this because we can measure historic levels of CO2 in the atmosphere both directly, in ice cores and indirectly, through proxies. It's a seasonal response to things like plant growth and decay.
In stark contrast to the fast carbon cycle, the slow version operates over geological time-scales. It has affected carbon dioxide levels and therefore temperatures throughout Earth's history. The reason why the slow carbon cycle is so important is because many of the processes that lead to long-term changes in carbon dioxide levels are geological in nature. They take place over very long periods and do so on an erratic basis. The evolution of a species that has deliberately disturbed the slow carbon cycle is another such erratic event.
Annually, up to a few hundred million tonnes of carbon pass through the slow carbon cycle, due to natural processes such as volcanicity. That's small compared to the fast carbon cycle, through which some 600 billion tonnes of CO2 pass to-and-fro annually (fig. 1). However, remember that the fast carbon cycle is a give-and-take seasonal process. The slow carbon cycle instead runs in one direction or another over periods typically measured in millions of years.
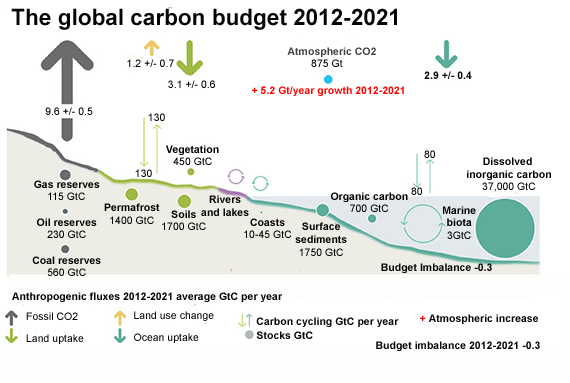
Fig. 1: Schematic representation of the overall perturbation of the global carbon cycle caused by anthropogenic activities averaged globally for the decade 2012–2021. See legends for the corresponding arrows and units. The uncertainty in the atmospheric CO2 growth rate is very small (±0.02 GtC yr−1) and is neglected for the figure. The anthropogenic perturbation occurs on top of an active carbon cycle, with fluxes and stocks represented in the background. Adapted from Friedlingstein et al. 2022.
Through a series of chemical and geological processes, carbon typically takes millions of years to move between rocks, soil, ocean, and atmosphere in the slow carbon cycle. Because of these geological time-scales, however, the overall amount of carbon involved is colossal. Now consider what happens when more CO2 is released from the slow carbon cycle – by digging up, extracting and burning carbon from one of its long-term reservoirs, the fossil fuels. Although our emissions of 44.25 billion tons of CO2 (in 2019 - source: IPCC AR6 Working Group 3 Technical Summary 2022) is less than the 600 billion tons moving through the fast carbon cycle each year, it adds up because the land and ocean cannot absorb all of the extra emitted CO2: about 40% of it remains free.
Human CO2 emissions therefore upset the natural balance of the carbon cycle. Man-made CO2 in the atmosphere has increased by 50% since the pre-industrial era, creating an artificial forcing of global temperatures which is warming the planet. While fossil-fuel derived CO2 is a small component of the global carbon cycle, the extra CO2 is cumulative because natural carbon exchange cannot absorb all the additional CO2. As a consequence of those emissions, atmospheric CO2 has accumulated to its highest level in as much as 15 to 20 million years (Tripati et al. 2009). This is what happens when the slow carbon cycle gets disturbed.
This look at the slow carbon cycle is by necessity brief, but the key take-home is that we have deeply disturbed it through breaking into one of its important carbon reservoirs. We've additionally clobbered limestones for cement production, too. In doing these things, we have awoken a sleeping giant. What must be done to persuade us that it needs to be put back to sleep?
Cartoon summary to counter the myth
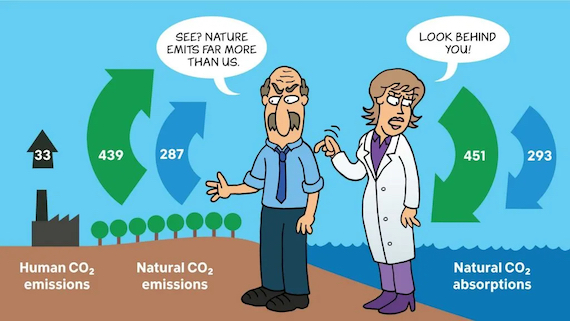
This Cranky Uncle cartoon depicts the "Cherry picking” fallacy for which the climate myth "Human CO2 emissions are small" is a prime example. It involves carefully selecting data that appear to confirm one position while ignoring other data that contradicts that position. Source: Cranky Uncle vs. Climate Change by John Cook. Please note that this cartoon is illustrative in nature and that the numbers shown are a few years old.
Last updated on 17 September 2023 by John Mason. View Archives


I opted to use units of carbon dioxide in my carbon cycle graph because I thought it would be less confusing - people relate to carbon dioxide emissions, not the carbon element of the carbon dioxide molecule. I've regretted it ever since because the convention is to use carbon and hence much confusion has ensued. I will update my carbon cycle graphs with units of carbon sometime down the track (when I get the time).