


 Arguments


CO2 is the main driver of climate change
What the science says...
| Select a level... |
 Basic
Basic
|
 Intermediate
| |||
|
Theory, models and direct measurement confirm CO2 is currently the main driver of climate change. |
|||||
Climate Myth...
CO2 is not the only driver of climate
I don’t “deny” climate change or global warming, it is clear to me that the Earth has warmed slightly in the last century, this is indisputable. I also believe that increasing amounts of CO2 in Earths atmosphere are a component of that warming, but that CO2 is not the only driver of climate as some would have us believe. However, what is in dispute (and being addressed by mainstream climate science) is climate sensitivity to CO2 as well as the hiatus in global warming, also known as “the pause”. Since I embrace the idea of warming and that CO2 is a factor, along with other drivers including natural variability, the label “denier” is being applied purely for the denigration value, and does not accurately reflect my position on climate. (Anthony Watts, May 2015)
At a glance
It may come as a surprise to some people unfamiliar with climate science, but tracking down anyone who actually said, "CO2 is the only driver of climate change", has proved most elusive. Thus, the idea that, "CO2 is not the only driver of climate as some would have us believe.", is lacking something rather important. Who actually said it?
In climate science, nobody ever said it. That's because climate science covers everything that affects the climate. If you don't include everything, it would be like trying to find out how an internal combustion engine-powered car works, using as an example one without a crankshaft. The talking-point looks more like an example of a straw man fallacy, in which an argument, claim, or opponent is invented, and then shot down in flames, point-scoring being the idea. One sees this a lot in politics, but not in science.
Through science, we know that Earth's climate is affected by a myriad of drivers that operate on timescales varying from seasons to tens of thousands to tens of millions of years. We've investigated them in depth and we continue to do so. We understand which ones act as 'radiative forcings' - the external, independent primary drivers that determine whether energy is being added to or removed from the system. We likewise understand which ones act as 'feedbacks' - secondary drivers that determine how energy is moved around within the system.
The very nature of science is that it is an ongoing self-correcting process in each and every discipline. So we do understand the key forcings and feedbacks that operate within our climate and on what time-scale they occur. CO2, along with the other greenhouse gases, is but one of these factors.
Before you get too relaxed, however, of all the variables out there, CO2 is the one that has seen a huge change. Since pre-industrial times its concentration has gone up by a whopping 50%. Just imagine if a change of that amount occurred with another part of the climate system. How about the strength of sunlight going up by 50%?
Ironically, at the time of writing (early 2024), there is a lot of discussion as to why 2023 was so warm. The heat came on particularly in the second half of the year, coinciding with the onset of strong El Nino conditions in the Pacific Ocean. But normally there's a lag between El Nino starting up and peak temperatures. Did the injection of unusual amounts of water vapour into the upper atmosphere by the Hunga Tonga-Hunga Ha'apai volcano have a hand? Possibly. Did the cleaning-up of sulphate aerosol-generating shipping fuels partially remove a well-known negative or cooling feedback, and if so by how much?
The trouble is that scientific investigations involve a lot of careful hard work and that takes a lot of time. For people more used to the instant answers of politicians, that might be disappointing, but there's a difference. Science requires evidence, politics less so.
Please use this form to provide feedback about this new "At a glance" section. Read a more technical version below or dig deeper via the tabs above!
Further details
If you have read the at-a-glance section, you will have already realised that the myth that some climate scientist said, "CO2 is the only driver of climate change", is a good example of a straw man fallacy in which an argument, claim, or opponent is invented, and then shot down in flames. But for completeness, let's take a quick look at some other drivers of Earth's climate system.
Natural processes have determined Earth’s climatic history for its 4.56 billion year long existence. However, right at the very end of that time-line, humans have come along and deliberately brought significant change to one mechanism that is driving Earth’s climate into the future.
At any given time, the Earth’s climate is subjected to a myriad of natural climate forcing and feedback processes. The impact of each varies with the magnitude of the natural change. It varies with the duration over which the change occurs and whether or not that change is part of an overall repeated cycle. Cyclic variations tend to cancel themselves out over time. However, remember that time may be orders of magnitude greater than a human lifespan.
Processes that have historically altered the face of the planet include things like cycles in the Earth’s orbit around the Sun or shifts in the planet's tectonic plates. Orbital cycles are potent enough to trigger periods of glaciation in the current Icehouse climate state on Earth. They can also bring us back out of ice-ages, with the help of amplifying climate feedbacks. These large changes take place over tens of thousands of years.
Plate tectonics rearranges continents. It brings them to collision, throwing up mountain ranges. Or it rifts them apart, creating new oceans in the process. But these changes are very slow. Tectonic plates, at their fastest, only move at the same rate at which human fingernails grow, Such geographical rearrangements typically occur over millions of years.
While not nearly as dramatic, the influence of solar, ocean and wind patterns is much more immediate. The El Nino Southern Oscillation (ENSO) is a good example. But the warm phase - El Nino - has a cool counterpart - La Nina. These phenomena swing between warming and cooling respectively, over the course of months to years. So they roughly cancel one another's effects out. Having said that, there are decades during which La Nina or El Nino has been predominant, such as the period from 2000-2012, once popularly referred to by climate science deniers as 'the pause'. All consigned to the dustbin of history now, of course. ENSO involves heat being moved around within the climate system. In a La Nina-dominated decade, that heat is mostly going into the oceans. That's what actually happened in 2000-2012.
Volcanic eruptions and impacts from celestial bodies such as asteroids have a near-instant effect. Luckily though, very few of these one-off events are of sufficient size to impact the global climate for more than a few years. That was not always the case in the deep past, which is why we invest in monitoring such things carefully.
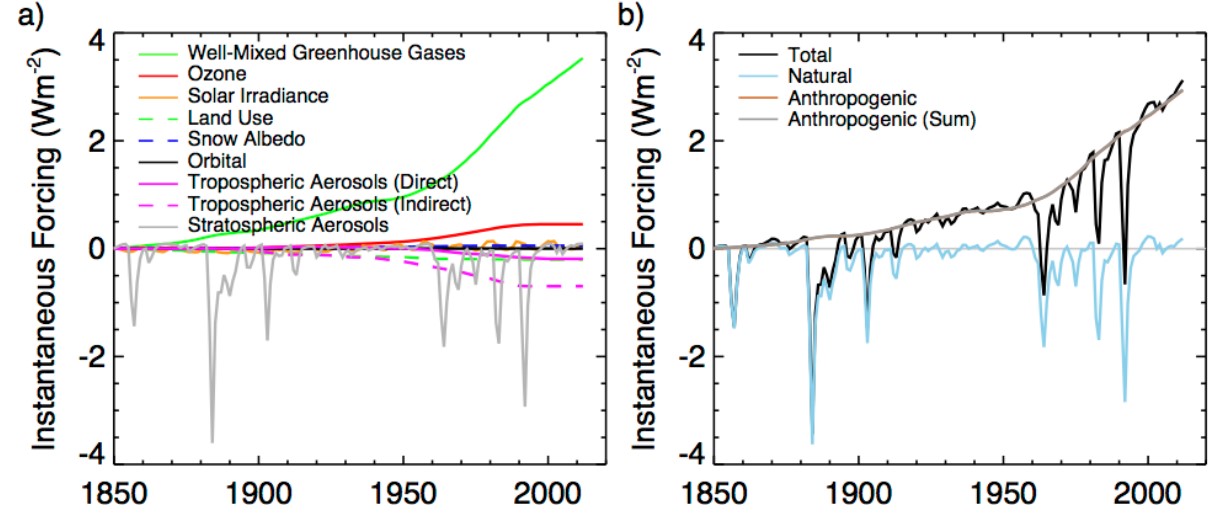
Fig. 1: Instantaneous radiative forcing at the tropopause (W/m2) in the E2-R NINT ensemble. (a) Individual forcings and (b) Total forcing, along with the separate sums of natural (solar, volcanic and orbital) and anthropogenic forcings. Source: GISS.
The industrially-driven increase in CO2 and other greenhouse gases to the atmosphere profoundly differs from such natural processes. This human influence is happening very rapidly (fig. 1). It is not cyclical and it pushes the climate continually and relentlessly in the single direction of warming. And we know we are doing it.
No other species has done this intentionally. The cyanobacteria that oxygenated Earth's atmosphere, starting around 2,450 million years ago, did cause major climatic change as a side-effect. However, nobody can seriously accuse them of having done it on purpose.
Other human-related factors need to be considered too. They include changes in land use, emissions of carbon soot and aerosols. These are all likewise studied individually. However, their net impact is cumulative. Likewise, over the last 50 years of satellite observations of the Earth’s climate, all natural influences have been studied in detail. These include orbital variations, solar output, volcanic activity and changes in both surface and cloud-top albedo. Oceanic fluctuations such as ENSO and the Pacific Decadal Oscillation (PDO) have likewise been tracked as they vary back-and-forth through time.
Natural processes will continue to introduce short term variability in our climate. However, the relentless rise of CO2, now 50% up on pre-industrial levels, has become the dominant factor in determining our planet’s climate now and in the years to come. Other factors like those mentioned above will manifest from time to time over the short term: warmer and cooler years, sometimes singly, sometimes in clusters. These form the irregular noise on temperature graphs (fig. 2) and Realclimate has an interesting recent discussion on the record-breaking 2023 and the factors responsible here. But the bottom line is that all of the graphs show that same long term trend. Upward.
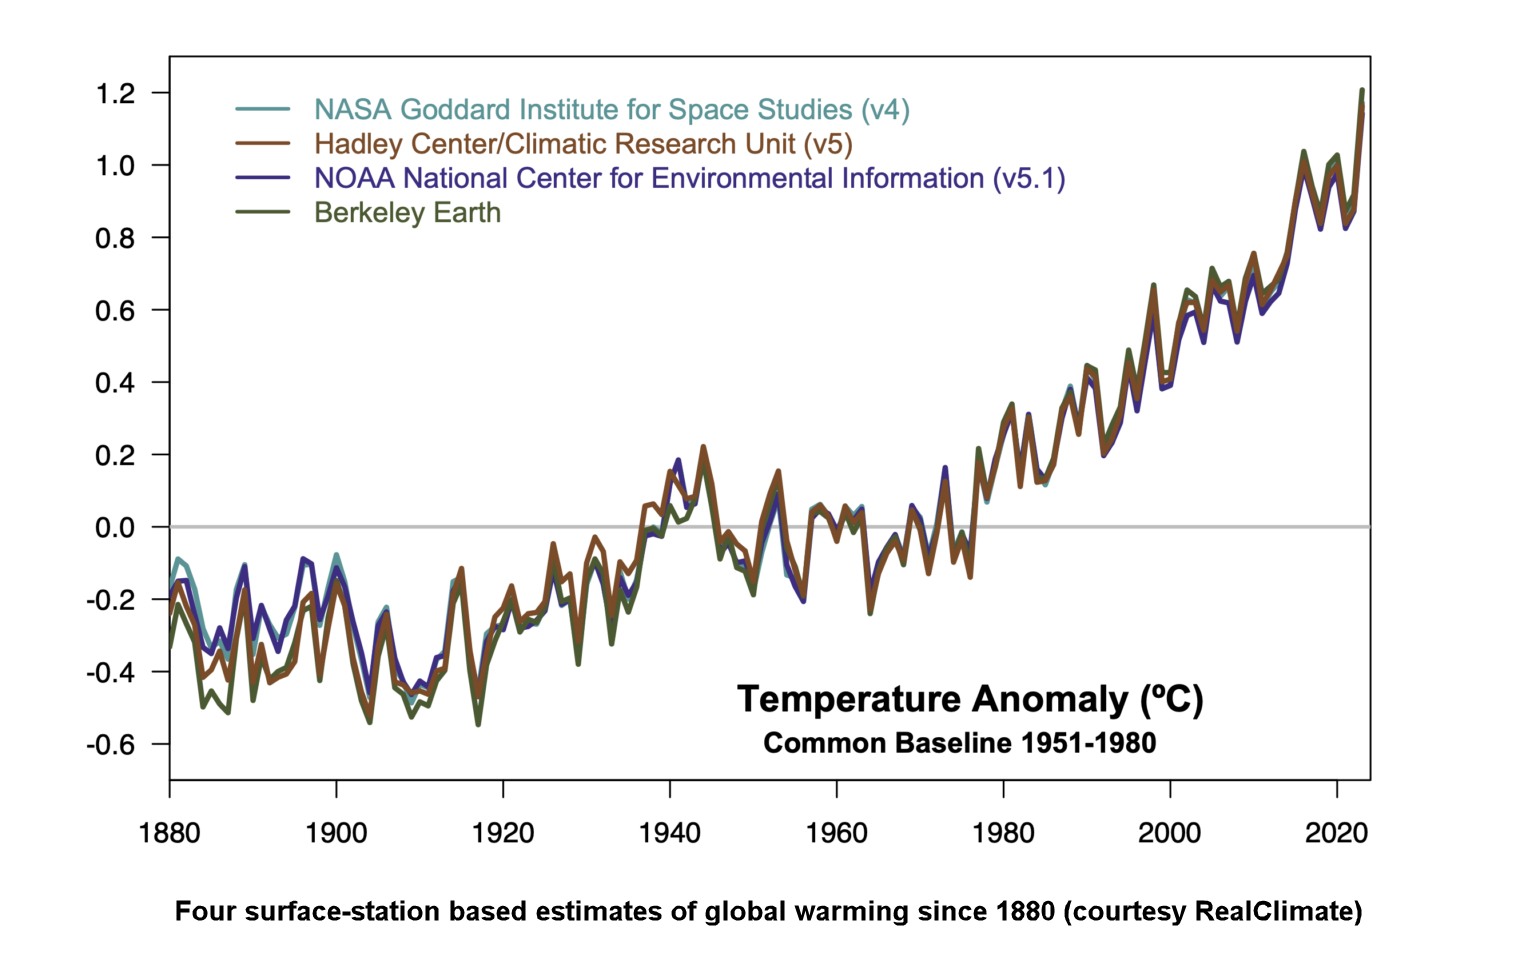
Fig. 2: up and up. Graphic: RealClimate.
Last updated on 26 May 2024 by John Mason. View Archives


billev @50, try reading the graph @45 (reproduced below). You will clearly see the observations are labelled as the GISS LOT five year running mean:
For comparison, here is the GISS Land Ocean Temperature Index, as produced by NASA:
You will notice that the red line is labelled as the 5 year running mean, and matches the five year running mean as I have produced it.
So, if you could not find a temperature series matching mine, it means only that you did not look very far, or that you did not recognize a line clearly labelled as a five year running mean to be a five year running mean.
As to the trend, in the GISS LOTI, 2002 equals the anomaly of 1998 (which was then the record anomaly), but was exceeded in 2005, 2006, 2007, 2009, 2010, 2012, 2014, 2015, and will be in 2016. Of those years, 2005, 2010, 2014 and 2015 set new records, as will (almost certainly) 2016. The trend from 2002 to 2015 is 0.124 C per decade, which rises to 0.168 C/decade if you include the first 4 months of 2016.
You may not want to include 2015 and 2016 as El Nino years, but that does not explain why you don't want to exclude the 2008, 2011, and 2012 which were all near record breaking La Nina years. Of course, if you do want to exclude those years, it begs the question why you are looking at the trend from 2002 at all.
To call that a "pause" is to show abysmall ignorance, or to lie.
I did not answer your question @46 because, IMO, if you want to start running a conspiracy theory about global temperature records (which appears to be what you are angling for), I expect you to do it explicitly and on topic.
billev@50:
"....and they indicate a pause in warming starting about 2002."
What pause?
As Glenn explained in @28, ocean heat content is a much better indicator of global warming than atmospheric temperature, at least in the short term (a decade or two). If you study the chart he posted, you will find that the ocean warming from 2002 to 2015 was about 40% faster than in the previous 13 years, from 1989 to 2002! So, what pause are you talking about?
As this thread is about CO2 vs other drivers of the climate, I want to include this chart (from Hansen & Sato 2004, "Greenhouse gas growth rates") which shows the annual increase of forcings from the well mixed greenhouse gases since 1950. Note that CO2 was less dominant a few decades ago because the contributions from methane and CFC’s were much larger.
Billev, if you found a 20-year "pause" in the global mean surface temperature trend, what would you make of it?
1. Would you draw conclusions regarding the physical nature of the climate system? (e.g. the greenhouse effect does not exist)
2. Would you conclude that global warming has stopped?
3. Would you conclude that scientists are engaged in fraud, because clearly this is some sort of natural pattern?
4. Would you respond thusly: "Given that the greenhouse effect is extremely well-supported, and given that humans are indeed continuing to dump stored carbon into the atmosphere at an unprecedented rate, and given that ocean heat content continues to increase unabated, I wonder what's causing this pause in the surface temperature trend. I'd better take a closer look at the physical mechanisms involved."
"Has there ever been any testing to examine the relationship beween the temperatures measured by the official measuring sites and the surface temperature at those sites?"
I cant understand what you mean here. An official surface temperature sites measures the surface temperature at that site?
Note the intricacies of local temperature variations at a site are removed for climatic purposes by looking at anomalies not absolute temperature. Defining absolute surface temperature is extremely difficult and not a lot of use.
Ie, a 0.5C temperature rise, is a change in averate temperature of 0.5C from some baseline. Local surface temperatures vary enormously over short distances, but changes in temperature anomaly are consistant across 1000s of kilometers. (ie if it is warmer than usual in your city it is generally warmer than usual in the neighbouring city). The classic work on this is Hansen and Lebedeff 1987, but it rests of decades of earlier research on how best to measure temperature.
Billev: I inadvertently deleted your prior two comments. Please repost them.
Here are Billev's last two posts copied from the deleted comments bin where they were accidently sent by JH.
4:13 am May 31:
"The fact that CO2 absorbs heat is not the issue. The issue is whether the level of CO2 present in the atmosphere is sufficient to cause the warming the Earth has experienced since 1880. What form of measure has been employed to positively link the CO2 exisisting in the atmosphere to the warming of that atmosphere?"
4:21 am May 31:
"michael sweet @48, why is a "good argument" about the small level of CO2 in the atmosphere worth much. What is needed is an actual measurement of atmospheric CO2's role in the Earth's warming not an "argument".
Billev:
What do you want measured about CO2's role in Earth's warming that has not already been measured? In 1896 Arrhenius calculated the effects of CO2 and predicted the increase in temperature. He took the absorbtion lines for CO2 and combined that data with the measured lapse rate to make his calculations. His calculation is similar to the high end of the IPCC range today. He also predicted that the night would warm faster than day, winter faster than summer, faster over land than water, faster in the Northern Hemisphere than the Southern and fastest in the Arctic. He did not predict that the Stratosphere would cool as the Earth warmed because the Stratosphere had not been discovered yet. You are 120 years behind scientists.
Tom Curtis has posted hundreds of graphs that show the effect of CO2 in the atmosphere. You have to say what effect you are not satisfied has been measured yet for me to respond. I suggest you use the search function in the upper corner to find posts that describe the data you want.
Billev seems to repeating himself because he doesnt like the answer - scientists measure the CO2 contribution to surface radiation by measuring it both at the surface and at top of atmosphere. It is positively tied to CO2 by the spectral signature. However, Billev seems to be contending that somehow this measured increase in radiation, positively identified to be from GHGs, has not be proven to actually heat the surface!! You can demonstrate that radiation in that frequency will heat a surface in a lab, (must do so by Plancks law) but apparently that is not good enough.
Again Billev - stop avoiding the question and tell us what you think is heating the ocean and why this heat increase matches the GHG radiation?
Chiming back in again....
Billev's posting pattern is one of repeated "Just Asking Questions". I have yet to see him give any sort of indication regarding just what sort of "proof" he would accept, and I have yet to see him give any sort of detailed explanation as to why the answers he has been given are unacceptable.
I do not see BIllev's pattern as encouraging an honest discussion of the issues.
One issue he keeps beating to depth is his claim that he doesn't believe that CO2 is in sufficient quantity to make a difference, being in low concentrations. With radiation transfer, the presence of radiatively-inert gases in the atmosphere does not dilute the radiative effects of gases that are active in the wavelengths in question. It doesn't matter if it is 0.03%, 3%, or 3% of the total - it's the absolute amount that matters. And it's enough to matter.
In fact, radiative measurements of sunlight can be used to determine the total quantity of a particular gas. A very common example is ozone - instruments measuring UV radiation at wavelengths where ozone absorbs strongly can be used to get the total atmospheric O3 value. The original instrument for this was the Dobson spectrophotometer, and the current Rolls Royce version is the off-the-shelf Brewer spectrophotometer. The total quantity is what matters, not the concentration. (Where the ozone is does matter in terms of atmospheric response, but the absolute amount can be measured regardless of whether it is spread evenly throughout the atmosphere or concentrated at one altitude.)
It's like cyanide. If a few millgrams in a cup of water will kill you, a few milligrams in a bucket of water will kill you, too. Dilution is not your friend, until you've added so much water you can't drink it all in a short time scale.
Where is the proof that CO2 is driving the climate and not a third exogenous variable, like solar energy. Please post the evidence that proofs undeniably this supposed fact. correlation does not mean causation.
[BL] Science does not "prove" things - it supports positions with evidence. "Undeniable proof" does not exist for people that are are unwilling and unable to review evidence.
Skeptical Science is a user forum wherein the science of climate change can be discussed from the standpoint of the science itself. Ideology and politics get checked at the keyboard.
Please take the time to review the Comments Policy and ensure future comments are in full compliance with it. Thanks for your understanding and compliance in this matter.
Gzzm @60 ,
the evidence regarding CO2 ~ is to be found in the latest IPCC report, and also in many other places such as the websites of the learned scientific societies (e.g. American Academy of Sciences, the U.K. Royal Society). They all give the same basic information for you, yet you will find the most detail at the IPCC.
Since you seem to be starting from scratch, and it will take some hours of instruction, you should not ask Tom to spoonfeed you.
gzzm2013 @60,
I am curious as to what you actually mean by describing CO2 as either "driving the climate" or being "a third exogenous variable."
Beyond than you ask for 'undeniable proof' of 'causation'.
While, as the response indicates, there is s great deal of evidence to show this "causation", perhaps the simplest "proof" is the IR spectrum of Earth's cooling system. The big bite out of the spectrum at Wavenumber 666 is "undeniably" due to CO2 and thus "undeniably" the direct cause of a quarter of the planet's greenhouse effect and this being so is also "undeniably" the driver of the other three-quarters.
I will rephrase my question:
Where is the proof that CO2 is driving the climate change (via greenhouse effect) and CO2 variation is not an effect of other variables, like solar energy. Please post the evidence that proofs undeniably this supposed fact. Correlation does not mean causation.
Where is the proof that CO2 rising levels in the atmosphere is causing increasing global surface temperature? Don't give me general comments like its all over this website, or all over IPCC reports, please point to me to the exact evidence, the definite and exact published scientific reasearch paper, who is the author, when was it published, in what journal, and so on.
You cannot brush these questions off by saying, you are a beginner, go on a read all my claims, go and read this website and then come back.
Simply answer directly the questions raised before, in plain and simple English. Einstein said if you can't explain it to a 6 year old, you don't understand it yourself. Carl Sagan said extraordinary claims require extraordinary evidence. Please produce here the evidence. It should not be hard for a matter that is supposedly settled.
[BL] Repeating the same baseless, uninformed, arrogant challenges is going to waste everyone's time.
Either show a willingness to read some material and engage in discussion, or your posts will be deleted.
gzzm2013,
Your request for an answer you can understand on the subject of CO2 as a greenhouse gas have fallen fowl of moderation. While I have already presented an answer for you above @62, perhaps a more detailed explanation would assist you, something which Einstein's 6-year-old could grasp. You also elsewhere insist that the mechanisms of an actual greenhouse and the planet's greenhouse effect are fundamentally different. I will also address the falacy within that argument.
The graph presented @62 shows three traces, Ts, Tmin and a raggedy one inbetween.
Ts is the radation we would expect from a planet with a temperature of +15ºC but no greenhouse effect, +15ºC being the average temperature as the Earth's surface. The raggedy line is a trace of the actual radiation from Earth. The raggedy trace is important as the area beneath it represents the energy radiated out into space. It is what cools the planet.
If the area below the raggedy trace does not equal the area below a similar trace of incoming absorbed radiation from the sun, the temperature of Earth will change until they do become equal.
The size of the Earth's greenhouse effect is represented by the area between Ts and the raggedy trace. About a quarter of that area is the big bite out of the raggedy trace at Wavenumber 666. That big bite is caused by CO2.
So imagine there was no CO2 and the big bite was absent. The area under the raggedy trace is now bigger and no-longer equals to the area under the solar heating trace. So the raggedy trace would become lower as Earth cools to make them equal again. (And a cooler Earth will have a lower Ts trace as well.)
And what makes CO2 even more important than providing directly a quarter of the Earth's greenhouse is that the other three-quarters is down to water vapour in the atmosphere. A cooler planet cannot support the same amount of water vapour in its atmosphere. This increases the height of the raggedy trace along much of its length again making the area underneath unequal to the solar heating trace. The planet thus has to cool even more to put them back in balance, which again reduces the level of water vapour in the atmosphere causing yet more planetary cooling. The upshot is that without CO2 in Earth's atmosphere, the temperature becomes so low that the greenhouse effect pretty-much disappears. That is the power of CO2 in our atmosphere.
And run it the other way by increasing the level of CO2 in the atmosphere, the big bite becomes bigger and Earth has to warm up to shed the extra heat caused by the CO2-enhanced greenhouse.
...
You also argue elsewhere that an actual greenhouse works by preventing convection while the greenhouse-effect works radiatively. You suggest that this difference in operation, one convection the other radiative, makes the term 'greenhouse' inappropriate for a planetry 'greenhouse' effect. Your argument is not actually well-founded.
Both a greenhouse and the 'greenhouse' effect rely on radiative effects to operate. The incoming solar radiation freely passes through the glass/atmosphere while outgoing radiation of a longer wavelength is unable to pass freely back out.
The greenhouse does also require the glass to prevent the heated air within causing convection and so dissipating the elevated solar warming. The atmosphere also acts to generally prevent convection. Of the two, a greenhouse is atually more leaky than the atmosphere which has a very gentle upward convection process (outside serious storms etc which in the grand scheme of things are quite rare). On average it takes over a week for a packet of air to rise the 12km to the top of the troposphere.
I feel that I am a total neophyte, I have a lot of respect for the understanding of the atmosphere that resides in this forum.
I don't deny the atmosphere has been warming for the past 200 years or so.
In looking around the internet for answers, I recently read about a planetary cycle described by P.A. Semi at http://semi.gurroa.cz/Astro/Orbital_Resonance_and_Solar_Cycles.pdf page 48.
He says this 934 year cycle coincides with the relatively short cycles of climate change, i.e., medieval warm period and medieval cold period(little ice age) and prior.
If this cycle is fact, then the earths climate is warming now from natural processes coming out of the "Little Ice Age" and CO2 may not be the driver of recent warming of .9 deg C of the last 170 years.
I'd love to know what others think of this.
[TD] That speculation is incorrect. Please see this post, and put further comments there. Everyone who wants to reply to this comment here, please please instead comment over there instead.
[TD] People wanting to reply to this comment: Also, you might want to wait until somebody checks for sockpuppetry. "LikeItWarm" seems an odd handle for someone who has such a lot of respect, and the details in this comment seem not entirely consistent with "neophyte."
A reply to Likeitwarm @65 has been posted on the thread indicated as others may be curiiious about the thesis cited @65.
Hi. Neophyte here again and I do consider myself that, but I keep trying to learn.
I think this'll be on topic, but possible it should be under "it's the sun". Sorry if I made a mistake.
I ran into this article: https://coldclimatechange.com/carbon-dioxide-is-a-cooling-gas-according-to-nasa/
Let me know what you think of it. I'll keep reading.
[BL] Link activated.
The web software here does not automatically create links. You can do this when posting a comment by selecting the "insert" tab, selecting the text you want to use for the link, and clicking on the icon that looks like a chain link. Add the URL in the dialog box.
...and pay attention to Rob Honeycutt's comment, along with the portion of the Comments Policy that states:
No link or picture only. Any link or picture should be accompanied by text summarizing both the content of the link or picture, and showing how it is relevant to the topic of discussion. Failure to do both of these things will result in the comment being considered off topic.
Well, Likeitwarm... I'd say that's one seriously ludicrous piece of writing you've linked to there.
It's a long Gish-gallop of anti-science, so was there any specific point contained in it that you'd like to see addressed? If you don't narrow it down a little it would require a very long response to debunk the loads of crap written on that page.
Sigh. If only people would stop checking their cerebral cortex at the border to Denierstan: people live in the troposphere, not the thermosphere.
I know they both start with "t", but that's all they have in common.
From NASA scientist Martin Mlynczak:
"There is no relationship between the natural cycle of cooling and warming in the thermosphere and the weather/climate at Earth’s surface. NASA and other climate researchers continue to see a warming trend in the troposphere, the layer of atmosphere closest to Earth’s surface."
https://climatefeedback.org/false-claims-coming-ice-age-ecosystem-unreliable-news-sites-blogs-social-media-accounts/
"Observations have shown that solar flare activity on the surface of the Sun is in the quiet phase of its continuing 11-year cycle. This causes cooling of the thermosphere—a layer of the atmosphere that starts 65 miles above the surface—and will not cause noticeable cooling at the surface"
https://climatefeedback.org/claimreview/metros-claims-of-coming-mini-ice-age-have-no-basis-in-reality/
https://spaceweatherarchive.com/2018/09/27/the-chill-of-solar-minimum/
Please surprise us by demonstrating some actual skepticism.
Greetings. @Daniel Bailey
""Observations have shown that solar flare activity on the surface of the Sun is in the quiet phase of its continuing 11-year cycle. This causes cooling of the thermosphere—a layer of the atmosphere that starts 65 miles above the surface—and will not cause noticeable cooling at the surface""
- so how could happen the Maunder Minimum, when the baltic sea and the thames were frozen then?
Btw. Im still curious on early indirect data measures. We use satelites and probably thousand of observation-stations everywhere, even in already urban densed areals where its hotter due to soil sealing/buildings etc. than decades ago.
but how precise can data be when hundreds or even thousand of years ago, where we usually collect data from drilling cores from ice, dendro analysis etc.? the modeled graphs showing co2 concentration or temperatures from early periods of the neogene era for example could never be scaled that detailed like modern oberservations, so how do we could know other than extrapolate or try to forecast on this "rough" data? just saying the data of the past century heavily fluctuates with different natural events as we have a lot of different parameters and thousend of different stations to check. but few hundred years ago there are some marks here and there for months or years, not thousends a day - you know what i mean?
so anyway do we have a chance to differentiate natural occuring warming of the past few decades from self-induced co2 with this methology?
I just think we cannot use modern nanotechnolgy to understand stone-age tools were used, or maybe better metaphor: collecting a bunch of single bones from an ancient creature is no evidence to know how it moved or hunted, even we know a lot of biomechanics today and may let us classify the biological type/race etc.
hope its understandable, as im no native speaker obviously :)
Piotr @70 ,
Think about it this way ~ causes and effects.
In this universe, if you see an effect, there must be a cause (and with enough study, you can find that cause - which may be a single cause, or a combination of causes).
Past studies (by experts) have shown broad changes in climate - not measured in tenths of a degree as per modern thermometers, but in broad assessments of indirect indications of climate average temperatures / sea level changes / vegetation changes / and so on. From this, it is evident that the climate changes when there is a causative change (a change in solar output, or in atmospheric CO2 levels, or in reflective "albedo" from global ice coverage, or in stratospheric aerosol particles from major volcanic eruptions).
All these jig-saw pieces fit together nicely, to give the scientists (and us) a good understanding of how climate "works".
Beware of non-scientists who say that "stuff just happens" [excuse the American expression]. They seem to wish to believe that the past century or two of very rapid global warming is somehow not caused by the obvious causes. And that it came for no identifiable reason. They seem to wish to believe that the modern warming "just happened for no cause" (sometimes expressed in the meaningless phrase "it is just a rebound from the Little Ice Age").
(The Little Ice Age had its own causes - frequent major volcanism plus episodes of reduction in solar output.)
Or they say that the modern rapid warming must instead be caused by "long-term changes/oscillations in ocean currents" ~ which actually does not make scientific sense (if they bothered to think it through).
Piotr, there are definitely some people who do not wish to think.
piotr @ 70:
You ask what might have caused the Maunder Minimum. First, you should think about exactly what the Maunder Minimum was: a period of low sunspot numbers. Wikipedia has a good article, and they include this figure:
Technically, "what caused the Maunder Minimum?" is a question of astrophysics, not climatology. But what you are probably wanting to ask is "what caused the xxxxx?, where xxxxx is something that you feel is correlated with the Maunder Minimum. Reduced solar irradiance? Lower temperatures? The Little Ice Age?
So, this means that you are looking at something where the Maunder Minimum is an indirect/proxy indicator of some potential climate factor. You do realize that we do not have direct evidence that the Maunder Minimum caused a specific decrease in solar irradiance? You do realize that many of the observations indicating cooler temperatures - such as ice on the Thames -are local, and not global? The Little Ice Age appears to be related to a number of factors. You can read about it a bit more in this post.
Understanding of past climates is based on things like vegetation, sediments, etc. A lot of those have automatic time-averaging (trees don't grow in a year) and spatial averaging (sediments and pollen get carried in to lakes from large watersheds). The analysis of past climates includes a wide variety of proxy indicators. You can read more about it on this post.
In short, you need to be more specific in explaining what you do understand, and what questions you have.
@Bob Loblaw
Not directly. I was just wondering on Nasa's Martin Mlynczak statement to Grand solar minimum "and will not cause noticeable cooling at the surface". Yeah, not globally, except the overall temperatures may decrease a bit in statistics too. But it noticeable cooled large parts of the nothern hemisphere, like big vulcanic eruptions can cause for few years and did in even the last 150 years too -> global mean temperatures decrease up to 1.5°C, besides some areals warmed then too.
So what is Martin Mlynczak talking about? The past 10.000 years where up and downs in global mean temperature like +/- 2°C for dozen decades, even for nearly 2000 years - as we can reconstruct with little data-points.
Overall my main questions is the concerning how plausible is the reconstruction of earthly temperatures over thousands of years just with indirect data besides modern technology with thousend parameters, stations around the globe and on every time (even in grown urban places, which totally heat up just being sealed ground and overcrowded for decades). modern observation for like 30 years am totally cool with, but the rest is a large extrapolation of indirect measurement and got "worse" at we strife further away in time.
Just imagen if we would have high technology measurements like today in for example 6000 BC to 5500 BC, then we would see global warming for at least 0,5 - 0,8 °C over aproxx 1-200years similar like today and we knew that for some areas or changing habitats like sahara desert, but not excessive like modern data amount. btw. its also stated there were same co2 ppm levels as pre-industrial times.
i think its "fascinating" to have data from million years ago, when no modern human lived and we think to "know" how life was back then, globally, just by knowing some single fragments and feeding supercomputers with, which try hart to simulate complex features like climate or even local weather to be back then. Im a big fan of astronomy since my child days and read about the fist extrasolar-findings back in the days. but thats much more extreme, as we can never proof for real, even if its pretty possible to conclude a habital place somewhere on a planet just by reconstruction of the atmosphere, despite being back in time maybe million years ago. its hilarious to say "we found a possible earthlike planet!".
Piotr @73 ,
Wind & ocean currents move heat energy around the planet - and so there is a considerable "averaging" effect on global temperatures. Even today, you do not need thousands of observation stations in order to assess changes in global temperature. Analysis shows that less than 100 stations are needed (if well-distributed, of course) to give a closely accurate picture of conditions.
A so-called Grand Solar Minimum is not actually very grand ~ studies such as Feulner & Rahmstorf, 2010 and Anet et al., 2013 indicate that a GSM produces a global cooling of around 0.3 degreesC. (Other studies indicate slightly smaller changes.) And this is because our Sun is a very stable star, with a very stable output of radiation. Very little variation.
Even the Little Ice Age was not spectacularly cold ~ a global cooling around 0.5 degreesC . . . which had been helped along by a number of cold winters from volcanic eruptions.
There have been periods of decades of marked cooling in the neighborhood of Greenland earlier in the Holocene, as a result in temporary changes in ocean currents. But these had little effect on average global temperature (the planet is big, and there is a vast amount of tropical ocean). The one exception is the millennium of strong cooling (the "Younger Dryas" ) about 12,000 years ago ~ and this was a one-off event produced by the single event of melt/discharge of the Laurentide Ice Sheet situated in Canada.
Piotr, you seem to have a wrong idea about earlier warm periods (of the Holocene) such as the so-called Minoan / Roman / Medieval Warm Period ~ these were only very slight changes, around 0.3 degreesC or smaller. These were only tiny "blips" on the general slow cooling from the Holocene Maximum temperature (slow cooling owing to the Milankovitch Cycle).
Possibly you have been misled by reports based on Arctic region temperature estimates (the Arctic shows bigger swings than the average global temperature).
piotr @ 73:
I am not sure what your "not directly" statement refers to. I presume that the Martin Mlynczak quote is the one in comment 69. To put it simply, the thermosphere and the earth's surface respond to solar radiation in very different ways. You can read about the thermosphere on Wikipedia. Note that the thermosphere is at very high altitudes (>80km), and its temperature structure is the result of the absorption of UV radiation. It also has very low density, so even though average kinetic energy is high ("temperature") it does not hold a lot of heat. It is not strongly linked to the surface, which is heated by the absorption of solar radiation over the full spectrum.
This paper by Lean, Beer, and Bradley (1995) shows in figure 2 that variations in total solar irradiance are much less than for the UV range (in %).
To use the 4W/m2 drop in that figure, you need to first reduce it by a factor of 4 (area of a sphere vs. area of a circle), and then adjust for global albedo (0.3), giving an overall forcing of only about 0.7 W/m2. Sustained over only a period of about 50 years, this is not going to have a major cooling effect on its own.
You say that "it noticeabl[y]e cooled large parts of the no[r]thern hemisphere", which I presume is a claim with respect to surface temperature responding to these solar variations. You then throw in volcanic effects. You seem to grossly overestimate those solar effects, though - with no references to any supporting information. If you look at this SkS post, the first figure shows that reconstructed global temperatures for that period are much smaller than your claimed "decrease up to 1.5°C".
In your second paragraph, you start talking about "The past 10.000 years where up and downs in global mean temperature like +/- 2°C for dozen decades, even for nearly 2000 years - as we can reconstruct with little data-points." This starts to wander into the last glacial period, where Milankovitch cycles start to play a role. You are mixing together a lot of different forcing mechanisms, as if they are all equivalent in some fashion.
You then start into urban heat island effects, and finish off with a couple of paragraphs that represent an argument from incredulity. If you actually want to learn something about temperature reconstructions from proxies, Wikipedia has a decent article on this, too. The Wikipedia page also has a graph that shows even less variation in temperature than the one above:
The numbers you are throwing around in your "just imagine" scenarios seem to be ones that you have a lot of confidence in. The problem is that they also appear to disagree with broad swaths of the scientific literature. You appear to be claiming that science is unsure of what happened in the past - but you are. It seems highly unlikely that you are correct.
If you want to have any credibility here, you are going to have to provide references to the numbers you post. This is not a site where you will be permitted to post a lot of unsubstantiated opinion. As you are a new user here, I strongly suggest that you read the Comments Policy.