


 Arguments


Recent Comments
Prev 105 106 107 108 109 110 111 112 113 114 115 116 117 118 119 120 Next
Comments 5601 to 5650:
-
Jim Hunt at 07:00 AM on 6 May 2021Why scientists shouldn't heed calls to 'stay in our lane'
You are very kind Eclectic.
Anthony has indeed "outed" me again for the umpteenth time. It wasn't as though I was wearing a heavy disguise! No doubt it was mere coincidence that his scurrilous attack on my character occured shortly after I sent a missive to Willis including a link to some actual Arctic science? Which coincidentally never saw what passes for the light of day at WUWT.
At the risk of drifting off topic, if you're also interested in all things Arctic please see:
https://GreatWhiteCon.info/2021/05/month-in-review-arctic-science-edition/#Timmermans -
garyjenkins at 02:51 AM on 6 May 2021Welcome to Skeptical Science
Hi thanks for the great website and all the work behind it. I just have a simple question, inspired by the 4 Hiroshimas calculation. I'd like to complete the following sentence (or one like it) if possible: "The energy absorbed by the earth as a result of radiative forcing by the CO2 emitted when you boil a kettle of water is X times the energy used by kettle, spread over Y years."
My thought was that this would be easy to work out from the global TPES which seems to be about 6x10^21 J/annum and the forcing rate which seems to be about 8x10^21 J/annum, given that CO2 hangs around in the atmosphere for 30-50 years .... then I realized that I was playing with numbers I don't really know how to handle. I'd be eternally grateful if someone could advise me on the calculation and on whether the result might be easier to imagine than all those Hiroshimas.
-
Bob Loblaw at 01:57 AM on 6 May 2021Why scientists shouldn't heed calls to 'stay in our lane'
As the one that started teasing Jim about Twitter, it was his use of the word "informed" that caught my eye.
If he had said "I heard about it via Twitter..." then my sarcastic humour would not have been twigged... :-)
-
Eclectic at 23:31 PM on 5 May 2021Why scientists shouldn't heed calls to 'stay in our lane'
Jim Hunt @20 :
An amusingly ambiguous comment about the ephemera of Twitter !
And thanks for your good work at Great White Con .
And for your very recent amusing appearances at WUWT , regarding Professor Monckton's continual nonsenses on his "Pauses". I see that the good Anthony Scissorhands has now excised your comments. But, pleasingly, you have a several staunch companions who have not (yet) been banned there. (If it weren't for those few guys, the comments columns would be unmitigated dreck of anger & drivel.)
-
One Planet Only Forever at 23:16 PM on 5 May 2021Why scientists shouldn't heed calls to 'stay in our lane'
Jim Hunt,
Twitter is a lousy source for verified evidence-based information. Mind you so is media that is under the influence of the Propaganda Model of Communication.
As an Engineer I would dread the thought of any engineer considering that technical sounding stuff on Twitter is as valid as any other technical information.
Twitter is great for quickly disseminating fairly inconsequential information like sports scores or other entertainment information. It can be a source of verifiable information that can help build a verified better understanding of what is happening or has happened. But, tragically,it can more easily be abused to mislead and misinform. It, like other social media, is a perfect platform for disinformation because it can keep people from being exposed to the fuller story.
Some politicians have learned to turn politics into simplistic competition that can be won by harmful cheaters, like Sports. And they do it to Pump up Pride among Their Type of People. They can make Politics be like:
- Keeping people from understanding the harm they will do to Win, or how they cheat to Win (keeping people fascinated and engaged by grotesque engrossing distractions and other forms of hiding or masking the Truth - likely results of the Propaganda Model of Communication).
- Trash Talking Professional Wrestling (a tactic of the likes of Trump - Trump wasn't the first of this type and won't be the last)
- Gossip Rag Speculation-based Story-telling using selected bits of information, including made-up bits (also a tactic of the likes of Trump - Their Type are The Pure Best who Fight for their Deserved Glory and are Always Excusable. Others are: Less-worthy, Blame-worthy, Inexcusable - that loops back to the Pro-Wrestling style of Sport - those Trash Talking Gladiators, the Heroes of Their Type of People).
-
Jim Hunt at 21:37 PM on 5 May 2021Why scientists shouldn't heed calls to 'stay in our lane'
However Twitter is perhaps a good place to get the latest news before it's been "filtered" by the oligarch owned "mainstream media"?
-
One Planet Only Forever at 12:10 PM on 4 May 2021Skeptical Science New Research for Week #17, 2021
Oortcloud @1,
I hope this helps you better understand how to be less harmful and mnore helpful regarding CO2.
For the past 2000 years (likely 4000 years), up until the 1800s, the level of CO2 in the atmosphere was pretty steady at about 275 to 285 ppm.
And from the 1800s all the way back to 800,000 years ago the CO2 level varied from 180 ppm to 300 ppm until recently (and it only once reached 300 ppm about 300,000 years ago).
In about 1920 the CO2 level was up to 300 ppm. And by 1940 it was about 310 ppm (higher than any time since 800,000 years ago). And today the level is about 410 ppm and still climbing.
There are many references for this, including on SkS, but I like to refer to source data presentations like the NOAA Global Monitoring Laboratory animation.)
And the main reason for the rapid recent increase in CO2 is the burning of buried ancient hydrocarbons (fossil fuel). No other explanation explains it.
So now that you can understand what is really going on, if you had shared your previous misunderstanding anywhere, hopefully you will go back and correct what you incorrectly believed and shared. And hopefully in the future you will seek better understanding before sharing it, but admittedly everyone can always learn something new to be less harmful and more helpful.
-
Bob Loblaw at 02:01 AM on 4 May 2021Why scientists shouldn't heed calls to 'stay in our lane'
"I am informed via Twitter..."
Now there is a phrase you don't hear very often.... :-)
-
KR at 01:20 AM on 4 May 2021SkS Analogy 22 - Energy SeaSaw
Even a decade may not be enough. There needs to be sufficient time to see a trend appear over fluctuations with scientific significance (to reject the null hypothesis of no warming). That's on the order of 20-30 years given current trends.
Unless you are accounting for cyclical and spike variations like the see-saw so well described above - ENSO, solar cycle, volcanic aerosols, etc. See Foster and Rahmstorf 2011 for an example of that. If you do, significance can be detected in perhaps 10-15 years, although that leaves open quibbling about how those variations were dealt with.
-
Jim Hunt at 17:59 PM on 3 May 2021Why scientists shouldn't heed calls to 'stay in our lane'
I am informed via Twitter that a judge ordered the Guardian/MSN stories to be taken down in order to avoid influencing the jury of the recent "Shell Knew" trial here in the UK:
https://GreatWhiteCon.info/2021/04/stop-attempts-to-criminalise-nonviolent-climate-protest/#May-02
Via Extinction Rebellion:
https://extinctionrebellion.uk/2021/04/23/breaking-the-xr-activists-who-took-on-oil-giant-shell-and-won/
Six Extinction Rebellion activists have been acquitted in a landmark verdict at Southwark Crown Court this afternoon.The jury delivered its not guilty verdict for each defendant, despite Judge Perrins ruling that five of the six had no defence under the law.
The trial, for criminal damage to the Shell HQ building in London’s Waterloo in April 2019, which could have led to a maximum five year prison sentence and/or a £10k fine each, is XR’s second only case to be heard before a jury.
The verdict is being hailed as a major victory for climate campaigners everywhere facing increasing criminalisation.
No doubt the mainstream media across the planet will now plaster the climate scientists' "open letter" and XR's victory in court across their front pages?
-
nigelj at 08:14 AM on 3 May 2021Skeptical Science New Research for Week #17, 2021
Oortcloud @1, what you say is a strawman. Definition of a straw man from Oxford dictionary: "noun, an intentionally misrepresented proposition that is set up because it is easier to defeat than an opponent's real argument." The real argument is too much carbon dioxide in the atmosphere in a short time frame causes a climate change problem, not that we have to get rid of all carbon dioxide.
-
Philippe Chantreau at 00:33 AM on 3 May 2021We're heading into cooling
I am not holding my breath for evidence (been more than 24 hrs already and none surfaced). I am familiar with Potholer, he does have good moments. I got a kick of Real Climate summary of the state of climate bets, especially with the NoTricksZone people. I have challenged people on a couple of occasions for bets on the next decade temp rise and all I got was lame excuses...
-
Eclectic at 23:25 PM on 2 May 2021Human CO2 is a tiny % of CO2 emissions
MA Rodger @350 :
Quite so. There is also kind of disjointedness to the "laundry list". Almost as if someone were using a program to generate random denialist phrasings.
Or pehaps the list is a sort of Poe. Une blague.
-
Philippe Chantreau at 23:03 PM on 2 May 2021Skeptical Science New Research for Week #17, 2021
Oortcloud,
Nothing on this page can possibly fit the description "all carbon is terrible because it might end up as CO2."
-
MA Rodger at 22:29 PM on 2 May 2021Human CO2 is a tiny % of CO2 emissions
Eclectic @349,
I think what you call "quite a laundry list" presented by commenter lindzenfanone @348 is less a laundry list and more a nonsensical rant. (The commenter doesn't start well in my book with his chosen nom-de-clavier. For me Dicky Lindzen is today a proven liar who long-ago turned away from the scientific method.)
The rant begins effectively saying that there is no available ontological truth which of course will make all argument circular. This is followed by some silliness about naturally-emitted CO2 and anthropogenic-emitted CO2 requiring to act differently with AGW science. The non-correlation comment could be presented statistically if it were not so crazy and wrong, this followed by poorly presented statements that try (but fail badly) to set out reason to support a bold (and with the failure, unsupported) assertion that "IPCC's core theory is wrong!!"The links appended to the comment lead to a number of dubious published papers that don't bear scrutiny**, Berry (2019) 'Human CO2 Emissions Have Little Effect on Atmospheric CO2' (two links provided), Humlum et al (20130 'The phase relation between atmospheric carbon dioxide and global temperature', Koutsoyiannis & Kundzewicz (2020) 'Atmospheric Temperature and CO2: Hen-Or-Egg Causality?' and Harde (2019) 'What Humans Contribute to Atmospheric CO2: Comparison of Carbon Cycle Models with Observations' (**These 'usual suspects' have been publishing drivel like this for years. If these particular papers presented anything game-chnging for AGW, indeed anything at all new and worthy of some small consideration, then that 'something' is failing to appear either within the denialist world or in the real world.)
-
Oortcloud at 22:27 PM on 2 May 2021Skeptical Science New Research for Week #17, 2021
You guys have posted a lot of stupid shit but this time you're up to your waists in it. Now yo9u have that guy telling us that the scuientific understanding of carbon based life is wrong because it doesn't fit your AGW narrative. According to you all carbon is terrible because it might end up as CO2 which, according to you, is a pollutant.
How do you think plants incorporate carbon? By absorbing hamburgers?
Moderator Response:[BL] Rude insults snipped. If you can't even bother to be polite, your posts will be moderated.
General Warning
Thank you for taking the time to share with us. Skeptical Science is a user forum wherein the science of climate change can be discussed from the standpoint of the science itself. Ideology and politics get checked at the keyboard.
Please take the time to review the Comments Policy and ensure future comments are in full compliance with it. Thanks for your understanding and compliance in this matter.
-
Eclectic at 21:07 PM on 2 May 2021Human CO2 is a tiny % of CO2 emissions
Lindzenfanone @348 :
You have quite a laundry list there. Much of it is wrong, but I guess you don't really care about that ~ since you obviously haven't bothered to educate yourself about climate science.
My next guess is that you are making a giant leg-pull. (Only on something like WattsUpWithThat website could your "ideas" be taken seriously.)
But I do have a question: Why your "Lindzen" connection with climate? For more than 15 years, Prof Lindzen has been moving away from scientific thinking and has been making his religious beliefs an emotional basis for his (largely rhetorical) speeches.
-
lindzenfanone at 20:09 PM on 2 May 2021Human CO2 is a tiny % of CO2 emissions
Here’s why IPCC’s core theory is invalid.
All climate alarmism is based upon the United Nations Intergovernmental Panel on Climate Change (IPCC) invalid core theory of climate change: human CO2 emissions caused all the increase in atmospheric CO2 above 280 ppm and since 1750.
IPCC claims climate events provide “extensive evidence” that human emissions caused the events. But events cannot prove their cause.
IPCC assumes its own core theory is true to argue its core theory is true. This is invalid circular reasoning.
The IPCC says its core theory is “incontrovertible.” But the scientific method says evidence cannot prove a theory is true. Rather, only one error can prove a theory is false.
IPCC’s core theory says human and natural CO2 act differently, e.g., human CO2 sticks in the atmosphere while natural CO2 flows out of the atmosphere. This is impossible because all CO2 molecules are identical.
The correlation between annual human CO2 emissions and annual atmospheric CO2 increases is zero, which proves IPCC’s core theory is false.
Ice core data prove IPCC’s core theory is false.
Stomata leaf data prove IPCC’s core theory is false.
IPCC’s human CO2 cycle is not a scientific deduction. It is merely a replication of IPCC’s core theory.
IPCC’s human CO2 cycle is not compatible with IPCC’s natural CO2 cycle. This proves IPCC’s core theory is false.
In addition, preliminary data on the small 2020 reduction in atmospheric CO2 caused by the 2020 reduction of human emissions also proves IPCC’s core theory is false.http://www.sciencepublishinggroup.com/journal/paperinfo?journalid=298&doi=10.11648/j.ijaos.20190301.13
https://drive.google.com/drive/folders/1U5MmvldPsJC2euF4AIwE_XQmzwGktqEG?usp=sharing
Moderator Response:[DB] Making things up is unhelpful. Further, simply asserting something does not make it true. This is a science and evidence-based venue and substantive sources are required to support hyperbolic statements. Please adhere to the Comments Policy and refrain from sloganeering.
Sloganeering snipped.
-
Eclectic at 06:42 AM on 2 May 2021We're heading into cooling
ClimateBuddha @41 ,
your second-to-last sentence doesn't make much sense. Please be kind enough to correct whatever typo or jumbled thought produced your error.
PhilippeC @42 ,
it will be most interesting to see what (if any) evidence our friend ClimateBuddha can come up with. Unfortunately for denialists & pseudo-skeptics, their cherry tree has few (if any) cherries left that they can pick.
Philippe, you may be amused to go outside the scientific papers, and visit the Youtuber world ~ where 10 months ago, the science journalist Potholer54 produced a 5-minute video listing more than a dozen failed Global Cooling predictions. These failed cooling predictions were made in the last 20 years (since 2001) by various scientists and wannabe-scientists. [video title: A short chronology of failed 'ice age' predictions]
No, not the failed Global Cooling predictions of last century. Just some of the failures of this century. As always, Potholer54 puts a humorous touch on things.
-
Philippe Chantreau at 04:08 AM on 2 May 2021We're heading into cooling
Climate Buddha, you should be more specific and provide evidence.
Antarctic land based ice has been shown to decrease by multiple studies, threads devoted to this subject can be found on this site. Antarctic sea ice has a lot of variability and, unlike Arctic sea ice, shows only modest trends that are dwarfed by the error bars: For April extent +1.4% per decade +-2.6%, which does not allow to rule out negative trend. In contrast the April Arctic trend is -2.6%/decade +-0.5%: All months in the. Arctic show statistically significant negative trends.
https://nsidc.org/data/seaice_index/compare_trends
For global temperatures Gisstemp, HadCrut anb other sources all converge toward an upward trend of 0.18 deg C/decade, even 0.2 in more recent times. Can you present the evidence you alluded to?
-
ClimateBuddha at 01:47 AM on 2 May 2021We're heading into cooling
This site is like Jehovah's Witness.
cherry picking bits of information and claiming that it is sceptics who do.
There is alarming amounts of growing evidence which show a downward trend in overall global temperature, coupled with cast amounts of 'unexplained' Antarctic ice increasing.
yet the singled out comments of scientists who have stated this type of evidence is used as rebuttal.
Give your head a good shake ffs
Moderator Response:[BL] Please make a bit of effort to avoid inflammatory accusations. Opening and closing your comment this way does not put you in a good light.
As others have pointed out, you have made specific claims with zero evidence. If you have such evidence, please provide it, or stop making such claims. This is not a site where empty proclamations carry any weight.
-
Jim Hunt at 19:58 PM on 1 May 2021Why scientists shouldn't heed calls to 'stay in our lane'
Hi 1Planet,
See my recent announcement just above for some "Shock News!!".
I cannot help but agree with you that the "Propaganda Model of Communication" is going full steam ahead at the moment, in the run up to the G7 Summit and then COP 26 here in the once United Kingdom. By way of example please see:
https://GreatWhiteCon.info/2021/04/allegedly-unsettled-science-by-steven-koonin-et-al/ -
Jim Hunt at 19:27 PM on 1 May 2021Why scientists shouldn't heed calls to 'stay in our lane'
No less a celebrity than Greta Thunberg has announced that the "redacted" article in The Guardian referred to upthread has now reappeared:
https://GreatWhiteCon.info/2021/04/stop-attempts-to-criminalise-nonviolent-climate-protest/#May-01
However no explanation has been forthcoming as yet for these strange comings and goings, as far as I have been able to ascertain. -
michael sweet at 22:13 PM on 30 April 2021Is Nuclear Energy the Answer?
John ONeill,
The terrapower plant storage may be useful for short time use but for seasonal storage it will not supply anything.
Fortunately, we do not need to rely on your personel observations to determine whether nuclear plants or renewable energy lead to lower carbon emissions. This study: Differences in carbon emissions reduction
between countries pursuing renewable electricity
versus nuclear power Sovacool et al 2020 studied just that. The complete abstract states:"Two of the most widely emphasized contenders for carbon emissions reduction in the electricity sector are nuclear power and
renewable energy. While scenarios regularly question the potential impacts of adoption of various technology mixes in the
future, it is less clear which technology has been associated with greater historical emission reductions. Here, we use multiple
regression analyses on global datasets of national carbon emissions and renewable and nuclear electricity production across
123 countries over 25 years to examine systematically patterns in how countries variously using nuclear power and renewables contrastingly show higher or lower carbon emissions. We find that larger-scale national nuclear attachments do not tend
to associate with significantly lower carbon emissions while renewables do. We also find a negative association between the
scales of national nuclear and renewables attachments. This suggests nuclear and renewables attachments tend to crowd each
other out" my emphasisCountries that build nuclear as a group do not reduce carbon emissions. Countries that build out renewables do.
You look at France, Sweden and Ontario, Canada. Engineer Poet on Real Climate also likes those two countries and that state. Perhaps looking at Uruguay 100% renewable mostly wind.
North east Brazil 95% renewable, mostly wind. And
Bornholm, Denmark 100% renewable, no hydro.
These examples are from your source. All have renewable energy systems. You are just not looking. It appears your claim at 236 that "I obsessively scan for examples of it" is false. It took me less than 5 minutes to find these examples. I note that your links all say "wind=false and solar=false". Perhaps you are using the incorrect search terms.
Sweden closed 2 of their 8 remaining nuclear reactors in the last 18 months. During 2020 their remaining reactors only ran 60% of the time. They are rapidly bulding out wind and have no plans to build more nuclear. The nuclear plants cannot compete on the local grid with hydro and wind. Although they do not currently have plans to shut down the nuclear plants (they spent a lot of money refurbishing them 5-10 years ago), the handwriting is on the wall that when planned new wind is installed there will be no economic way to use the nuclear plants. Hydro will provide more than enough backup when the wind does not blow.
France is planning to shutter 14 nuclear plants in the near future (they also closed two last year) and install renewables. Ontario's nuclear plants are old and they are installing wind.
I noticed you forgot links to descriptions to the Russian nuclear reactors. According to Wikipedia, the BN600 has had 27 sodium leaks resullting in 14 fires. As much as 1000 kilos of sodium leaked. Apparently, in recent years they have leaks under control. Construction for the BN800 was started in 1983 and completed in 2016. source The BN 600 runs only 70% of the time because of required maintenance. Both reactors have three complicated triple part cooling systems to isolate the radioactive sodium coolant from water since sodium is flammable in water. These reactors cost even more to build than normal reactors. They will never be economic. No more are planned worldwide.
Renewables have only been the cheapest energy for a few years. Comparing directly to nuclear, a 60 year old, mature technology, is stupid. After 60 years nuclear generates less than 5% of world energy. Little is being built. In 2020 more than 80% of new electrical capacity added world wide was renewable. Because renewables are now cheapest, they are the most installed. For much of the non-renewable energy installed in 2020, construction was started when renewables were more expensive. In the future renewables will dominate all new construction.
-
John ONeill at 16:04 PM on 30 April 2021Is Nuclear Energy the Answer?
'The storage of the Terrapower reactor would only raise output less than 50% for 5 1/2 hours.'
That would be adequate for demand cycles on most grids, where peak power, as a rule, is on the order of 50% higher than base. Remember, it's going from ~ 60% to 150% - at night much of the heat production goes to storage. Solar thermal storage has pioneered the technology, but has nowhere near the capacity factor -even in deserts, in summer - to match the reliability of nuclear.
The BN600 and BN800 in Russia seem to be operating without any leaks or fires - unlike some of the new grid storage battery plants, which, although nowhere near the gigawatt-day scale, or the price point, to be able to power a country through a cloudy, windless spell, are claimed to be ready to rescue part-time power sources from their role as sidekicks to the fossil industry.www.spglobal.com/marketintelligence/en/news-insights/latest-news-headlines/burning-concern-energy-storage-industry-battles-battery-fires-51900636
'If we really try to build out wind and solar there will be a substantial decrease in carbon emissions in a short period of time.' That's something I haven't seen, though I rather obsessively scan www.electricitymap.org/zone/JP-KY?wind=false&solar=false for examples of it. Today, for the first time I've seen, Kyushu got well below 100 grams CO2 per kilowatt hour - but only briefly, at midday. For most of the 24 hours, it was three or four times as much. Areas that have invested mostly in nuclear - or hydro, when available - are routinely well below that mark, 24/7.
www.electricitymap.org/zone/CA-ON?wind=false&solar=false
www.electricitymap.org/zone/FR?wind=false&solar=false
www.electricitymap.org/zone/SE?wind=false&solar=false
( I'd have added Switzerland, but lately they've gone above the 100g/kwh mark most of the time. I'm not sure if it's because they've been closing reactors, or because, like here in New Zealand, they're having a dry hydro year. Either way, it's not a good augury for the country's goal of nuclear free, zero carbon, by 2050. Part of it could also be that they're importing a lot of power from Germany, which dirties their average.)
-
BaerbelW at 23:38 PM on 29 April 2021Welcome to Skeptical Science
I just now updated our Welcome Page to include the interactive version of "The Story of Skeptical Science" created for the 2020 Fall Meeting of the American Geophysical Union. Enjoy!
-
Dale H at 09:54 AM on 29 April 20212021 SkS Weekly Climate Change & Global Warming News Roundup #17
Moderator
Thank you for the information. I have read the attached and the climate sceptics link explaining the information and alot of the comments and will look through the rest. It is a big help as well I will follow all the links.
Bob Loblaw @9, Doug Bostrom @10 & scaddenp @11
Thanks for reading my ideas and thank you for your time on responding. First I apologize on modelling comment as it was the wrong wording for what I was trying to explain and yes it is about statistical models not physics models. I will study all of the links and information to learn more. As you can tell I am also not a statistician but have used large amounts of data/statistical models to help change the behavior of people in all of the studies delivered which is difficult because people naturally resist change because of the risk involved and sometimes their own agendas so alot start out as deniers.
My point was we could strengthen our arguement by looking closely at the period when it was higher with all the different forcings and tie it back to the current increases to strengthen the predictions which I haven't seen done that often at least to the public level. In a simple sense it gets to us as the model said so without explaining the different pieces. Once again I come back to the premise that all of you have thought of these things and are not getting near the credit for all of your brillance and hard word.
I think we have convinced all of the scientists and now maybe broaden the approach with a full view aimed at a larger audience. As with everything else I mentioned you have probably done this already. I was just trying to understand the bigger picture and offer any help on understanding then educating and selling the ideas.
Thanks again as I have already learned alot in the last week.
-
One Planet Only Forever at 09:19 AM on 29 April 2021Why scientists shouldn't heed calls to 'stay in our lane'
Jim Hunt,
My suspicion is that influential interests are doing whatever they can get away with to influence what gets presented to the general public. And there is likely a lot that they can get away with.
In addition to the Propaganda Model of Communication presented in Manufacturing Consent that I referred to in my comment at 10, more recent books on the topic indicate that systemic propaganda influence of powerful interests is Still Going Strong. "Propaganda in the Information Age" by Alan MacLeod is a 2019 update of the original that investigates how social media is functioning. And Matt Taibbi's "Hate Inc." includes his personal experience of the Propaganda Model in action in journalism.
-
scaddenp at 07:31 AM on 29 April 20212021 SkS Weekly Climate Change & Global Warming News Roundup #17
I agree with Bob - Dale H appears to be confusing physical models with statistical models. Flying a drone on Mars shows you what physics modelling can achieve.
A good introduction to nature of climate model is here. There is also an old discussion here which explores some of the differences between climate models and other kinds of numerical models.
Finally, (putting on a moderators hat), discussions about reliability of climate models should be placed here.
-
Jim Hunt at 19:49 PM on 28 April 2021Why scientists shouldn't heed calls to 'stay in our lane'
Thanks again 1Planet,
I don't usually frequent Reddit. Why do you suppose that the few references to the "open letter" that do get published in the MSM all seem to be "scrubbed" shortly thereafter? -
Doug Bostrom at 11:38 AM on 28 April 20212021 SkS Weekly Climate Change & Global Warming News Roundup #17
A little further to Bob's point, try visiting scholar.google.com and entering "constraining climate models" (in quotes). That's a primitive search term but will produce a result helpful for understanding the phenomenal effort devoted to keeping models in the paddock labeled "realistic."
Models are kept on a tight leash and are not free to run away in imagination.
-
Bob Loblaw at 10:57 AM on 28 April 20212021 SkS Weekly Climate Change & Global Warming News Roundup #17
Dale H:
You said "As you all know in modelling you can predict outside the current data but the model error will go up as leave the data set."
Although what you say is very common in statistical fits to data (interpolate, don't extrapolate), it is much less common in models that are based on physics. Climate models have some statistical derivations for small-scale phenomena, but the bulk of the calculations are based on well-defined physical relationships and include things like conservation of energy that controls long-term behaviour. They are much less likely to show extrapolation errors.
-
Dale H at 09:38 AM on 28 April 20212021 SkS Weekly Climate Change & Global Warming News Roundup #17
Eclectic
Thank you for the information above as it was all new to me as my investigation into climate change has mainly been from 1880 to the present with a little bit around the little ice age plus the higher sea levels 1000 to 1250 AD.
I am sorry about breaking policy guidelines as it wasn't my intent and will adjust my questions. It was just one question lead to another and I didn't see threads with graphs about CO2 and temperature levels in the dinosaur age on the website as I had noticed were higher on google but wanted good data. I also started here because on the newbie page I mainly saw people complaining about deniers and was hoping for some colaboration to help point me to which projects have a greater acceptance.
As mentioned I have delivered over 1000 projects and workshops in the food business on 4 continents and we always let the facts and models find as close to truth for us and then model out multiple scenarios to help achieve results on their goals and what they can afford. The data has no room for denial but people don't like change so their starting point on most things is denial and we use facts and to help and outcomes to help change them. There is some advantage that the Food business isn't political but there is always different agendas in corporations etc.. on having the results that would benefit them. I found it surprising at the amount of politics on the website which will immediately get the opposing parties backs up and stop the exchange of ideas. I truely believe there is alot more hard work and wisdom in the area that isn't getting out to the public probably on the 5 to 10 fold scale. On deniers one of the reasons I honestly looked at the area at first is I was hearing outrageous claims of what was going to happen. I said maybe but would have to look at as much of the raw data and model outputs myself. Once I looked into it I could see some classic cherry picking the time period, changing the scale etc.. which would give misintented results that is easy for deniers to poke holes in the conclusion and once you lose credibility on the data set it is difficult to get back. I also saw that if you looked at the whole dataset the trend and results show the same result of an increase but maybe on a slightly longer timeframe and was a missed opportunity on changing deniers opinion in some cases. For myself it led to realize that we are affecting climate and I had to tease out the last few questions I had to see any natural increase. (sea level going up before the industrial revolution, why the slow down in the 30's & 40's and a few other things).
I do think you are selling yourselves a little short and have an opportunity to point out that we have over powered the latest decrease in solar irradiance and sunspot decrease and the temperature is still rising as further proof.
My hope was to learn more and possibily collaborate on the full picture to help in anyway I could. As you all know in modelling you can predict outside the current data but the model error will go up as leave the data set. My thinking was as we leave the most recent area were CO2 has been the last few million years why not try to learn as much as we can in the dinosaur period when temperatures and CO2 were hotter to help our knowledge and what we are up against. In addition, as you know match your presentations to your audience varying details/complexity to some groups and the big picture with simple reasonable outcomes with executives.
I will continue to go through the site to look for knowlege on the areas mentioned for question to stay within policy. If you have any good datasets and hypothesis it would be appreciated. Since this may not to policy and not to bore everyone on the site please contact me dale.hansson@verizon.net and I would love to learn and help in anyway.
Dale
Moderator Response:[DB] For a discussion of previous climates with high levels of CO2, see this post:
https://skepticalscience.com/co2-higher-in-past-intermediate.htm
Over the Earth's history, there are times where atmospheric CO2 is higher than current levels. The planet experienced widespread regions of glaciation during some of those periods. Does this contradict the warming effect of CO2? No, for one simple reason. CO2 is not the only driver of climate. To understand past climate, we need to include other forcings that drive climate.
http://www.sciencedirect.com/science/article/pii/S0016703706001979
http://droyer.web.wesleyan.edu/PhanCO2(GCA).pdf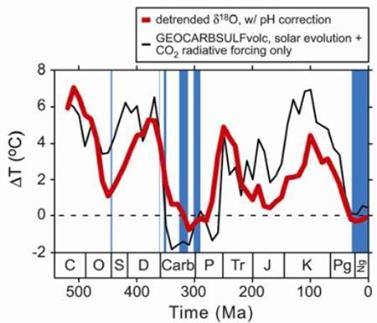
Atmospheric CO2 levels have reached extremely high values in the deep past, possibly topping over 5000 ppm in the late Ordovician around 440 million years ago. However, solar activity also falls as you go further back. In the early Phanerozoic, solar output was about 4% less than current levels.
If climate scientists were claiming CO2 was the only driver of climate, then high CO2 during glacial periods would be problematic. But any climate scientist will tell you CO2 is not the only driver of climate. Climatologist Dana Royer says it best:
"the geologic record contains a treasure trove of 'alternative Earths' that allow scientists to study how the various components of the Earth system respond to a range of climatic forcings."
https://link.springer.com/chapter/10.1007/978-94-010-9633-1_4
https://link.springer.com/article/10.1007/BF00151270Past periods of higher CO2 do not contradict the notion that CO2 warms global temperatures. On the contrary, they confirm the close coupling between CO2 and climate. When CO2 levels were higher in the past, solar levels were also lower. The combined effect of sun and CO2 matches well with climate.
-
Philippe Chantreau at 01:03 AM on 28 April 2021Skeptical about a defense of science?
Nice analysis DB. Mr Lucas' hypocrisy is, unfortunately, more the rule than the exception these days.
-
Evan at 22:45 PM on 27 April 2021SkS Analogy 22 - Energy SeaSaw
Thanks for the suggestion. I updated the post to include your suggested revisions.
-
Eclectic at 21:29 PM on 27 April 20212021 SkS Weekly Climate Change & Global Warming News Roundup #17
Dale H @6 ,
a somewhat brief overview from me as a non-expert :-
The atmospheric CO2 level was very high "from the start", in the sense of Pre-Cambrian times. Fortuitously, the early Sun was significantly lower in output (insolation has been increasing by 1% per 120 million years approx.)
In the long run up to now, exposed rock has very slowly absorbed CO2 by "weathering" to form carbonate which ends up on the ocean floor (and/or subducted by tectonic movement). And part of these carbonates is recycled into the atmosphere by volcanic venting.
The rate of weathering has varied at times. Also, there was a large "plunge" in CO2 level during the fossil-carbon formation in the Carboniferous age (much plant life, and no large herbivores?). A separate plunge during the Ordovician age (somewhat unclear, owing to uncertainty from poor time-resolution). And some major spikes in CO2 (and temperature) owing to Large Igneous Province eruptions such as the Siberian Traps and the Deccan Traps events.
Overall, it's been quite a ride !
The present latitudinal positions of the continents (plus Antarctica at polar position) has predisposed to glacial times for our planet. And likewise, the current "low" CO2. And if I have gathered correctly ~ in about an estimated 15 million years' time, the CO2 level would have become low enough to embarrass the present species of plants (unless they suitably evolve their photosynthetic mechanisms). Obviously the 15 million year time-scale gives the human race considerable leeway in tackling that particular problem.
Dale H , my apologies if you were already aware of much of this broad background. The SkS website has a vast amount of detail available for your self-directed searching.
As you have said you have already spent a goodly amount of time researching climate matters, then it might be advantageously efficient if you gave specific indication of where you feel puzzled or where you feel the mainstream climate scientists might be wrong.
If you need to raise particular questions, then it is standard SkS policy that you place one or two questions in the most appropriate thread . . . and deal with those questions . . . and then progress to the next question you have in mind.
-
Dale H at 15:01 PM on 27 April 20212021 SkS Weekly Climate Change & Global Warming News Roundup #17
RH, Ecelctic, MA Rodger
Thank you for the help on where to look for the best articles on the changes in temperature and causes for the last 2 million years. I have read them a few times as well as other articles on the Milanovitch cycles. I am still digesting all of the learning and supporting documents but it gives me a good start on the earth's movement on climate plus some of the other factors that drive change and will have more questions soon.
It was also very impressive on all of the hard work and thought that has gone into this area and very much appreciate you spending time to help me sort through the numerous studies. As mentioned I have worked in the data and modelling field for 30+ years helping people understand what drives their business and love looking at facts and ideas. You both mention the declining CO2 levels which would lead me to my next question.
Do we have data or hypothesis on temperature and CO2 levels back to the dinosaur timeframe and how the CO2 levels became so high. Also on temperature do we have mid latitude increases because most of the people live in this area?
As mentioned I appreciate any of your wisdom you can share and if anyone else has any articles or ideas in the precurrent timeframe that they believe would be of interest please let me know.
RH I still haven't mastered the pasting of the image to fit into the webpage. Is there somewhere I could learn more about it?
Moderator Response:[BL] You cannot insert images directly into comments here.
On the screen for writing comments, you can use the insert/edit image icon (on the Insert tab), to create a link to an image that is located on another publicly visible web page. The Skeptical Science web page will then display that image as part of your comment, but it has to remain accessible on that external web page. This web page does not copy it.
-
One Planet Only Forever at 14:55 PM on 27 April 2021SkS Analogy 22 - Energy SeaSaw
Nice presentation. There are many possible examples but the sea-saw idea should be familiar to most people.
I just have one minor concern and suggestion.
The following statement at the end of the opening para under the Climate Science sub-heading could be misunderstood to mean that we need to wait until 2030 to see if the warming trend is continuing.
"To estimate the magnitude of global warming typically requires looking at atmospheric temperature trends from one decade to the next."
It may be clarified by ending it "... looking at temperature trends from one decade to the next, of by looking at the change of a 10 year moving average, or longer, as each new data point, typically each month, is obtained."
The SkS Temperature Trend Calculator can be used to see how this works. The default "Moving Average" is 12 months. For any chosen Start and End Date the appearance of the red line for the 12 month moving average can be compared to the appearance of the 120 month (10 year) or longer moving average.
There is no need to wait for the next decade to be completed to see what happened with the temperature trend.
-
MA Rodger at 17:49 PM on 26 April 20212021 SkS Weekly Climate Change & Global Warming News Roundup #17
Dale H @3,
Further to #3, the declining CO2 levels over the last few ten-of-million years are usually put down to errision following the Himilayan mountain-building. The Antarctic ice appeared about 35Mya on the cooling planet. On a shorter time-scale, the shutting-off of the oceans between N & S America 3 Mya ago resulted in the appearance of the Arctic ice which has been fuelling ice ages ever since.
The frequency of these ice ages swapped from 40,000yr to 100,000yr roughly 1 Mybp (so your 1.2Mya @1). A mechanism for this transition is not entirely nailed down quite yet (eg see Chalk et al 2017 or Willeit et al 2019). However the usual suspect is the level of dust from exposed land during glacial cycles and its reduction of the ice albedo. So when the lands of northern lattitudes have been scoured clean back to the bedrock, the dust is greatly reduced and thus the albedo of the less-dusty ice caps does not decline so much during high glaciation, allowing ice a longer period before destablising into an interglacial.
-
Eclectic at 14:08 PM on 26 April 20212021 SkS Weekly Climate Change & Global Warming News Roundup #17
Dale H @3 ,
it is interesting how (allowing for other input factors) the planetary temperature has broadly declined as the atmospheric CO2 level has declined. [As might be expected from basic physical principles.]
And it appears that a threshold was reached, about a million years ago, when the underlying regular Milankovitch cycle effects have become very prominent.
The (arguable) stability you mention, may arise from the time-compression appearance of the graph.
-
Dale H at 10:34 AM on 26 April 20212021 SkS Weekly Climate Change & Global Warming News Roundup #17
Doug
Thanks for getting back to me so quickly. It was a number of graphs which included on Wikipedia Geological Temperature record article - chart Temperature of Planet Earth link below.
On the chart it shows the earths temperature alot warmer for over 250 million years and continuing to drop until say 1.2 to 2 million years it appears more stable. What do we think has caused this, earths orbit, sun strength etc..? Also for the record I have heavily studied all the recent data and believe humans have caused at least some of the warming if not most.
 Moderator Response:
[RH] Inserted image from link. You can do this yourself through the edit menu. Just click the "insert" tab, then the tree image icon, and insert the link there. Be sure to limit the image width to 550px.
-
Doug Bostrom at 06:20 AM on 26 April 20212021 SkS Weekly Climate Change & Global Warming News Roundup #17
Dale, we'll need a little more to work with, to help answer your question.
If you could point us to the source of your query, we could narrow down the nature of the matter. Was this "new phase" and the time threshold of 1.2 million years ago something you read about, and if so where?
-
Dale H at 05:43 AM on 26 April 20212021 SkS Weekly Climate Change & Global Warming News Roundup #17
I am new to the site but have followed climate change as a hobby for over 15 years. For the record I am not a climate denier and have seen data debunking most of the climate myths listed. I am trying to learn more through facts or strong hypothesis as I have spent the last 30+ years working in the food industry convincing Directors to Presidents with data and models on what is driving their businesses.
My question is there any information that has caused the change in earths temperatures about 1.2 million years ago? We seemed to have been cooling off and then entered a new phase. Is it the sun's orbit?
-
One Planet Only Forever at 08:47 AM on 25 April 2021Why scientists shouldn't heed calls to 'stay in our lane'
Jim Hunt,
Though I do not recall seeing a CBC item about this the CBC News website Search finds one "World - CBC News" item containing the full title of the Guardian article ... but there is nothing there now other than the Search identifying that 1 item, likely scrubbed, was found.
And searches on a few other Canadian media sites do not find anything, which may mean that many Canadian News sites did not publish anything regarding the "Open Letter: Stop attempts to criminalise nonviolent climate protest."
-
One Planet Only Forever at 08:16 AM on 25 April 2021Why scientists shouldn't heed calls to 'stay in our lane'
Jim Hunt,
Unfortunately it appears that "mentions" of the letter you are referring to have been very effectively acted on by the Harmfully Powerful Interests controlling Propaganda for their maximum benefit.
The only mention of it I can find is This Reddit item which includes a link to an archive copy.
-
Jim Hunt at 07:12 AM on 25 April 2021Why scientists shouldn't heed calls to 'stay in our lane'
Thanks for that information 1Planet,
Have you seen any media comment in Canada, whether from the CBC, other mainstream media or even a humble blog, about the >400 signatures of climate scientists on the open letter that you can no longer read all about in The Guardian or MSN?
The list includes such world famous names as Michael Mann and Stefan Rahmstorf. -
One Planet Only Forever at 01:25 AM on 25 April 2021Why scientists shouldn't heed calls to 'stay in our lane'
Jim Hunt,
Regarding criminalizing Climate Change Protests:
In Alberta, the first Bill that the newly formed United Conservative Party implemented after they won Majority Power in 2019 was Bill 1: CRITICAL INFRASTRUCTURE DEFENCE ACT.
The nastiness of the Bill - particularly the way it made it illegal for any protest to be held on any public surface that people may travel along, potentially applied to sidewalks and pathways in parks - has been publicly protested against, commented on in the media, and written about by people at Universities:
- CBC News Item "Rally at Alberta Legislature to protest passing of controversial Bill 1"
- University of Calgary Faculty of Law - ABlawg.ca items
And there is more harm being done than the efforts to "Criminalize" efforts to raise awareness and improve understanding of the harm of pursuing benefits from fossil fuel use.
The UCP also set up an investigation to find proof of foreign money creating misleading propaganda against Alberta pursuits of profit from fossil fuel activity - well presented in Wikipedia's "Public Inquiry into Anti-Alberta Energy Campaigns"
The ability of powerful wealthy people to "get the claims they like" to be more aggressively and more profusely publicly presented has been a scourge to the development of increased public awareness and improved understanding of what is harmful and how to helpfully limit and correct for the harm being done by selfish people competing for Perceptions of Superiority in games based on popularity and profit.
The Manufacturing Consent problem (also well summarized by Wikipedia), is alive and well today, with new mechanisms being grown by the harmfully selfish trying to protect their Undeserved Status, Status they got any way they could get away with and that they will defend any way they can get away with.
-
Jim Hunt at 19:42 PM on 24 April 2021Why scientists shouldn't heed calls to 'stay in our lane'
Further to #2 above, MSN published a clone of part of the Guardian article mentioned, which has now "disappeared" as well:
https://GreatWhiteCon.info/2021/04/stop-attempts-to-criminalise-nonviolent-climate-protest/#Apr-24
Fortunately in all the circumstances archived copies of both articles have been made. -
michael sweet at 07:16 AM on 24 April 2021It hasn't warmed since 1998
Vonyisz,
The answer to your question "what we know about changes in energy across the ocean today?". The ARGO floats measure most of the ocean to a depth of 2,000 meters. This part of the ocean is pretty well known. The areas under sea ice are harder to measure but not that extensive (and they are measured to some extent). Deeper than 2,000 meters is hard because there are not many old measurements. Fortunately, the change in temperature is small, hundredths to thousandths of a degree.
This article gives information on ocean temperatures to a depth of 4757 meters near Argentina. They were using equipment designed to measure currents and realized that they had sensitive temperature measurements also. Apparently these current measurements are done in many locations and scientists will use them to determine deep ocean changes for the past 10-15 years. These detailed measurements can be used to calibrate other older records.
The bottom line is that the deep ocean has not changed very much yet. Because it is so hard to measure the changes are not well characterized. Recent data will start to track deep ocean changes. Because the changes are small they do not affect the big picture of AGW.
A lot is known about ocean flow also. This article details changes in large eddies. Other currents are monitored regularly. Scientists often report that they are surprised by how fast everything is changing. They are optimistic at first.
-
MA Rodger at 16:48 PM on 23 April 2021It hasn't warmed since 1998
Vonyisz @412,
The use of energy fluxes and energy anomalies to account for AGW is the useful approach. Mind the global surface temperature that results remains the main measure of the problem. You subsequently argue that there are other measures of importance (eg wind, humidity) but these effectively all lead on from temperature, as does the poleward energy fluxes (which will increase under AGW thus and this result in the boosted temperature rises seen in Arctic Amplification).On the issue of PE. Yes the simplistic PE=mgh is correct (although it gets a little more complex when applied to a spinning planet). But from this point you entirely fail (and will fail) to present any significant increase in PE resulting from AGW. If the oceans were to warm by a single degree Celsius, the energy required to provide that temperature increase will be hundreds of times (using a very gererous Coefft of Thermal Expansion, 350-times) greater than the PE increase due to thermal expansion of the oceans. Similarly, the energy of Latent Heat required to evaporate a kg of water to add to the atmospheric mass would equal the PE required to raise such a mass 230km.
In general, such small factors involving PE are quite ignorable.
Prev 105 106 107 108 109 110 111 112 113 114 115 116 117 118 119 120 Next


