


 Arguments


Recent Comments
Prev 1158 1159 1160 1161 1162 1163 1164 1165 1166 1167 1168 1169 1170 1171 1172 1173 Next
Comments 58251 to 58300:
-
sol6966 at 00:24 AM on 8 July 2012Roy's Risky Regression
Rob Painting @ 13 Thanks for your comment. Why would carbon from volcanic activity be less depleted of c14 than fossil fuel carbon? -
jimnaylor at 22:59 PM on 7 July 2012Nil Illegitimi Carborundum
Jim Naylor, USA -
Tom Curtis at 22:33 PM on 7 July 2012Murry Salby's Correlation Conundrum
oarabin @20: Let Un(t+1)= En(t)+3.5*Ea; Let En(t+1)=En(t)+3*Ea This satisfies the conditions of the argument that you describe. However, even in this case atmospheric CO2 concentrations would decrease if it where not for anthropogenic emissions. Ergo, this argument as framed does not rebut mass balance argument. However, if we introduce the factor that the increase in Un is caused by Ea, then absent the increase in En, anthropogenic emissions would indirectly cause a reduction of atmospheric CO2. Alternatively, and more probably, increase in C' causes an increase in Un which drives C' towards an equilibrium value. A sufficiently large and rapid response in Un could have restricted C' to an increase one years anthropogenic emissions. In this case (only), a concurrent and coincidental rapid increase in En could be the cause of the increase in atmospheric CO2. However, an increase in concentration from natural sources would drive an increase Un as well. Therefore the increase in En must be orders of magnitude larger than the increase in En to overwhelm the tendency to return to equilibrium. As antrhopogenic emissions are 100 times larger than natural emissions (excluding equilibrium exchanges), that means the rate of increase of natural emissions must be many orders of magnitude larger than their initial (and measured) rates. In other words, the mass balance argument is an inductive argument (its conclusion could be false with true premises); but the probability of its leading to a false conclusion is very remote. What is more, if it where invalid the consequences would be immediately obvious as noted by Marco. Quite apart from that, as has been pointed out other measurements have also confirmed the mass balance argument. -
bill4344 at 19:57 PM on 7 July 2012Roy's Risky Regression
Alexandre @ 2. Further to Dana's reply, the connoisseur of 'how far will they' go may also enjoy Tim Curtin's '[CO2 and H2O] do not [trap heat] because they cannot, given the 2nd Law. Remember that photons are largely a fiction as they have no mass.' Well, that would also explain how they've escaped the Higgs Boson! Here, (comments page 6), June 23, 12.42pm (post NG's takeover ScienceBlogs no longer features permalinks, sadly.) -
CBDunkerson at 19:49 PM on 7 July 2012Murry Salby's Correlation Conundrum
Oarobin & Marco, it really does not matter whether natural emissions and/or uptake are changing over time. That has no impact on the mass balance argument. We know that the rate at which humans are releasing fossil fuel carbon into the atmosphere is GREATER than the rate that carbon is accumulating in the atmosphere. Pick a year for the past few decades... there is sufficient data to calculate both of those values and show that human emissions have consistently exceeded atmospheric accumulations. Ergo, we also know that for that time period natural carbon sequestration has exceeded natural carbon emission and the atmospheric increase has been due to human emissions. Could the accumulation of human emissions in the atmosphere be causing the natural absorption and emission values to change? Absolutely. In fact, they definitely are changing. That just doesn't impact the mass balance argument at all. If the mass of human emissions is greater than the mass of atmospheric accumulation then human emissions ARE responsible for the atmospheric accumulation. The only options for 'defeating' the mass balance argument are; 1 - Disprove (or deny) the data showing that humans have been emitting CO2 at a greater rate than the atmosphere has been accumulating it for decades. 2 - Invalidate the law of conservation of mass. 3 - Introduce a new variable... e.g. carbon emissions from aliens. -
Marco at 19:14 PM on 7 July 2012Murry Salby's Correlation Conundrum
Rob and oarobin - in principle it is possible that one natural source has increased its emissions, whereas another has increased its uptake. For example, it is possible that the oceans are a net emitter with this net emission being larger than the anthropogenic emissions. However, that requires an ENORMOUS net uptake from another source, such as the biosphere. We know, however, that this is not plausible: the biosphere would have had to take up hundreds of gigatons of CO2 in the last decade alone. Moreover, we should not have seen a decrease in ocean pH in that case. But how about the reverse situation? That is, the biosphere being the net emitter, larger than that of the anthropogenic emissions? It is possible that the oceans take up this much CO2. However, the biosphere would have had to decrease with several hundreds of gigatons of CO2 in the last decade alone. This should have been directly visible. Now, imagine that this net loss must have been sustained over several decades (at the very, very least since 1959): we must have observed such an enormous decrease in the biosphere (hundreds of gigatons of C, thousands of gigatons of CO2). -
Rob Painting at 18:48 PM on 7 July 2012Roy's Risky Regression
Sol - the 3 carbon isotope ratios tell us that the increase in atmospheric CO2 is due to fossil fuel emissions. Carbon 14 forms in the upper atmosphere due to bombardment by cosmic rays (high energy particles from distant, but powerful, stars). This isotope is radioactive so it emits and loses energy over time. Its half-life is about 6000 years. Fossil fuels are depleted in Carbon 14 because they formed over hundreds of millions of years underground. Burn fossil fuels and we should see a decline in the ratio of Carbon 14 in the atmosphere relative to the two other isotopes. This is what is observed. Plants favour the lighter Carbon 12 over Carbon 13 because it is energetically more efficient. Fossil fuels are made of dead organic matter, therefore a fossil fuel source should see an increase in the relative concentration of Carbon 12. Once again, this is observed. So that discounts volcanoes as a source. And most critically of all we actually have detailed inventories of the coal, oil, natural gas etc that we are burning and these match the observations too. -
Rob Painting at 18:30 PM on 7 July 2012Murry Salby's Correlation Conundrum
oarobin - so in essence that claim is that some mysterious mechanism absorbs all of human carbon emissions, and that natural emissions increase to compensate for this. I am curious as to how this mystery mechanism is able to identify and target only human carbon emissions, and more importantly, why? -
sol6966 at 17:27 PM on 7 July 2012Roy's Risky Regression
Some of the comments on this thread have left me a little confused. My understending is that the isotpoic changes in atmospheric co2 show that increases in co2 come from fossil carbon, either fossil fuels or volcanic. And that the decrease in atmospheric o2 in lockstep increases in co2 showed that co2 increases were coming fossil carbon being burned in the atmosphere and not coming from volcanoes ie. fossil fuels. -
oarobin at 17:09 PM on 7 July 2012Murry Salby's Correlation Conundrum
Dikran, in the Judith Curry thread link above there was a disagreement between Bart and Ferdinand Engelbeen on the mass balance argument that i think should be mentioned. the disagreement hinges around the issue that the mass balance argument alone is insufficient to conclude that C' is due to Ea. that is another possibility is that all Ea is taken up by the environment which also emits excess carbon equal to C'. of course no physical mechanisms are described to explain this possibility. as far a i can make out, the argument is that since |En|,|Un| >> |Ea| or |C'| i.e. the absolute magnitude of natural emissions or uptake is so much more massive than the anthropogenic emission or the net emission rate all the following can be simultaneously satisfied |En - Un| can be bounded and decreasing En > E(n-1) and Un > U(n-1) there is a increasing trend in both emission and uptake over the last 50 yrs trend in Un rises faster than the trend in En this will allow a more complicated model of rise in net emissions where all Ea is absorbed by the natural environment Un but En is responsible for all of C'. -
Marco at 17:03 PM on 7 July 2012Murry Salby's Correlation Conundrum
Tony O, I do not think the channel is Salby's. More likely to be that of The Sydney Institute -
Wadard at 15:59 PM on 7 July 2012Nil Illegitimi Carborundum
Trevor Woodward, Australia: Mr Jones and colleagues, thank you for doing what you do, and for doing it undeterred in the face of the ignorance, spite and fear stirred up by Big Carbon propagandists. Know that these cowards can't debunk your work in the peer-review forums, so they remotely snipe at your person from behind keyboards. Thank you for your contribution to our growing understanding of the physical world, so that we can address the problems that beset it. Thank you on behalf of my children and those that will come after them. Keep the flame strong. -
angusmac at 14:22 PM on 7 July 2012Simply Wrong: Jan-Erik Solheim on Hansen 1988
Dikran Marsupial @71 It is a reasonable request that I elaborate on ±30% error range. However, before I do, it would be very useful if I could have your estimate of what you consider to be a reasonable error range? -
KR at 12:48 PM on 7 July 2012Christy Exaggerates the Model-Data Discrepancy
Climate without global warming and the anthropogenic forcing as seen in the data is like biology without evolution - nothing makes sense without that key piece. -
Philippe Chantreau at 11:56 AM on 7 July 2012Lindzen and Choi 2011 - Party Like It's 2009
"Even if the authors lost confidence in getting the paper into PNAS, it would be unthinkable to ignore the review comments and turn the same text over to another journal, whether more or less prestigious." Very well said, Lambda. That is indeed, one aspect of how science works, and of why peer review is useful. -
Tony O at 11:41 AM on 7 July 2012Murry Salby's Correlation Conundrum
So if your business has revenue of $10 a week and costs of $9, but I steal $2 a week the reason you go broke is those costs and not my theft.Moderator Response: [Dikran Marsupial] Accusation of dishonesty deleted. Please lets keep to the science and avoid discussion of motives. -
Composer99 at 10:17 AM on 7 July 2012Christy Exaggerates the Model-Data Discrepancy
empirical_bayes: I agree with you, more or less completely at the conceptual and logical levels. If climate drives weather (which I conclude it does) and the climate is changing, it follows that every weather event will be affected by the climate change. All I was stating was that this is hard to show, statistically speaking, at the level of individual weather events, for the same reason that it's hard (perhaps not even possible) to show a causal chain between tobacco smoking and lung cancer incidence when examining individual patients in isolation. Of course, elsewhere on this site caerbannog has shown that with a tiny handful of weather stations one can produce a temperature series much like the global GISS series, so linking AGW with individual weather events may not be nearly as difficult as I imagine. -
Michaelf at 10:06 AM on 7 July 2012Nil Illegitimi Carborundum
Michael Fabiankovits. Australia -
empirical_bayes at 07:40 AM on 7 July 2012Christy Exaggerates the Model-Data Discrepancy
@Composer99, Regarding "As far as I can see, tying any single weather event to global warming is a bit like tying an individual smoker's lung cancer to his or her smoking habit - you can't really do it" ... It takes a bit of a mind warp, but as Dr Trenberth pointed out to me, if the physics underlying climate change is as solid as we believe it to be, and the evidence is as solid as it seems, then there is nothing in the world which can properly be interpreted in the absence of the fact of climate change. Indeed, the idea of trying to "prove climate change" or attribute this or that phenomenon to climate change kind of misses the point. If the physics implying climate change are wrong, then there should be many other experimental and engineering things we see and do which also don't work. To the degree they do, this bolsters our confidence that we really understand how the world works. If we do that, then climate change is part of our basic engagement with that world, and we should be surprised if something is NOT connected with climate change. A climate denier does more than deny climate: The denier is claiming physics really doesn't know what it is doing. To be a proper scientific claim, the denier needs to offer not only an alternative explanation of the data they are challenging, but also an alternative physics. Dr Trenberth isn't the only one who feels this. Dr Jennifer Francis observes that how can the Arctic melt NOT affect the weather? It would be a basic violation of physical law if dumping this amount of carbon into the atmosphere did NOT cause increase in energy. See the "Physical Chemistry of Climate Change" by Dr Fritz Franzen. He in fact wrong a guest column for Skeptical Science, but the PDFs at the site that links to are broken. A current link is: http://edu-observatory.org/Franzen/GWPPT10.pdfModerator Response: [DB] Hot-linked articles. -
Paul Magnus at 07:02 AM on 7 July 2012The GLOBAL global warming signal
Yes Tristan. The rate I refer to though is the average over the last couple of decades ie the 3mm compareded to the 1mm previous to that.... -
DaneelOlivaw at 05:42 AM on 7 July 2012Murry Salby's Correlation Conundrum
Seems to me that the problem is that anthropogenic emissions are (roughly) constant during the analysis period. If we look at the broader picture and compute a correlation coefficient with a dataset that spans a period of time with and without human emissions, then we would get a nicer fit, right? As an analogy, what Salby is doing seems to me like taking the temperature of a sick child during a week and computing the rate of increase and decrease. Then try to correlate it with , let's say, influenza virus counts in his blood and with time of day. Let's assume that there's a day-night cycle in our body temperature and that the rate of increase in temperature produced by the virus is constant. Then the variations in rate of increase in temperature would be only explained by the night-day cycle and the influenza virus would have nothing to do with it. This way we can conclude that cause of his fever is not influenza, but the night-day cycle. There's no need to give this child any treatment. Also, any treatment would cripple his family's economy... and the rise in temperature is plant food... I mean, it's good for him. -
mike@planet-hydrogen.org at 02:19 AM on 7 July 2012Nil Illegitimi Carborundum
Having visited UEA several times from my base in Manchester, and talked with the excellent folk at the CRU, I'd like to add my voice to this letter of support for Phil Jones, the best of scientists traduced by the worst of our fellow men. My hat is doffed too to Michael mann and all the others who have had to endure these threats and insults.Mike Koefman, hydrogen advocate, Manchester UK -
dana1981 at 01:54 AM on 7 July 2012Roy's Risky Regression
That's the one, Tristan. I don't mean to take these comments off-topic though. -
MA Rodger at 01:45 AM on 7 July 2012Nil Illegitimi Carborundum
Al Rodger, Dorset, UK. -
Tristan at 01:43 AM on 7 July 2012Roy's Risky Regression
Said Nobel laureate wouldn't happen to have been involved with superconductors perchance? -
Lambda 3.0 at 01:07 AM on 7 July 2012Lindzen and Choi 2011 - Party Like It's 2009
"The authors, however, believed that dealing with reviewers #1 & #2 was a waste of time, and decided to submit elsewhere." (alexharv074, #2) As a young engineer I learned that review comments indicate that you need to revise your content. It is very likely that other readers will have the same reactions to your writing. (An early mentor said, "If it can be misunderstood, it will be misunderstood," in encouraging me to address disagreeable comments.) After reading the four reviewers' comments, I see no reason why they should not be addressed. Also, I do not see how reviewers #3 and #4 were any more agreeable than the first two. Even if the authors lost confidence in getting the paper into PNAS, it would be unthinkable to ignore the review comments and turn the same text over to another journal, whether more or less prestigious. And that is beyond the point made by each of the four reviewers that the LC09 critiques were barely addressed. -
dana1981 at 01:00 AM on 7 July 2012Roy's Risky Regression
Alexandre @2 - coincidentally, we do have a post on the works addressing, among other claims, the suggestion that CO2 isn't a significant contributor to global warming because it's not visible. Made by a Nobel Laureate no less. Similar to Dikran's comments @8, the Laureate felt that criticisms of his comments stemmed from a politization of science, rather than the fact that his arguments were just plain ignorant and deserved every bit of criticism they received. Climate contrarians like questioning science - just not the scientific arguments they put forth! -
TCLSteve at 00:51 AM on 7 July 2012Nil Illegitimi Carborundum
Steve Jenkins, UK There are many of us in the Transition movement who already feel you are doing heroic work. We are deeply thankful for the work or you and your colleagues. -
sjansen at 00:28 AM on 7 July 2012Nil Illegitimi Carborundum
Stephan Jansen USA The emails you have received show amazing hatred based on shear ignorance. Keep up the good work. -
Dikran Marsupial at 00:23 AM on 7 July 2012Roy's Risky Regression
Cheers Srephen, sadly Salby and Spencer give a couple of good examples of what is wrong with the climate debate: Dr Spencer writes: "And just how strenuous and vehement the resulting objections are to what I have presented above will be a good indication of how politicized the science of global warming has become." Note the lack any suggestion that Dr Spencer may be simply mistaken (no big deal, it happens to us all evey now and again), and that any objections are politically motivated. Regarding the science being settled, Prof. Salby says (at about the 31 minute mark in his Sydney Institute talk) "Science is dynamic, it is predicated on discourse; questioning, that is how we get to the truth. If not for discourse we would still be in the dark ages. Excluding discourse from the equation isn't science, it is advocacy" Rather ironic then, that there have been no replies to my emails questioning the science presented in Prof. Salby's Sydney Institute talk. I fully agree with Prof. Salby that questioning and discourse are vital to progress in science. -
Stephen Baines at 00:06 AM on 7 July 2012Roy's Risky Regression
Oh bother...You all know what what I mean, right? Anyway, DM, excellent post. These kinds of mistakes are pretty elementary, but also pretty common. Still, you'd think someone would have mentioned these problems to Spencer and Salby and that they would have listened or corrected themselves after the fact. I'd like an explanation there. -
Stephen Baines at 23:41 PM on 6 July 2012Roy's Risky Regression
I meant that a natural Co2 source was responsible for the recent increase. The stable isotope and mas balance arguments are particularly compelling because they reinforce each other. -
Kevin C at 23:41 PM on 6 July 2012The GLOBAL global warming signal
Ah - don't trust early morning results (I should know better). Here's the 60-month moving average comparison of nearest neighbour (HAD4ext) and splines (HAD4s) with BEST. They are almost indistinguishable after 1960 - the trend difference since 2002 is a slight lowering about that date in HAD4s. BESTgiss2 shows a bigger uptick and short term trend because it is lower around 2002. (It would be very interesting to get to the bottom of that.)
However the interesting thing is the difference before 1958. The spline version looks more like GISTEMP, eliminating the difference caused by the SST corrections. I'm guessing the change is coincident with the introduction of the Antartic stations. However why this should counteract the SST correction (except by coincidence) is baffling.
BESTgiss2 shows a bigger uptick and short term trend because it is lower around 2002. (It would be very interesting to get to the bottom of that.)
However the interesting thing is the difference before 1958. The spline version looks more like GISTEMP, eliminating the difference caused by the SST corrections. I'm guessing the change is coincident with the introduction of the Antartic stations. However why this should counteract the SST correction (except by coincidence) is baffling.
-
Stephen Baines at 23:39 PM on 6 July 2012Roy's Risky Regression
Actually, the isotopes are just as damning to the idea that there is a natural CO2 source. Suess documented the decline in atmospheric C-14 back in the 50s, which indicated introduction of old or fossil carbon (>10,000 years). The source of this old carbon could have been due to plants or volcanoes. The later observation that C13 of atmospheric CO2 was changing as well indicated that plant material was contributing to the increase. So we know that the increase is in part due to fossil plant carbon. -
Dikran Marsupial at 23:32 PM on 6 July 2012Roy's Risky Regression
@tristan cheers! @Alexandre Note Dr Spencer published his blog article some time ago and I suspect he has since understood his error as he has not mentioned it since, as far as I can tell. @ScepticalWombat I think is is more likely that Salby is simply unaware of the mass balance argument, as he he explicitly states in his Sydney Institute talk that the required observations are reliable and he gives the fundamental equation on one of his slides and explains how it is net emissions that matter at great length. He just hasn't seen the obvious conclusion that you get when you combine the observations and the equation. I suspect the same was true for Dr Spencer, he even included this plot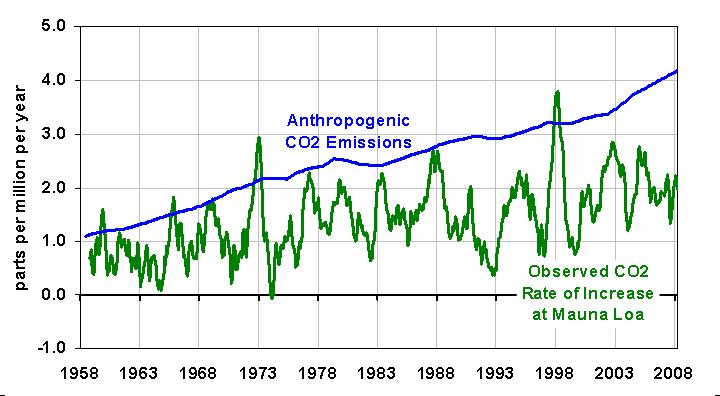 for me it is obvious from that diagram that the natural environment is opposing the rise in atmospheric CO2; but apparently it doesn't seem so obvious to everbody!
-
Sceptical Wombat at 22:53 PM on 6 July 2012Roy's Risky Regression
Alexandre The isotopic signature of the carbon provides good evidence that volcanoes are not responsible, but, as I understand it, the same isotopic ratio could be expected if the CO2 came from net emissions from, for instance, plants. Salby puts a lot of emphasis on the isotopic bit, which I see as a technique to distract attention from the much more formidable mass balance considerations. -
Alexandre at 22:24 PM on 6 July 2012Roy's Risky Regression
Gosh, they literally try to deny anything they get their hands on. I wonder if someone out there doesn't deny the existence of CO2 - we can't even see it! How does Spencer explain the isotope signature of the atmospheric Carbon? Our emissions are more than double the amount that stays in the atmosphere annually. Does he have an explanation for the secret hole where all this anthropogenic Carbon gets hidden every year? -
CBDunkerson at 21:11 PM on 6 July 2012Ocean heat flux and the Arctic
'Melting big time' is right. The PIOMAS figures for June are out and show a new record low anomaly. The downward spike each of the past three years is interesting. Seems to coincide with the run-up to the solstice and then 'recover' somewhat to less extreme anomalies by the end of the melt season. Odd to see the same 'pattern' three years in a row when it was never so pronounced previously. I had thought that Maslowski's estimate was based primarily on just a projection of the volume trend with the heat flux as the most likely explanation for the difference between observations and the models. The quotation above seems to suggest that his team has actually developed a "high-resolution regional model for the Arctic Ocean and sea ice forced with realistic atmospheric data" showing the 2016 +/- 3 result. Either way, the projections for Arctic sea ice to continue holding out for decades seem increasingly untenable. The only way that happens is if the declining volume trend stops dead in its tracks in the next few years... but, if anything, it seems to be accelerating. -
Tristan at 18:28 PM on 6 July 2012The GLOBAL global warming signal
Kevin Thanks for the generous offer. Unfortunately I'm still a ways from having the requisite expertise to do anything fun with it. I need to hit the books (again). -
Tristan at 17:38 PM on 6 July 2012Roy's Risky Regression
Excellent post -
Kevin C at 16:00 PM on 6 July 2012The GLOBAL global warming signal
Thanks. If you're interested, I can make python code available for all of this. It should be fairly easy to get most of it running on Linux/Mac. For windows you'd need to change a few command scripts to Windows command language. The one really painful part is extracting and regridding GISTEMP, which needs a fortran compiler. -
Tristan at 15:45 PM on 6 July 2012The GLOBAL global warming signal
Kevin Your posts inspire me to learn more numerical techniques so I can try to do some of the things you do, thanks for making me want to reach further. -
Kevin C at 15:44 PM on 6 July 2012The GLOBAL global warming signal
OK, here's an even more tentative early-morning result. In the final graph, BESTgiss2 shows an much bigger uptick around 2007 (but is a 60 month smooth, so must come from 2009/2010) than any of the other records. My new HAD4spline shows the same uptick. So it looks as though temperatures in 2009/2010 may be significantly affected by the smoothing bias, and both Kriging and polyharmonic splines are in agreement over this. While the difference in trend on 1996-2010 is only 0.005C/decade, the difference on 2002-2010 is 0.02C/decade. -
Kevin C at 15:15 PM on 6 July 2012The GLOBAL global warming signal
Agreed. Also, the SST bias, if right, has been building steadily over a longer period. While it would bring the instrumental record over the last few decades into very good agreement with the CMIP3 results, it wouldn't produce an acceleration of warming over the last couple of decades. One other update: I've now implemented polyharmonic spline interpolation to fill in the missing regions, which allows a crude estimate of the smoothing bias in GISTEMP and the *giss and *ext methods. This is very preliminary, but my current best guess is that the smoothing bias exists but is small - about 0.005C/decade for 1996-2011. So my best guessed are ~0.18C/decade without the SST corrections, or 0.21C/decade with. Polyharmonic spline interpolation takes about 2hrs for 60 years of data (compared to ~20s for nearest neighbour). Kriging would be better but slower still. The next step is to test the skill of the various reconstructions by omitting known regions. -
Tristan at 12:48 PM on 6 July 2012The GLOBAL global warming signal
Paul: As best we can tell, the underlying temperature trend has remained roughly constant over the past three decades. The recent short-term sea level rise is mostly the result of all the water that was dumped over South America, Pakistan and Aus during the 2009-11 period making its way back to the ocean. -
Paul Magnus at 10:52 AM on 6 July 2012The GLOBAL global warming signal
Question: So is the rate of GW increasing significantly now? Must be as sea level rise is accelerating by quite a bit, but there must be a lage. So what warming years are responsible for the increase in slr rate happening now? Is it a 2 5 or 10yr lag? -
Nick Rouse at 08:30 AM on 6 July 2012Nil Illegitimi Carborundum
Nick Rouse, UK -
scaddenp at 07:18 AM on 6 July 2012Review of new iBook: Going to Extremes
Michael, you might want to check out caliber to see if it can help. It can connect to itunes and has extensive conversion facilities (some built-in, some via plugins). -
perwis at 07:06 AM on 6 July 2012Nil Illegitimi Carborundum
Per Wikman-Svahn, Sweden. -
vrooomie at 06:27 AM on 6 July 2012Nil Illegitimi Carborundum
Paul Wigton, Colorado
Prev 1158 1159 1160 1161 1162 1163 1164 1165 1166 1167 1168 1169 1170 1171 1172 1173 Next


