


 Arguments


Recent Comments
Prev 150 151 152 153 154 155 156 157 158 159 160 161 162 163 164 165 Next
Comments 7851 to 7900:
-
nigelj at 05:49 AM on 5 February 2020Startups aim to pay farmers to bury carbon pollution in soil
So Indigo agriculture subsidises farmers to use regnerative farming. Does anyone know who funds indigo agriculture?
20% of yearly emissions sequestered sounds good.
-
ilfark2 at 05:18 AM on 5 February 2020With the En-ROADS climate simulator, you can build your own solutions to global warming
not sure where i got the 60% from,
but IEA, https://www.eia.gov/energyexplained/energy-and-the-environment/where-greenhouse-gases-come-from.php,
notes 45% of US CO2 emission is from petroleum (which would include lots of trucks that should be trains, i imagine)
In the past all large transformations occurred from either massive government or popular (or both) intervention.
Taxes and subsidies sometimes played a role, but only a very minimal, marginal role. Best e.g. I know of is the centrally planned US WWII mobilization. Taxes and subsidies played a part, but they were not used in conjunction with a market.
If you plan to use taxes and subsidies in conjunction with markets, it will take 50 to 100 years.
A large part of this is capitalist systems become captured by first movers. Rail, coal, steel, autos, financials, media, web, software have all demonstrated this repeatedly. That's why we still have 19th century technology heat engines for transport.
At this point to get to 0 emissions in a timely fashion, we will have to have planned resource allocation.
Ideally we'd do it democratically. More likely it would be sort of representatively democratic or even more likely done the way whoever ends up in charge of it thinks it should go (like the US WWII mobilization).
In any case, taxes and subsidies will play a small, if any part.
Otherwise we'll bumble along as we are for a while until things get bad enough for somebody to block enough sun with SO2 to trigger snowball earth...
Moderator Response:[JH] Link activated.
-
william5331 at 04:56 AM on 5 February 2020Startups aim to pay farmers to bury carbon pollution in soil
For a great take on regenerative agriculture, it would be hard to find a better book than Growing a Revolution by David R Montgomery. He also wrote a previous book, Dirt, in which he described the fate of civilizations that treated their soil like dirt and a sequel, The Hidding Half of Nature in which he describes the inner working of rich organic (carbon rich) soil. Rumors are that he is now working on a book on the food value of crops grown in rich organic soil vs crops grown in depleated soil.
-
Doug Bostrom at 04:46 AM on 5 February 2020Startups aim to pay farmers to bury carbon pollution in soil
RedBaron, pardon me if I'm telling you what you already know but there are a few specialist crowdfunding sites to help with scientific experimentation.
https://experiment.com/ is one I've used (as a funder)
Possibly you might have better results with a crowd particularly interested in funding science.
-
RedBaron at 04:10 AM on 5 February 2020Startups aim to pay farmers to bury carbon pollution in soil
Capacity is plenty to cover both mens estimates and some. The kicker is and always was rate.
5-20 tonnes CO2e /ha/yr has been repeated multiple times around the world in the field by land managers.
Dr David Johnsons results are higher, but these are research plot numbers, not results from commercial land managers/farmers/ranchers attempting to use Dr Johnson's methods. I only know of one or two examples of anyone obtaining results comparable, so this could be an outlier, or it could be yet another big breakthough comparable to the LCP.
I don't doubt what Dr Johnson has done is possible, but how easily it is repeatable is an unknown for me right now. I will however attempt to repeat his numbers myself in my own research plots. That is if I can manage to round up enough money for a series of 16S and 18S analyses and some equipment. My attempts to raise money for my research has not gone particularly well so far. I know I don't have the funds for the more expensive detailed tests. My attempt to gain funding from the Indigo challenge was also unsuccessful, although I certainly applied.
Considering how he claims he got those results, I am a bit surprised though. Till now I never thought I'd see numbers like that on that side of the system. Although it may be that somehow while he may think this is saprophytic carbon being sequestered it is in the end really mostly mycorrhizal carbon from the LCP that has somehow trapped additional decaying organic material from the saprophytic organisms. That's just a hypothesis of mine though. I obviously have not tested it yet. I am basing it on this: Glomalin, the Unsung Hero of Carbon Storage
"Glomalin is a sticky protein produced by root-dwelling fungi and sloughed into soil as roots grow. By gluing soil particles and organic matter together, it stabilizes soil and keeps carbon from escaping into the atmosphere. In an earlier study, Wright found that glomalin serves as a corrective to global warming because it increases with carbon dioxide levels."
Notice that while glomalin itself is a carbon compound, it actually binds other organic compounds and traps them, preventing their oxidation and release back as CO2. It is possible that is what Dr Johnson is managing to optimize, since compost is clearly the saprophytic side (Labile fraction of soil carbon) and usually decays back to CO2 almost entirely. That leaves an interesting level of complexity to investigate. I have been following Dr Johnsons results for a while now.
-
One Planet Only Forever at 03:33 AM on 5 February 20202020 SkS Weekly Climate Change & Global Warming News Roundup #5
The public reaction seen in the live TV broadcast that Michael Sweet's comment @3 provided a link to is indeed encouraging.
However, the reasons people vote the way they do is what needs to change, not just the expression of public moments of ridicule.
Many people who understand that the developed attitudes and actions of most of the more fortunate humans are causing significant unacceptable climate change to occur will continue to vote for candidates and parties they know do not share that understanding and the need for correction. They will vote for candidates and parties that have a proven a history of resisting expanded awareness, resisting improving understanding, resisting applying learning to help develop sustainable improvements for humanity, resisting correction.
Some people will understand they should dislike a Leader, or leadership candidate, who proves they lack the ability to responsibly perform the duties of their elected office like the "booed at Senator". But they will still vote for that type of individual or party "for other reasons". And, tragically, what many of those types of voters will fail to realize is that the "other reasons" they have for voting for that type of candidate or party are also resistance to expanded awareness, improved understanding and correction of unjustified developed beliefs and related harmful unsustainable actions.
The pursuit of Sustainable Development is a response to the harmful developments that have been occurring. And many of the wealthy and powerful have responded to the expanded awareness and improved understanding of the corrections of what has developed in order to achieve Sustainable Development by gathering up the diversity of "resistance to Sustainable Development Corrections" into United Political Groups as a way to divisively polarize societies in order to prolong the winning by a Collective Diversity of Resistance to Sustainable Development Correction. They, like the Senator, demand the freedom to believe whatever they want as the justification for resisting the correction of something they have developed a liking for. They like the freedom to continue to do what they like. They dislike "Any External Governing/Limiting of their behaviour, and any related corrections of beliefs".
-
Nick Palmer at 02:52 AM on 5 February 2020Startups aim to pay farmers to bury carbon pollution in soil
Lal's calculations as to how much C an be sequestered are regarded as very much at the low end of the spread of predictions. The results of Dr David Johnson of NMU suggest a surprisingly larger capacity is available. Red Baron?
-
Paul_Belanger at 02:07 AM on 5 February 2020Startups aim to pay farmers to bury carbon pollution in soil
This is all very good - soil regeneration is a win-win for us all. However it can be an even bigger win if you include biochar into the mix and burial into the soil - unlike compost it stays in the soil for 100s of years: ON BIOCHAR - A MUST READ – Burn; using fire to cool the Earth by Albert Bate and Kathleen Draper. Encourage your libraries and local bookstores to buy it.
-
Morchea at 01:19 AM on 5 February 2020Too late to stop Climate Change?
Hi,
I created a poll to get a feeling of what people are doing to reverse Climate Change in different parts of the world:
Please participate ! Thanks.
Moderator Response:[DB] Shortened and activated URL
-
michael sweet at 23:21 PM on 4 February 20202020 SkS Weekly Climate Change & Global Warming News Roundup #5
On a live TV broadcast in Australia a Senator is booed by the audience when he says he questions in climate change is "human caused" He says "my mind is open" based on "I'm not relying on evidence".
Michael Man responds "you should keep open mind but not so open your brain falls out" (2:00, the very end).
Three cheers for Michael Mann!!! On live TV!!
-
Philippe Chantreau at 09:14 AM on 4 February 2020Models are unreliable
Worth reading about the subject: latest update at Real Climate. CMIP 3 seems to be doing quite good.
http://www.realclimate.org/index.php/archives/2020/01/update-day-2020/
-
scaddenp at 11:56 AM on 3 February 2020CO2 is just a trace gas
Bruce 47. One issue is that the "greenhouse" effect is inapprobiately named. It doesnt work like a greenhouse which makes "simple" experiments interesting depending on you what are trying to measure. In a lab, you can measure the absorption of sunlight by increasing the CO2 concentration. However, you would quickly conclude as Angstrom did, that you can saturate the effect. However, in the real structure of the atmosphere, temperature and pressure varies with height and as a result you cannot saturate the effect. An experiment to demonstrate this would somewhat large...
However, the change in radiation as CO2 increases can be measured though it is not a simple design. See here for details. More indirect measures of the change have been done by both measuring change at surface (eg Evans 2006) or to outgoing radiation from space (eg Harries 2001).
-
michael sweet at 09:14 AM on 3 February 2020Milankovitch Cycles
MAP,
In general, if you think of a question scientists have answered it.
If not for humans the descent into the next glacial period would have started several thousand years ago. The hockey stick shows declining temperature until 1850. The descent would have been faster but human land use slowed it down.
-
Map at 08:30 AM on 3 February 2020Milankovitch Cycles
Moderator JH I would like to point out again comment @49 was a duplicate that can be deleted as well as this comment. A user here pointed me to an interesting website that answers most of my questions which is what I was hoping for. I will not be asking more here
Moderator Response:[JH] At the end of the day, we all do what we consider to be in our own self interest.
-
Map at 08:01 AM on 3 February 2020CO2 lags temperature
Philippe chantreau thank you, that link will answer many of the questions that this discussion would have led me to ask.
-
Philippe Chantreau at 07:34 AM on 3 February 2020CO2 lags temperature
Map,
The length of the cycle is 100,000. We reached the interglacial stage about 12,000 years ago (consider it the end of the cycle, or beginning, I'm not sure it matters), and what is known as the Holocene climatic optimum is centered around 7-8,000 years ago, depending on proxies.
https://commons.wikimedia.org/wiki/File:Holocene_Temperature_Variations.png
Plenty of references on that page for data and publications.
-
Map at 07:08 AM on 3 February 2020Milankovitch Cycles
Moderator JH, I would like to ask, if the website is named skeptical science and most people in the scientific community agree with global warming, then why are all of the skeptics expected to formulate their questions like a scientist? Also want to point out post @47 somehow duplicated into @49
Moderator Response:[JH] Septics of mainstream science are more than welcome to post comments on this website if they are polite and abide by the rules. Skeptics who cannot and/or will not document the source of their assertions are, by and large, wasting everyone else's time. They are effectively functioning as "climate science deniers" who grossly underestimate the climate science knowledge base of the regulars who post and respond to comments.
To learn more about why the name Skeptical Science was chosen, click on the "About" button in the blue bar on the top of each page.
-
Map at 07:04 AM on 3 February 2020Milankovitch Cycles
Scaddenp thank you, that graph show exactly what I was looking for. Interesting that it shows the opposite of what I was comprehending before with the albedo on land mass.
-
Map at 06:58 AM on 3 February 2020Milankovitch Cycles
Michael sweet that quote that you copied from a different page was at someone who was being very judgemental in his responses which is what lead me to that conclusion, which is why I thanked you for your intellectual response before I abandoned my communication with him.
But to continue on your response to my question (which I appreciate). Has land use changes like deforestation for farm ground been compared with the current amplification of global warming to see how big of an affect it is along side with co2?
Moderator Response:[DB] Deforestation is about 11% of the overall problem. The human burning of fossil fuels is pretty much the rest.
-
Map at 06:58 AM on 3 February 2020CO2 lags temperature
Michael sweet this is why jumping multiple pages for a flowing conversation causes issues. I did respond to your graph and then in this comment section I had it pointed out when the timing for ice ages changed from 41000 years to 100000 years, which reinforces your post and made it more revalant to my discussion again but was on a different page. I do appreciate the answers you are giving me and am not trying to be rude.
Looking at your graph yet again, I also see that there does appear to be a very slight cooling trend over the last ~8000 years, and before that a fairly steady temperature rise over about a 4k year period. This is what lead me to ask why the cooling trend had occurred when that chart appears to be showing temperature rise to be expected, and why it is alarming for the temperature rise to resume when it would be expected for the trend to continue until the buildup of the next iceage ~80000 years from now?
-
Bruce 47 at 06:34 AM on 3 February 2020CO2 is just a trace gas
I am new to this site and trying to learn. Plese forgive me for taking such an elementary tack and guide me in the right direction if you can.
Has anyone seen the results of a simple green house experiment?
Problem: What is the temperatrure affect of Sunlight on volumes of air with different concentrations of CO2?
Thank you,
Bruce
-
scaddenp at 06:25 AM on 3 February 2020Milankovitch Cycles
The change in albedo from human constructions etc. is is under "Land use" in the breakdown forcings.
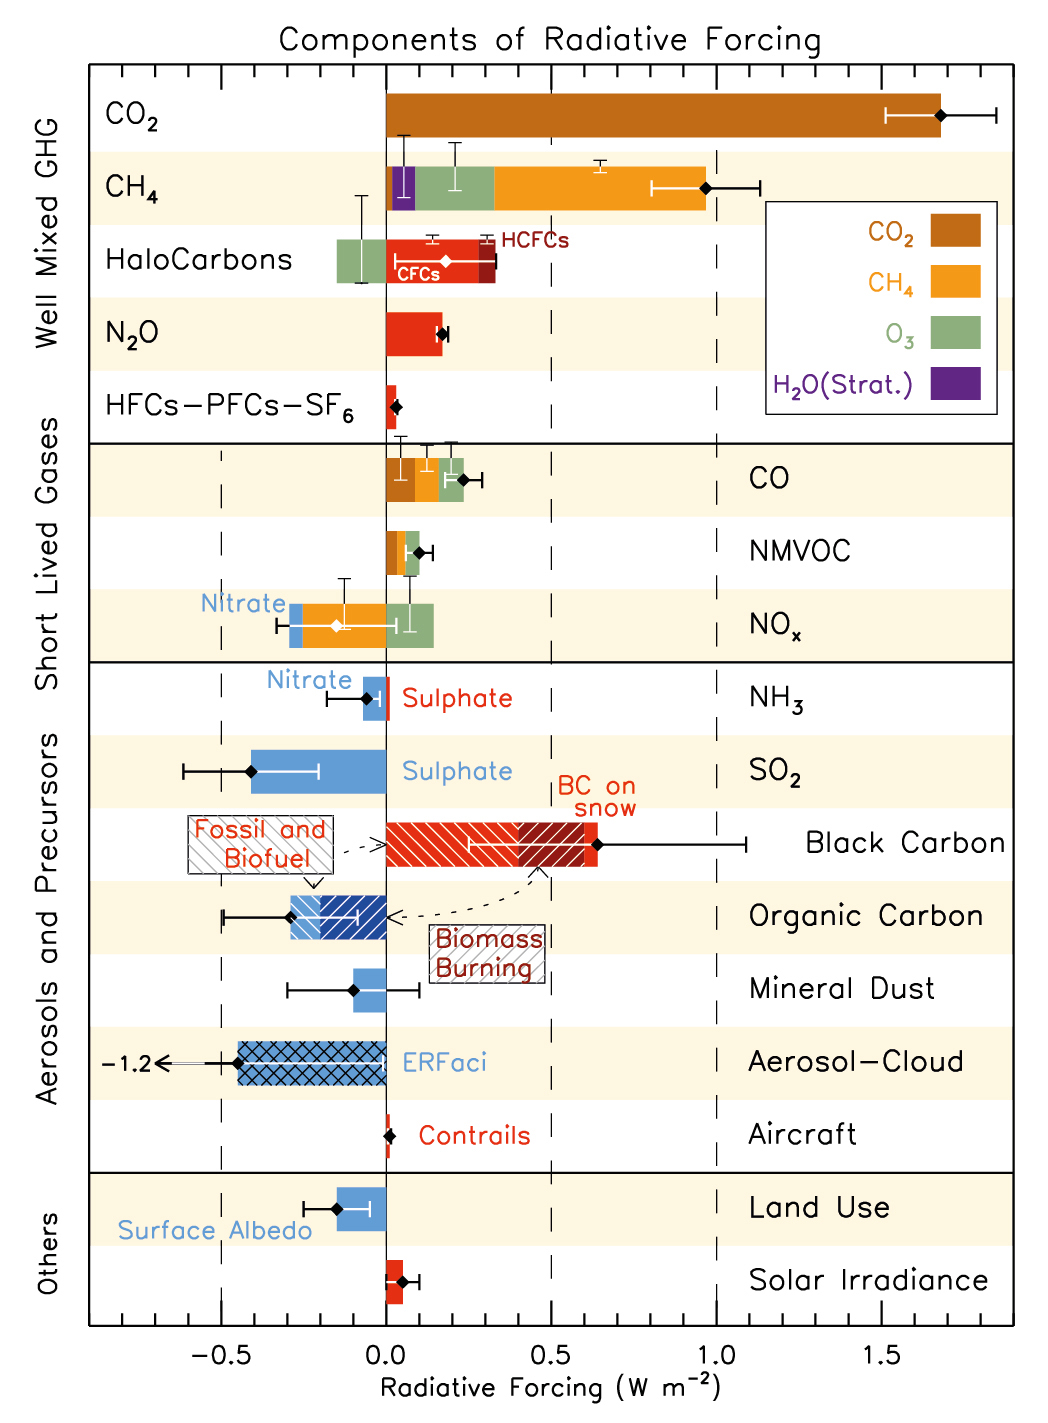
This is discussed (with references to the source data) in Chapter 8, section 8.3.5. If you havent already read the the IPCC report, then you should so before leaping in here.
Moderator Response:[JH] For future reference, if Map posts comments containing undocumented assertions, please do not respond to them. They will be summarily deleted.]
-
Map at 06:12 AM on 3 February 2020CO2 lags temperature
Michael sweet this is why jumping multiple pages for a flowing conversation causes issues. I did respond to your graph and then in this comment section I had it pointed out when the timing for ice ages changed from 41000 years to 100000 years, which reinforces your post and made it more revalant to my discussion again but was on a different page. I do appreciate the answers you are giving me and am not trying to be rude.
Looking at your graph yet again, I also see that there does appear to be a very slight cooling trend over the last ~8000 years, and before that a fairly steady temperature rise over about a 4k year period. This is what lead me to ask why the cooling trend had occurred when that chart appears to be showing temperature rise to be expected, and why it is alarming for the temperature rise to resume when it would be expected for the trend to continue until the buildup of the next iceage ~80000 years from now?
-
Map at 05:57 AM on 3 February 2020Milankovitch Cycles
Michael sweet that quote that you copied from a different page was at someone who was being very judgemental in his responses which is what lead me to that conclusion, which is why I thanked you for your intellectual response before I abandoned my communication with him.
But to continue on your response to my question (which I appreciate). Has land use changes like deforestation for farm ground been compared with the current amplification of global warming to see how big of an affect it is along side with co2?
-
michael sweet at 05:22 AM on 3 February 2020CO2 lags temperature
Map,
The graph I provided to you here clearly shows a 100,000 year cycle. Why do you have so many questions about something you have already been provided the data for? Do you ignore everyone elses posts or are you incapable of reading a simple graph?
When you claim to be really smart and then do not read the posts made to you it makes everyone else hostile to you.
Moderator Response:[JH] For future reference, if Map posts comments containing undocumented assertions, please do not respond to them. They will be summarily deleted.]
-
michael sweet at 05:18 AM on 3 February 2020Milankovitch Cycles
Map,
Human constructions like roads and buildings affect the temperature in cities a fair amount. That is called the urban heat island effect. Because cities are relatively small the effect on the Earth's average temperature is small.
To expand your question, land use changes like converting forrest into farmland also affect albeido. Because farms are so large this does have a significant effect on global temperature.
When you make statements like:
" I have decided to abandon the discussion and not educate myself in this area as the "smart people" in the room haven't the ability to portray their thoughts to someone smarter than themselves that just isn't studied in the area he is questioning." my emphasis
You look like you only want to insult people. If you are not informed on the subject we are discussing is is improper to say you are the smartest person in the room.
-
Map at 05:15 AM on 3 February 2020CO2 lags temperature
Phillips chantreau I should add, the comment in my question about a cooling trend was taken directly from a response from eclectic on a different article on this site about us temperature in 1934 before that conversation was forced to roll over into this article.
-
Map at 05:09 AM on 3 February 2020CO2 lags temperature
Phillips chantreau you are correct, I just found another link on this site that states that somehow the 41000 year of milankovitch's theory changed around 800000 years ago and shifted the iceage timing to be around 100000 years now instead. I apologise for my vagueness in the "I read somewhere" but unfortunately that is due to the time that lapses between when I read articles and the number of articles I read in a night, I have good enough memory to quote exact phrases that I have read over the last year but unfortunately cannot swear to exactly which page I have received them from. However, the question that was avoided that kind of upset me was this.
If instead you choose to lean on the theory that iceages occur every 100k years, then was the last one truly 20k years ago? If it was then, how were we in a slight cooling trend leading into the 1900s when the globe should be warming for the next 80000 years building into that next ice age?
-
One Planet Only Forever at 04:14 AM on 3 February 2020Glaciers are growing
The recent article Antarctica melting: Climate change and the journey to the 'doomsday glacier' by Justin Rowlatt, BBC News, January 28, 2020, complements and supplements the items linked to by John Hartz @47.
A relevant supplement provided in the article is the presentation showing that the elevation of a substantial portion of the ‘grounding surface’ under Antarctica’s ice, and almost all of the ‘grounding surface’ at the base of the Thwaites Glacier, is below sea level.
-
Map at 03:52 AM on 3 February 2020Milankovitch Cycles
Ok a quick question. I am seeing throughout the comments that people are correlating milankovitch's theory with albedo and ocean current to "explain" how solar insolation and ocean co2 can add to the temperature effects of the milankovitch theory. The question that I have is; Is there a way that the extra structures that man have put on the land mass in the northern hemisphere and the factor that we move so much snow to expose the ground to make travel easier possibly changing the albedo effect on solar insolation and combining with our increased co2 output to amplify our current global warming?
-
Philippe Chantreau at 03:44 AM on 3 February 2020CO2 lags temperature
I believe that I had read Map's initial comment correctly and that he is indeed referring to what some call the Mid-Pleistocene transition. This is an area of active research and, although his posts are poorly formulated, I do not see that map deserves scorn for enquiring about it.
The recent regime of 100,000 years interglacial was preceded in the paleo record by a longer period where the 41,000 years cycle dominated. Wikipedia has a good explanation and plenty of links to scientific literature, including some recent ones.
Citing the wiki page:
"There is strong evidence that the Milankovitch cycles affect the occurrence of glacial and interglacial periods within an ice age. The present ice age is the most studied and best understood, particularly the last 400,000 years, since this is the period covered by ice cores that record atmospheric composition and proxies for temperature and ice volume. Within this period, the match of glacial/interglacial frequencies to the Milanković orbital forcing periods is so close that orbital forcing is generally accepted (emphasis mine). The combined effects of the changing distance to the Sun, the precession of the Earth's axis, and the changing tilt of the Earth's axis redistribute the sunlight received by the Earth. Of particular importance are changes in the tilt of the Earth's axis, which affect the intensity of seasons. For example, the amount of solar influx in July at 65 degrees north latitude varies by as much as 22% (from 450 W/m² to 550 W/m²). It is widely believed that ice sheets advance when summers become too cool to melt all of the accumulated snowfall from the previous winter. Some believe that the strength of the orbital forcing is too small to trigger glaciations, but feedback mechanisms like CO2 may explain this mismatch."
Further down: "During the period 3.0–0.8 million years ago, the dominant pattern of glaciation corresponded to the 41,000-year period of changes in Earth's obliquity (tilt of the axis). The reasons for dominance of one frequency versus another are poorly understood and an active area of current research, but the answer probably relates to some form of resonance in the Earth's climate system. Recent work suggests that the 100K year cycle dominates due to increased southern-pole sea-ice increasing total solar reflectivity."
Worth noting:
https://agupubs.onlinelibrary.wiley.com/doi/full/10.1002/2016GL071307
There are plenty of other interesting references in the Wiki.
Map,
To have a productive exchange here, you can not be vague with statements like "I have read somewhere" and such. These are used all the times by people who argue in bad faith and trigger the corresponding response from other posters, for which you can not blame those who respond. Scientific references are a must. Specific inquiries and precise questions are helpful.
It should be noted that the regime in the paleo record has now been completely replaced and that we are in entirely new conditions because of the massive injection of CO2 in the atmosphere from the past 100 years.
Moderator Response:[JH] For future reference, if Map posts comments containing undocumented assertions, please do not respond to them. They will be summarily deleted.]
-
NIOSNEWS at 03:05 AM on 3 February 2020Too late to stop Climate Change?
Moderator Response:[TD] Please provide context for links you supply. Also put those comments in appropriate threads. The link you gave here is not on topic for this thread. See the list of myths in the left margin, or use the Search field at the top left of the page.
-
Map at 02:58 AM on 3 February 20201934 - hottest year on record
Michael sweet and ma Rodger, thank you for addressing my questions rather than attacking my wording. As I have found that I cannot continue conversations on this website without moving from topic to topic and Everytime my line of questions change slightly someone chooses to attack my wording just because I am trying to view the pieces to address the whole picture I have decided to abandon the discussion and not educate myself in this area as the "smart people" in the room haven't the ability to portray their thoughts to someone smarter than themselves that just isn't studied in the area he is questioning.
Moderator Response:[JH] Argumentative nonsense stuck though.
-
Map at 02:51 AM on 3 February 2020CO2 lags temperature
Eclectic, sorry I confused you with "denialist research" when I misrepeated your phrase of "denialist websites". I came here to educate myself and once again you showed that you are incapable of answering the question part of my responses and only wish to divulge in your emotional responses. I was attempting to save time which I don't have on dredging through links of myths and having my particular questions answered but I apparently failed to find someone that can do more than emotionally regurgitate info. I will therefore choose to end this discussion and not care about global warming and just follow exxon's propaganda to bamboozle people beings you're unable to answer simple questions.
Moderator Response:[JH] Argumentative sloganeering struck through.
-
John Hartz at 02:10 AM on 3 February 2020Glaciers are growing
Recommended supplemental reading:
Scientists have found warm water beneath Antarctica's "doomsday glacier," a nickname used because it is one of Antarctica's fastest melting glaciers. While researchers have observed the recession of the Thwaites Glacier for a decade, this marks the first time they detected the presence of warm water – found at a "vital point" beneath the glacier.
A news release on the findings called it an alarming discovery.
"The fact that such warm water was just now recorded by our team along a section of Thwaites grounding zone where we have known the glacier is melting suggests that it may be undergoing an unstoppable retreat that has huge implications for global sea-level rise," David Holland, director of New York University's Environmental Fluid Dynamics Laboratory and NYU Abu Dhabi's Center for Global Sea Level Change, which conducted the research, said in the news release.
Scientists alarmed to discover warm water at "vital point" beneath Antarctica's "doomsday glacier" by Sophie Lewis, CBS News, Feb 1, 2020
-
Eclectic at 02:00 AM on 3 February 2020CO2 lags temperature
Yes, David Kirtley, quite so. An excellent article.
Map , there is no denialist research. (If there were a chance of such denialists producing anything valid . . . then Exxon and others would pour vast sums into "anti-AGW" research But that doesn't happen, because the hard heads at Exxon know that the basic climate science is correct. Instead, they spend that money on propaganda to confuse & bamboozle people who haven't bothered to learn any of the science. (Sound familiar?)
Educate yourself, Map. Takes some time, but it's easily done ~ follow the links from the SkepticalScience Home Page, or select some of the Most Used Climate Myths. No-one wishes to spoonfeed you, if you have a dismissive attitude. Or simply accept the experts' advice ~ something which you normally do in almost every aspect of modern life. Be honest!
Seriously Map, would you dismiss the consensus opinion of a panel of leading surgeons & and medical researchers . . . because you didn't like their "tone" or because you read some flakey alternative view on a Homeopath website?
Map, it's hard to credit that you're not joking around. (Some call it being an agent provocateur ~ which sounds better than the T-word.)
-
Eclectic at 00:45 AM on 3 February 20201934 - hottest year on record
Map , you are being mysterious.
<" multiple outcomes that support and contradict the basis of global warming ">
This needs some explaining from you! It doesn't fit in with the general mainstream science of climate. The world's scientists have spent a great deal of time & effort (over many decades indeed) and have produced a coherent description of the physics of it all. The science is demonstrated in many thousands of scientific papers published in respected peer-reviewed journals.
They are pretty much unanimous in their findings. Yes, there are a few "contrarian" papers ~ but all of these show major faults ( e.g. Lindzen's Iris Hypothesis; Svensmark's and Shaviv's Cosmic Rays Hypothesis; Salby's Ocean-outgassing of CO2 Hypothesis ).
In short, Map, the evidence is wholly one-sided. There is no valid alternative.
Map, I think you are playing a joke. (But why do you bother?)
Moderator Response:[JH} Notwithstanding his crocodile tears, Map's own words tell us that he is not posting comments on this site with an open mind and in good faith.
-
Map at 00:42 AM on 3 February 2020CO2 lags temperature
Denialist websites will create noise in research when the internet is used, that's why I turned to a page that debunks excuses from 'nonbelievers'. I myself haven't made a decision as to my belief of it because I question why there is so much contradictory research when "90% of the science community agrees". Ok onto my next question, can u explain where I am misinterpreting milankovitch's theory? The data I have read on it mentions global orbit and axial tilt as having a significant bearing on ice ages ~ every 20k years with major events happening ~40 k years. If our last ice age was indeed around 20k years ago, then where is the earth currently positioned in milankovitch's theory? Have we just passed a 20k minor ice age or are will still supposed to be approaching it? If instead you choose to lean on the contradiction that iceages occur every 100k years, then was the last one truly 20k years ago? If it was then how were we in a slight cooling trend leading into the 1900s when the globe should be warming for the next 80000 years building into that next ice age?
Moderator Response:[JH] Please document "The data I have read." If you do not and cannot, you will forfeit your right to comment on this site. Global statements with documentation is sloganeering which is prohibited by this site's Comment Policy.
-
David Kirtley at 00:36 AM on 3 February 2020CO2 lags temperature
Map, you may want to look at my post on Abrupt Climate Change in Greenland, from which Eclectic pulled the quote from Richard Alley. (I thought I recognized that quote. :) )
-
Map at 00:17 AM on 3 February 20201934 - hottest year on record
My original question had started closer to the topic but as I receive a response to that the questions naturally shifted, as most research does. The reason i chose this page to ask these questions is because the article above specifically attacks cherry picking of time and place, much like how my questioning had turned to other data that could be consider cherry picked by mainstream climate science. The problem I have had in my breif research is that all the papers I've read want to force the finished puzzle on you without examing the pieces, and when I research the pieces the information tends to lead to multiple outcomes that support and contradict the basis of global warming.
Moderator Response:[JH] If you continue to make unsubstantiated global statements they will be summarily deleted because they violate this site's Comments Policy — specifically the "no sloganeering" provision. You will also forfeit your privilege of posting on comments on this site.
Please note that posting comments here at SkS is a privilege, not a right. This privilege can and will be rescinded if the posting individual continues to treat adherence to the Comments Policy as optional, rather than the mandatory condition of participating in this online forum.
Moderating this site is a tiresome chore, particularly when commentators repeatedly submit offensive, off-topic posts or intentionally misleading comments and graphics or simply make things up. We really appreciate people's cooperation in abiding by the
strong>Comments Policy, which is largely responsible for the quality of this site.
Finally, please understand that moderation policies are not open for discussion. If you find yourself incapable of abiding by these common set of rules that everyone else observes, then a change of venues is in the offing.
Please take the time to review the policy and ensure future comments are in full compliance with it. Thanks for your understanding and compliance in this matter, as no further warnings shall be given.
-
Eclectic at 22:50 PM on 2 February 2020CO2 lags temperature
In reply to commenter "Map" , from the other thread :-
Map, we must be careful to avoid semantic problems/confusions, so it is best if we all communicate in the standard scientific language (i.e. meaning of terms). You will mislead yourself if you use terms such as "minor ice ages" every 21000 years and "major ice ages" every 43000 years. For that is not what the well-established Milankovitch theory indicates. (See ice-albedo , CO2 feedback, etcetera.)
You haven't said exactly, but you seemed to be referring to Greenland ice cores (such as GISP2 from central Greenland). Their data comes from local conditions ~ not from global temperature changes.
There have been interestingly large/rapid swings in temperature shown in GISP2 data, but these are are mostly around the unusual event of the Younger Dryas . . . and do not reflect a basic global climate change (nor the inflow/outflow of heat energy which is the underlying cause of climate change).
For the sudden rise you mentioned, please permit me to quote climate expert Richard Alley :- "[temperature increase was] for Greenland, and applies moderately well around the North Atlantic, primarily as a wintertime change because there was a rapid shift from wintertime sea ice to wintertime open water in important regions. ... I can provide lots of chapters and verses on all of this, but the skinny version is that when the abrupt shifts happened, they primarily involved circulation rather than greenhouse gases, they didn't do a lot to global mean temperature, but they did do a lot to regional climates in many places, with large, rapid changes in North Atlantic temperatures, rapid shifts in monsoonal rains and in the edges of the tropical rain belts, smaller shifts in northern temperatures away from the North Atlantic, and lagged and opposite shifts in southern temperatures (so northern warming was followed by southern cooling)".
Map, I hope that provides you somewhat of a help. Please note that the big swings in the GISP2 proxy temperature data . . . are often displayed in the Deniosphere (of science-denying websites) ~ where it is implied that it's a world temperature chart. Worse, the GISP2 graph ends at 1855 (yes, eighteen fifty five ~ quite before the modern AGW temperature rise began) . . . and the chart scale is so compressed, that the casual reader is misled into believing past temperatures were much higher than modern times.
Denialist websites, such as WattsUpWithThat [WUWT] are well-known for these types of deceptions & falsehoods. Map, if that's where you've been getting some of your information/misinformation . . . then you have been handicapping yourself. WUWT contains all sorts of propaganda ~ and a lot of mutually contradictory crackpottery . . . and the comments sections there are half-filled with people who are still in complete denial of the basic physics of CO2 radiational properties. Really a snake-pit of intellectual insanity !
-
Eclectic at 21:38 PM on 2 February 20201934 - hottest year on record
Thank you Michael Sweet ~ that would be a better thread.
To finish up here :- in defense of commenter "Map" , I must say that his [now deleted] phrasing was a little clumsy: <" ... it took nearly 10,000 years for the Earth to totally emerge from the last ice age and warm to today's balmy climate, one-third to one-half of the warming--about 15 degrees Fahrenheit--occurred in about 10 years. "> [unquote] . . . but could reasonably be taken as meaning around 5 to 7.5 degreesF.
OTOH, the actual global warming into the Holocene was close to half of the 15F ~ so that should have alerted Map to the strong possibility that he had misinformed himself.
And as for a large slice of that temperature rise to occur - globally - in about 10 years . . . well, that would require an absolutely colossal influx of heat energy to occur. The sort of heat influx provided by a gigantic asteroid strike : far exceeding the wimpy little asteroid strike which which finished off the dinosaurs. Not to mention the subsequent plunge into Nuclear Winter. All of which, would definitely have shown up in the GISP2 ice core record. (Along with the concurrent extinction of all higher lifeforms on Earth !! )
I shall ponder, and likely make a post on the other thread (CO2 Lags Temp).
-
michael sweet at 20:29 PM on 2 February 20201934 - hottest year on record
MAP and MA Rodger,
I have responded to your posts here where it is on topic.
-
michael sweet at 20:27 PM on 2 February 2020CO2 lags temperature
MARodger,
Thank you for the reference to the 2006 report in NASA's Earth Observatory, they do say 15F in 10 years. When I found their referenced source of the GISP2 temperature and accumulation data (file did not open on this computer, sorry for no link), the data is all sectioned off in 50-80 year sections so a 10 year claim is not supported. In addition, 15F would be about 8C and there is no change anywhere near that magnitude (in 50 years not 10) in the record. It seems to me that the NASA report has a typo in it.
To address Map's question, this is data for a single location on Greenland and not global data. The temperature change in Greenland was over 20C since the last ice age while Earth average was 4C according to the data in the OP. In addition. there is much more noise in data from a single location than from an average for the entire Earth. Conflating Greenland data for the Earth's average is simply incorrect.
You ask several questions in your last post. It is difficult to respond to several questions separated only by a question mark. Please ask one at a time. Start with the one that is most important to you.
-
MA Rodger at 18:55 PM on 2 February 20201934 - hottest year on record
For the record, the "one-third to one-half of the warming—about 15 degrees Fahrenheit—occurred in about 10 years." quote mentioned @111/112 originated at NASA's Earth Observatory back in 2006.
-
michael sweet at 17:46 PM on 2 February 20201934 - hottest year on record
Map:
If you want to continue to discuss ice age temperatures I suggest you post on the CO2 lags temperature thread. The moderators will delete posts here about the ice age since it is off topic.
-
michael sweet at 17:41 PM on 2 February 20201934 - hottest year on record
Map:
Accepted science is that total heating since the last ice age is about 4C (7F) over about 20,000 years. In your deleted comment you make the unsupported claim "one-third to one-half of the warming—about 15 degrees Fahrenheit—occurred in about 10 years." That would be a total of 30-45 F obviously grossly too much heating. Since your unsupported claim is completely contrary to science is was deleted. You could link to where you heard this deliberate falsehood and we could explain why that site is misleading you.
In additioin, this thread is about the hot year 1934 in the USA (worldwide it was not an especially hot year). Your comment about ice ages is off topic.
I suggest you read a thread about ice core temperatures. The graph of ice core data looks like this:

Note the time scale on the bottom is in hundred thousands of years. Here is the most recent data going back to the last ice age:

There is no jump in temperatures over any 10 year period as you describe. You are reading material from people who are deliberately misleading you.
The data come from this SkS post: CO2 lags temperature.
You should note that we have already increased temperature over 1C and are heading for 4C. 4C colder means a kilometer of ice over New York. What will the changes be from increasing temperature 4C??
Moderator Response:[DB] Reduced 2nd image width
-
Map at 15:52 PM on 2 February 20201934 - hottest year on record
I was not trying to imply, I am imploring. How is one supposed to learn when a question is deleted as "gosh gallop"? The quote that I had posted was listed in a few diffent sources that I have looked at. I do believe eclectic is correct that they were mostly in reference to Greenland's ice core analysis, however they are still prevelant in this discussion as they refer to a previous time of global warming because excess co2 was found in the core samples with an unknown source of why the co2 was that high. How is that not relevant to today's global warming if we are again seeing a rise in temperature due to co2? Why should that question be dismissed? What caused the rise in co2 to balance out 20000 years ago and slow the global warming back then without humans?
-
Eclectic at 12:26 PM on 2 February 20201934 - hottest year on record
Philippe ~ yes, sorry about that effort on your part.
Our good commenter "Map" was perhaps referring to the local regional temperature changes shown in Greenland's GISP2 ice core during the transient fluctuations of the Younger Dryas . . . and he was trying to imply that they were global climate changes "inexplicable by mainstream climate science". My first thought was that he might have been a newbie, grossly uninformed on the topic . . . though there was a wiff of sly science-denialist argumentativeness in his wording. And the latter case has become more evident (only much less sly! ) .
I am sure I am not telling you anything new in all this, Philippe. I just wished to put it on the record, for later readers who come along.
-
Philippe Chantreau at 10:02 AM on 2 February 20201934 - hottest year on record
Comment 111 was in response to a comment by Map that is now no longer visible in the thread. ????
Moderator Response:[DB] The comment in question was removed for being a Gish Gallop collection of off-topic and grandiose claims. Thank you, for attempting to answer it.
Prev 150 151 152 153 154 155 156 157 158 159 160 161 162 163 164 165 Next


