


 Arguments


Recent Comments
Prev 2402 2403 2404 2405 2406 2407 2408 2409 2410 2411 2412 2413 2414 2415 2416 2417 Next
Comments 120451 to 120500:
-
Doug Bostrom at 04:57 AM on 23 May 2010Unprecedented Warming in Lake Tanganyika and its impact on humanity
Si, you don't think Willis is swerving into misplaced concerns with absolute accuracy? Can you explain what he's writing about, if it's not absolute accuracy? Why are he and you, too, apparently so disturbed by by the relative paucity of calibration data? Regarding your later remark, the utility of criticism depends on its validity and ability to further progress. So far I've seen little evidence of that; Lindzen is about the best data point available but he appears to have become entirely fixated on a hypothesis that has proven unable to improve on others' work. -
Si at 04:41 AM on 23 May 2010Unprecedented Warming in Lake Tanganyika and its impact on humanity
Phila "The problem is that a small group of amateurs has decided to hold climate scientists to an impossibly high standard that most of them apply to no other field. Any science that tried to appease this degree of contrarianism would be doomed to stasis at best." I think not. The more critical we are the better the science will be. That papers get picked over and pulled apart (Teardown you call it in hardware) means that Climate Science will move out of the cosy club it has been and become a much more robust science. This site is helping in that by questioning your 'small group of amateurs' (I think Richard Lindzen et al might object to that description). -
Si at 04:27 AM on 23 May 2010Unprecedented Warming in Lake Tanganyika and its impact on humanity
doug. I dont think Willis makes the mistake you mention. He is having a critical look at Jessica's paper - thats what scientists do. I think he makes some interesting points and gets even better comments in the thread eg Hu McCulloch's- odo take a look. -
Si at 04:17 AM on 23 May 2010Unprecedented Warming in Lake Tanganyika and its impact on humanity
John the relevance of Langenberg to Tielney is that he is another young student studying the lake but comes to different conclusions - of course they are not attention headline grabbing ones but such is life. In brief (and not my summary but from Pat Moffat) • No evidence of increasing lake clarity as a result of secchi measurements since 1946 • The interplay of stratification and plankton productivity are not “straightforward” • Challenges O’Reilly’s assumption on the correlation of wind and productivity -the highest production is on the end of the lake with the lowest winds • A strong caution using diatoms as the productivity proxy (it is one of two different lake modes) • No ability to link climate change to productivity changes • More productivity from river than allowed for in Nature Geopscience article • Externally derived nutrients control productivity for a quarter of the year • Strong indications of overfishing • No evidence of a climate and fishery production link • The current productivity of the lake is within the expected range • Doesn’t challenge recent temp increase but cites temperature records do not show a temperature rise in the last century • Phytoplankton chlorophylla seems to have not materially changed from the 1970s to 1990s • Disputes O’Reilly’s and Verbug’s claims of increased warming and decreased productivity • Rejects Verburgs contention that changes in phytoplankton biomass (biovolume), in dissolved silica and in transparency support the idea of declining productivity. A large part of the lakes production may be picocyanobacteria -
Phila at 04:12 AM on 23 May 2010Unprecedented Warming in Lake Tanganyika and its impact on humanity
#86 "it might be good to dispell these "obvious" issues and not make assumptions about what the reader is inclined to believe." That sounds great in theory, but in practice it would be very hard to anticipate every single issue that a "skeptic" might seize on while looking for an excuse to downplay or disregard scientific findings. The problem isn't that Nature is making incorrect assumptions about its readership. The problem is that a small group of amateurs has decided to hold climate scientists to an impossibly high standard that most of them apply to no other field. Any science that tried to appease this degree of contrarianism would be doomed to stasis at best. -
Doug Bostrom at 03:37 AM on 23 May 2010Unprecedented Warming in Lake Tanganyika and its impact on humanity
RSVP, you think Nature is a journal aimed at the layman? It's not. Publishing in Nature guarantees an audience beyond any narrow domain of research but that audience is well versed in the practice and conventions of scientific publication. As you know. Temperature trends are a key metric of climate behavior. As you well know. -
RSVP at 03:29 AM on 23 May 2010Unprecedented Warming in Lake Tanganyika and its impact on humanity
Phila quotes doug_bostrom about my remark etc. "In reality, as Doug Bostrom says, if a problem of this type seems "obvious," there's a pretty good chance that it's not a problem at all." I see the article as directed to the less initiated (sort of an intro into this subject about the temperature of the largest lake in Africa). As such, it might be good to dispell these "obvious" issues and not make assumptions about what the reader is inclined to believe. Aside from this point, were'nt local temperature conditions suppose to be irrelevant in terms of proving or disproving global warming? -
Doug Bostrom at 03:28 AM on 23 May 2010Unprecedented Warming in Lake Tanganyika and its impact on humanity
Si, Willis appears to be committing a mistake that we (and especially folks at WUWT) should have left behind a long time ago. Willis is missing the forest while scrutinizing pine needles, conflating the significance of temperature trends w/ the importance of absolute accuracy of temperature measurements. The instant he latches onto problems with accurate calibrations is when he runs off the rails and misses the big picture. The fundamental objective here is to look for trends, not what exact temperature it was on a given day. Tierney necessarily needs to establish some sort of base temperature around which to hang the data she derived from her cores, but in point of fact that choice is not really important, it's the shape of the graph that is noteworthy. It's interesting to observe that comments on Willis at WUWT note the resemblance of Tierney's graph to others including of course Mann's famous example. They allude of course to incompetence, etc. because they have nothing else to say but fail to explain why so many sources of data should resemble one another in the shape they present when plotted. -
Doug Bostrom at 03:11 AM on 23 May 2010Unprecedented Warming in Lake Tanganyika and its impact on humanity
Si, it's worth thinking for a moment about what the implications would be if Tierney had -not- found a temperature signal resembling that found elsewhere. Really, take a moment to ponder that. Blame does not really enter into the equation. -
Si at 03:04 AM on 23 May 2010Unprecedented Warming in Lake Tanganyika and its impact on humanity
Another young student, Victor Langenberg’s 2008 thesis (Wageningen University) On the Limnology of Lake Tanganyika http://edepot.wur.nl/121977 should make for an even more interesting comparison.Moderator Response: Perhaps you're new here and don't know, if you provide a link to a paper or other resource at SkS you're expected to explain why you think it significant to the discussion. -
Si at 02:31 AM on 23 May 2010Unprecedented Warming in Lake Tanganyika and its impact on humanity
E at 79. I agree with the sentiment here -climate scientists are not incompetent or indeed involved in a conspiracy. But Jessica (at 30) admittted that again it is a case of blaming CO2 as the likely culprit. Hardly a convincing argument. -
Phila at 02:31 AM on 23 May 2010Unprecedented Warming in Lake Tanganyika and its impact on humanity
Skepticstudent, Please try to bear in mind that you're essentially accusing real people whom you've never met of incompetence or worse. Basic human decency would require you to offer very strong evidence, even if the scientific method didn't. You should also bear in mind that as you labor to discredit every single study you don't like by dreaming up alternative explanations, you're creating a highly counterintuitive picture: An accumulation of data from all over the world that combine, coincidentally, to present the "illusion" of AGW. At some point, you have to understand that this is a far more improbable scenario than the one you're so desperate to debunk. -
sylas at 02:23 AM on 23 May 2010Has the greenhouse effect been falsified?
I am very grateful for comments which have picked up a couple of errors in my original essay, now fixed. I will continue to accept corrections with thanks, and update the essay as appropriate to get rid of errors. I may not agree with all the criticisms or corrections suggested, however. I do not see any problem at present with the wording being used, which at the time of writing reads: When you look down from aircraft at 20km altitude (Fig 1a), what is "seen" is the thermal radiation from Earth that gets out to that height. Some of that radiation comes from the surface. This is the parts of the spectrum that follow a line corresponding in the diagram to about 268K. Some of that radiation comes from high in the atmosphere, where it is much colder. This is the parts of the spectrum that follow a line of something like 225K. The bites taken out of the spectrum are in those bands where greenhouse gases absorb radiation from the surface, and so the radiation that eventually escapes to space is actually emitted high in the atmosphere. The atmosphere's main IR window (the region of IR transparency) is around 800 to 1000 cm-1 in wavenumber, or about 10 to 12.5 microns in wavelength. Some of the radiation to space DOES come from the surface, and the wavelengths to look for surface radiation are those in this IR window. Wording can always be tweaked a bit, but I don't see any problem with what is there at present. The IR window in this specific case is almost all from the surface. The main point here is that we can observe the greenhouse effect at work. It is not falsified; it is a notion known from basic physics for well over a hundred years and it is now amply confirmed in measurements such as those I have shown and also such as those shown in the site linked by Berényi: IR Transmission Spectra. For example, take the midrange-IR spectrum shown for Mauna Kea, which matches most closely the range of Figure 1 in the blog. I show the image on the page, and below it a reversed image with wavenumbers written into the horizontal scale for a slightly easier comparison with the figure in the blog. I have also added a horizontal line at transmission level 1 (fully transparent).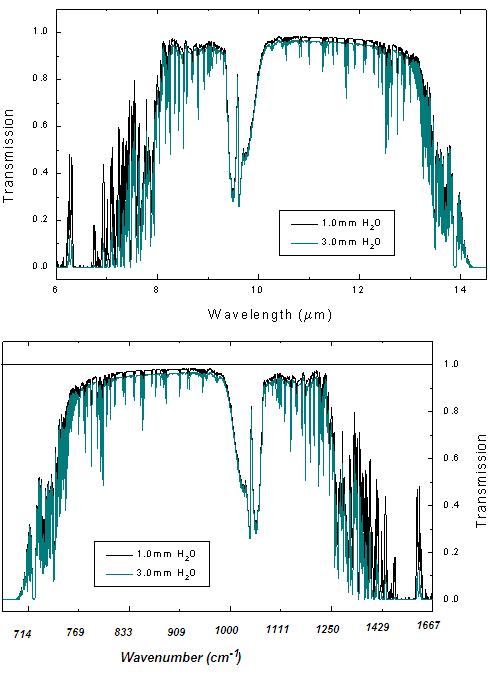 This also shows what is wrong with the specific criticisms made against Figure 1 in the blog. Berényi says:
On the other hand, since IR transmittance in window is ~80%, [...snip...]
It means the radiance curve in Fig. 1 can not be produced by actual measurement or if it was, what is shown is a scaled up version of values measured. Undocumented tricks like this are not helpful.
Figure 1 is produced by actual, unscaled measurement. There are no undocumented tricks. Your problem here is assuming the ~80% IR transmittance. That is simply not valid. You can see clearly that it is not the case in Mauna Kea data either. And while you are right that Mauna Kea is high altitude... why not also note that the Artic is high latitude? It makes a comparable difference.
Mauna Kea is at an altitude of 4200m, which is enough to get about 90% of the water vapour in the atmosphere; quite so! But it is also in a humid climate, where you have a high tropopause and lots of water vapour at low altitude. So sure; at low altitude in Hawaii you would have less IR transmittance (though you cannot assume a globally based mean figure will be a good specific estimate for this or any other location). But the Arctic regions, where the Fig 1 data was collected, have much lower specific humidity than Hawaii.
Even if you don't trust the data I have supplied, you need a much better basis for presuming it is inaccurate and presuming to scold on that basis. Be skeptical by all means. I will try to get hold of the actual data myself if I can and follow up. But please be assured that I am not deliberately distorting things.
You remain the most helpful contributor here for cleaning up errors in the blog post. I'd like to continue a constructive engagement. You are welcome to be skeptical, but without being overly sensitive... I'd really appreciate a bit more credit myself for not trying to be deliberately deceptive. Can we do that?
Cheers -- sylas
This also shows what is wrong with the specific criticisms made against Figure 1 in the blog. Berényi says:
On the other hand, since IR transmittance in window is ~80%, [...snip...]
It means the radiance curve in Fig. 1 can not be produced by actual measurement or if it was, what is shown is a scaled up version of values measured. Undocumented tricks like this are not helpful.
Figure 1 is produced by actual, unscaled measurement. There are no undocumented tricks. Your problem here is assuming the ~80% IR transmittance. That is simply not valid. You can see clearly that it is not the case in Mauna Kea data either. And while you are right that Mauna Kea is high altitude... why not also note that the Artic is high latitude? It makes a comparable difference.
Mauna Kea is at an altitude of 4200m, which is enough to get about 90% of the water vapour in the atmosphere; quite so! But it is also in a humid climate, where you have a high tropopause and lots of water vapour at low altitude. So sure; at low altitude in Hawaii you would have less IR transmittance (though you cannot assume a globally based mean figure will be a good specific estimate for this or any other location). But the Arctic regions, where the Fig 1 data was collected, have much lower specific humidity than Hawaii.
Even if you don't trust the data I have supplied, you need a much better basis for presuming it is inaccurate and presuming to scold on that basis. Be skeptical by all means. I will try to get hold of the actual data myself if I can and follow up. But please be assured that I am not deliberately distorting things.
You remain the most helpful contributor here for cleaning up errors in the blog post. I'd like to continue a constructive engagement. You are welcome to be skeptical, but without being overly sensitive... I'd really appreciate a bit more credit myself for not trying to be deliberately deceptive. Can we do that?
Cheers -- sylas
-
Si at 02:22 AM on 23 May 2010Unprecedented Warming in Lake Tanganyika and its impact on humanity
Skepticalstudent...looks like you agree with Willis then who concludes in his article "My point is, the Tierney 2010 report is a study of the change in Lake Tanganyika surface temperature over time, which contains no measurements of the change in LST over time, and which has exactly three actual surface temperature measurements, which are poorly cited, are from different parts of the lake, and are all from 2003 …" Jessica, is he right? -
Si at 00:52 AM on 23 May 2010Climate Change and the Integrity of Science: a letter to Science
Great thread! At 62. Monckhausen "We are running a small but fine blog taking on these deniers with something they do not have: humour" I thought those skeptics were pretty funny actually www.cartoonsbyjosh.com -
Unprecedented Warming in Lake Tanganyika and its impact on humanity
Skepticstudent writes "Did they know about the thermal vents at the bottom of the lake in numerous locations before they wrote this article and spent all that time?" Actually the authors were well aware of geothermal activity in the lake. The issue is addressed in their comments here. >"... I'm attempting as do the majority of skeptics to show that there are many natural causes that add to the whole." Why do you and a majority of skeptics constantly assume that climate scientists are so incompetent as to be unaware of this fact? You are shown to be wrong time and time again yet you continue to make these assumptions. -
mspelto at 20:51 PM on 22 May 2010Unprecedented Warming in Lake Tanganyika and its impact on humanity
In terms of the comments on Kilimanjaro glaciers, I referenced Rwenzori glaciers because they are closer and to the wetter environment, do not lose mass significantly via evaporation. Thus, it is only temp and ppt. that matter more typical. The glaciers are also at a lower elevation which yields climate more in line with their surroundings. -
Doug Bostrom at 17:40 PM on 22 May 2010Unprecedented Warming in Lake Tanganyika and its impact on humanity
Skepticstudent, you're not keeping up and you're making yourself look foolish. To wit: ....does one really have to worry about wattage output into the water to wonder if they could output heat into the lake? How much heat? You do realize, the heat energy released into the lake versus the mass of water contained in the lake determines whether the hydrothermal vents will have any significant impact on the temperature of the lake compared to other inputs? Right? So you need to quantify that or you're not making a argument with any effect. One would also have to admit that these thermal vents are pushing co2 as well as sulphur to the surface... Ok, that last statement is completely diagnostic of your traction problem. You need to start at the beginning. Read this: Weart's Discovery of Global Warming. See, getting your head around Weart's book or the complete equivalent is a prerequisite for conducting useful discussion of the entire topic of AGW including the little fragment we're treating here. You can't do long division before you know how to add and subtract. You can't be a "skeptic" without knowing enough about the topic to avoid making blunders such as imagining that C02 entering the lake from hydrothermal vents will somehow affect the temperature of the lake in the same way C02 in the atmosphere at large helps to control the temperature of the lake. Really, do yourself a favor and read Weart. It'll take you some hours but for anybody who is inclined to spend time noodling around on Google Scholar-- such as yourself-- it's actually quite entertaining. And it's free, the web edition that is. -
Riccardo at 17:18 PM on 22 May 2010Unprecedented Warming in Lake Tanganyika and its impact on humanity
skepticstudent, it could be helpful if you link directly to the paper instead of copy/paste author, title, affiliation and address. What Doug was trying to say, I guess, is that one has to be quantitative in their hypothesis. No one is saying that there is no volcanic activity in the lake. The point is the impact on the overall behaviour of the ecosystem. For sure Dr. Tierney and co-workers are well aware of the presence of vents in the lake and we can take it for granted that their hole was not digged near one of such vents, even if not stated explicitly. Remember, research papers have no didactic intent (by definition, i'd say). And while we are all welcome to have a read, it's absurd to criticize them for not being explicit enough on many things. Even worse if you question author's skill in doing accurate research. Do you really think you have something to teach them on how to choose the proper drilling site? Do you really think that one day they just dropped some instruments on a boat and start drilling at random? Not even a newbie fisherman would do this, his first question would be where to go. -
johnmacmot at 16:59 PM on 22 May 2010Unprecedented Warming in Lake Tanganyika and its impact on humanity
Skepticalstudent, you need to be a little more thorough in your research. You might find it informative to visit J Tierney's website (link in her first post above) where she comments on the influence of those thermal vents . "Besides one would have to assume that since there isn't much in the line of industry in Africa being the poorest continent in the world, where would the anthropogenic warming effect be coming from." That's not a serious comment, is it? You do need to do some very basic reading to clarify for yourself how CO2 and greenhouse gases affect climate and induce warming. -
skepticstudent at 16:47 PM on 22 May 2010Unprecedented Warming in Lake Tanganyika and its impact on humanity
regarding doug_bostrom that's my whole point. They don't really describe much about where exactly they took their 2 whopping samples. but one would assume that if they're taking samples from the lake bed that would be close to the vents which apparently are from all over the lake. when you're digging into sediment of a lake with Volvanic vents all over the place does one really have to worry about wattage output into the water to wonder if they could output heat into the lake? One would also have to admit that these thermal vents are pushing co2 as well as sulphur to the surface along with heat towers. One thing that seems to escape notice in this website by many people such as yourself is that I'm not trying to say this is a died in the wool for sure cause of any and all temperature inclines in the area. However to the opposite I'm attempting as do the majority of skeptics to show that there are many natural causes that add to the whole. Besides one would have to assume that since there isn't much in the line of industry in Africa being the poorest continent in the world, where would the anthropogenic warming effect be coming from. -
skepticstudent at 16:05 PM on 22 May 2010Unprecedented Warming in Lake Tanganyika and its impact on humanity
Thermophilic Sulfate Reduction in Hydrothermal Sediment of Lake Tanganyika, East Africa LARS ELSGAARD,l* DANIEL PRIEUR,2 GASHAGAZA M. MUKWAYA,3 AND BO B. J0RGENSEN4 Universite Pierre et Marie Curie, Paris 6,1 and Centre National de la Recherche Scientifique,2 Station Biologique de Roscoff, F-29682 Roscoff; France; Centre de Recherche en Sciences Naturelles, Station d'Uvira, Uvira, Zaire3; and Max Planck Institute for Marine Microbiology, D-2800 Bremen 33, Germany4 Received 21 October 1993/Accepted 18 February 1994 I just discovered this article that could possibly shed some light on this issue. I know I’m no PHD but it makes one curious. The Max Plank Institute is a pretty respected organization so it’s not like I’m speaking out of my ear. I googled: Hydrothermal vents in Lake Tanganyika, East African Rift system Pflumio, Catherine, Castro, Maryse, Boulegue, Jacques, Gente, Pascal, et al. Geology. Boulder: Jun 1993. Vol. 21, Iss. 6; pg. 499 And I came up with the above article from the Applied and Environmental Microbilogy journal. I'd be very curious where they did their coring for the thread article? Did they know about the thermal vents at the bottom of the lake in numerous locations before they wrote this article and spent all that time? -
Riccardo at 16:04 PM on 22 May 2010There's no empirical evidence
e, a constant forcing held forever will indeed results in a constat rise in temperature. When the forcing is applied and the temperature starts to increase the earth wiil progressively increase its thermal emission untill balance is reached again and the temperature stops increasing. Mathematically it is expressed by the term λΔT in the heat balance equation: C dΔT/dt = F−λΔT sooner or later this term will balance the forcing. Never overlook the stronger and faster negative feedback! :) -
Doug Bostrom at 15:56 PM on 22 May 2010Unprecedented Warming in Lake Tanganyika and its impact on humanity
Skepticstudent, lots of work but besides hydrothermal vents, what does it all have to do with the temperature of the lake, which is the actual signal being assessed? Regarding the hydrothermal vents, what is their output in watts and how much is that output capable of changing the temperature of the lake? In general you need to produce numerical results to be persuasive. You've got more work to do. -
skepticstudent at 15:49 PM on 22 May 2010Unprecedented Warming in Lake Tanganyika and its impact on humanity
Part II - The effects of windstorms on nutrient of Lake Tanganyka Effect of wind induced water movements on nutrients, chlorophyll-a, and primary production in Lake Tanganyika V. T. Langenberg,1∗ J. Sarvala,2 and R. Roijackers1 1Aquatic Ecology and Water Quality Management Group, Agricultural University, Wageningen, The Netherlands 2Department of Biology, University of Turku, Turku, Finland *Corresponding author: Aquatic Ecology and Water Quality Management Group, Agricultural University, PO Box 8080, Wageningen, the Netherlands; Tel.: +31-629433225; Fax: +31-317484411; E-mail: victor.langenberg@wur.nl Climate change decreases aquatic ecosystem productivity of Lake Tanganyika, Africa.Full Text Available By: O'ReiIIy, Catherine M.; AIinl, Simone R.; Plisnier, Pierre-Denis; Cohen, Andrew S.; McKee, Brent A.. Nature, 8/14/2003, Vol. 424 Issue 6950, p766, 3p; DOI: 10.1038/nature01833; There have been numerous peer reviewed articles that have talked about an increase of fish, including the one above. The only species of Cichlids that are declining are the rock fish that are suffering from their habitation being destroyed by erosion of rock shelve strata by over use of the area. Nature and Science are the only two journals that have any articles about global warming causing issues and they’ve been by the same authors, using similar test methods to this recent one. The latter not using any surface temperatures across the lake or more than two core samples. This lake is over 10,000 sq. miles. [pointless, irrelevant and insulting analogy removed] And if you notice, I even used information from a "Nature" article. -
skepticstudent at 15:48 PM on 22 May 2010Unprecedented Warming in Lake Tanganyika and its impact on humanity
Ok I have been ostracized for putting out information without evidence to back it up. I've done some considerable research over the last week or so since this originally came out. John was a little slow on the uptake on this one, no doubt to his eager anticipation of the Heartland institutes summit on Climate change last week. :-) So I'm breaking this down into two sections to make it short as requested by John C. Part 1. I have been researching this whole issue for the last couple of days. At someone's suggestion I went to check out the following article but unfortunately they only provide Abstracts through ProQuest and I can't afford to sign up for their membership. Hydrothermal vents in Lake Tanganyika, East African Rift system Pflumio, Catherine, Castrec, Maryse, Boulegue, Jacques, Gente, Pascal, et al. Geology. Boulder: Jun 1993. Vol. 21, Iss. 6; pg. 499 One would think that if there are active thermal vents that we've known about since at least 1990 this could have something to do with the issue. It would also appear that there is a massive overharvesting of fishing going on that makes the gillnetting/long lining of salmon look like a drop in the bucket. Also there is a massive problem with land use issues. Granted the last two issues are man caused but have absolutely nothing to do with AGW. I also read an article that shows that there have been higher than normal wind conditions which inevitably dry out the surface which is going to cause conflicting temperature anomalies. I’ve also read about Gustave the killer Croc which could be eating up large amounts of fish. A much more viable option than AGW, especially since the authors admit that they only took two samples from a huge body of water. http://search.ebscohost.com/login.aspx?direct=true&db=f5h&AN=38995750&site=ehost-live The above is a link to a scholastic database of a National Geographic Article. Is an interesting article about how the two major species of fish have major variances in population. Limnological variability and pelagic fish abundance (Stolothrissa tanganicae and Lates stappersii) in Lake Tanganyika P.-D. Plisnier Æ H. Mgana Æ I. Kimirei Æ A. Chande Æ L. Makasa Æ J. Chimanga Æ F. Zulu Æ C. Cocquyt Æ S. Horion Æ N. Bergamino Æ J. Naithani Æ E. Deleersnijder Æ L. Andre´ Æ J.-P. Descy Æ Y. Cornet Received: 24 June 2008 / Revised: 12 December 2008 / Accepted: 2 January 2009 / Published online: 2 February 2009 _ Springer Science+Business Media B.V. 2009 -
There's no empirical evidence
PaulK writes "So now ask yourself the question whether it is possible in terms of first law of thermodynamics to have an imbalance of TOA radiative energy for an infinite time which results in a finite (constant) change in planetary temperature" In reality, if you tried to extend this equation to infinite time, you would have to consider that the 1 W/m^2 forcing would disappear at some point. After that point the temperature will obviously go back down, and the first law of thermodynamics will remain unbroken. As long as we are dealing with timeframes << the lifetime of the sun (as we typically do), the equation is perfectly valid as is. -
Phila at 12:21 PM on 22 May 2010Unprecedented Warming in Lake Tanganyika and its impact on humanity
"It doesnt take much internet search effort to find that the level has changed historically and recently as well due to water being deviated by man." Not to pile on, but this sentence may be the best illustration I've ever seen of the problems with "skeptical" logic. Not only is there an assumption that you can rebut scientific papers by Googling, but there's also an assumption that the easier it is to Google an alleged counterargument, the more damning it is. In reality, as Doug Bostrom says, if a problem of this type seems "obvious," there's a pretty good chance that it's not a problem at all. True skepticism requires discipline, knowledge and humility. Unless it's backed up with actual evidence, a statement like "it is relatively easy to take a sample that will confirm what anyone may want it to confirm" comes across as a lazy -- and ultimately nihilistic -- attempt to muddy the waters, IMO. -
Doug Bostrom at 11:59 AM on 22 May 2010There's no empirical evidence
PaulK, I may be wrong but as far as I know Tamino has never been found wrong w/regard to posts he's made on his site. I think if you have sufficient force of your conviction behind you, you ought to hie yourself to Tamino's site, tell him you think he's presenting junk science and is insufficiently trained and then do your best to prove it. You delivered the insult, now you should defend it. You have no earned reputation for reliability whereas Tamino does, so really the onus is on you to establish yourself as a superior intellectual force. Failing that, I don't find your reliance on such remarks as "the author of that site is not well trained in basic science" at all persuasive and you are indeed wasting your time here. -
Doug Bostrom at 11:52 AM on 22 May 2010Unprecedented Warming in Lake Tanganyika and its impact on humanity
Johnd, I don't think I'm being hyperbolic or unnecessarily pejorative to categorize that remark as rubbish. Can you please state exactly where the study concludes "the primary productivity of the lake, both currently and for the past 1500 years, is solely a function of global temperatures?" If you can't do so, do you have the grace to retract your remark? -
Ron Crouch at 11:42 AM on 22 May 2010Unprecedented Warming in Lake Tanganyika and its impact on humanity
Without my having to say so David Horton has summed things up very nicely. Quote: "It would be nice to see, just once, a denier come to terms with the fact that we now have masses of evidence of very different kinds and from all over the world all of which support and strengthen each other." On their own the individual studies don't really represent that much, however when one starts to stitch them together and the mosaic begins to appear, the overall picture of the health of the planet starts to become clearer. But then I don't expect all to have an eye for Picasso, most prefer Rembrandt. -
David Horton at 10:26 AM on 22 May 2010Unprecedented Warming in Lake Tanganyika and its impact on humanity
Looks like in johnd we have another classic denier argument - that is that no sample, no sample size, is ever big enough or comprehensive enough to demonstrate global warming, in fact, it seems, no sample can ever BE big enough. Here is another independent study which matches what every other study shows, and it comes from a new and very different location. And it's not just one core sample, but two. Worth remembering that sediments by their very nature are averaging out conditions over wide areas and over time. And the response? Not enough samples. I am not a betting man, except on sure things, and I bet that if there had been three cores, 4 would have been demanded, 4 needs 5, and so on to an infinity of samples from every square metre of the lake floor. And we would then be told that this was just one lake, that we couldn't possibly conclude anything until a second lake had been cored. Oh, you have 2, 3 are needed, and so on. And then, what, only lakes in eastern Africa? Only lakes in Africa, southern hemisphere, the world? It would be nice to see, just once, a denier come to terms with the fact that we now have masses of evidence of very different kinds and from all over the world all of which support and strengthen each other. As Charles Darwin said, in a slightly different context, it would only take one example to prove the theory wrong. The converse is not true, cherry-picking in the sense that every individual study has to somehow completely stand alone with 0 error bars might be a recipe for delaying action on climate change, but it has nothing to do with science. -
johnd at 09:34 AM on 22 May 2010Unprecedented Warming in Lake Tanganyika and its impact on humanity
Ron Crouch at 09:08 AM, my understanding of the study is not whether the lake is warming or not, but rather that the primary productivity of the lake, both currently and for the past 1500 years, is solely a function of global temperatures, to the exclusion of all other local and regional factors, and thus can be taken as a proxy for anthropogenic climate change. -
Riccardo at 09:10 AM on 22 May 2010There's no empirical evidence
Doug, perhaps it's time to let Tamino spend his spare time more productively than these trivialities. ;) -
PaulK at 09:08 AM on 22 May 2010There's no empirical evidence
Doug-Bostrom, For my part, I would be grateful for you to invite (Dr?) Tamino or anyone else if they can contribute to the science questions raised here. I genuinely do not understand your second sentence. I was using the term "appears to be some sort of junk science site" only to describe the blogsite to which Riccardo referred me, not this site. I used this description because the article on that site appears to contain, well, junk science. And I have no idea what the "shiny dog whistle" metaphor refers to. Please clarify if it is helpful. Otherwise, I would prefer to stick to the science arguments. -
Ron Crouch at 09:08 AM on 22 May 2010Unprecedented Warming in Lake Tanganyika and its impact on humanity
Perhaps the latest study of global ocean temperatures which includes over 3200 Argo floats will help to convince you that the warming in Lake Tanganyika is consistent with enhanced global climate change. New Study Finds Ocean Warmed Significantly Since 1993 Quote: "The upper layer of Earth's ocean has warmed since 1993, indicating a strong climate change signal, according to a new international study co-authored by oceanographer Josh Willis of NASA's Jet Propulsion Laboratory, Pasadena, Calif. The energy stored is enough to power nearly 500 100-watt light bulbs for each of the roughly 6.7 billion people on the planet." -
PaulK at 08:53 AM on 22 May 2010There's no empirical evidence
Riccardo, If you show me a mathematical expression that says A=B and then argue that a respected climate scientist says that A= 2B, then I am not likely to be convinced by the argument just because he is a respected climate scientist. My questions and assertions are strictly science-based. I may well be wrong, but someone needs to demonstrate that I am wrong in terms of physics and mathematics - whoever he is. I am asserting (#68) that "the guy who runs that site", respected scientist or not, is making a statement which is demonstrably false in terms of basic physics. It is founded on his misunderstanding of what the F term means in Schwartz 2007. I spent some time in post #65 explaining what the F term does mean to give the Schwartz model (or energy balance model if you prefer) some meaning. It is the stacking of instantaneous impulse forcings. As such F(t) in this model does not equal Q(t) - E(t). The respected scientist assumes that it does, which is what leads him to a statement that is demonstrably false. -
johnd at 08:34 AM on 22 May 2010Unprecedented Warming in Lake Tanganyika and its impact on humanity
chris at 00:55 AM, the reason I focused on this particular aspect is because I do have some practical knowledge of what is required and involved with relation to the subject of taking of samples. Granted it is in a different field with different objectives, geophysical, mineral exploration, bulk commodities, natural fibres, where the objective is not to get a confirmation of what we assume we know, but to quantify what we don't know. We might assume that the ground might be able to support a heavy structure, and a test at one corner might confirm that, but often that will not apply to the other corners. Whether taking simple surface sediment cores or cores from deep below in the search for natural resources, there is a strict regime on what is required to satisfy firstly those who will decide whether to proceed further or not, and an even tighter requirement for it to become part of a bankable feasibility study, and then even tighter beyond that. In bulk commodities where a degree of consistency is easily assumed, there is an even stricter sampling regime that acknowledges the wide variation that can occur in all natural products. With natural fibres, wool in particular, it is accepted that the variation of micron within a single fleece is greater than the variation across the entire flock. Those who prepare the fleeces are well aware of this and often will go to one particular part of the fleece to extract a handful of wool that will make up a bale of special wool that ends up being awarded accolades as the worlds highest priced wool. However those who understand the game being played know that overall the flock that produced such wool is little different from the more run of the mill flock belonging to the next door neighbour. That might be comforting to those who wonder why the wool that gets pulled over their eyes often is so soft and subtle they are hardly aware of it's presence. ;-) In all fields it is relatively easy to take a sample that will confirm what anyone may want it to confirm is so desired, but in the field of commerce that desire is well recognised hence the strict regime and rules that apply, and it is from this perspective that I look to see if what is being presented as being representative of something bigger, does qualify in fact. Nothing more, nothing less. -
Doug Bostrom at 07:52 AM on 22 May 2010There's no empirical evidence
Perhaps it's time to invite Tamino here to work things out w/PaulK? PaulK, you may well end up wasting your time here if you swerve an iota further into such remarks as "junk science", shiny dog whistle though the term may be. -
Riccardo at 07:48 AM on 22 May 2010There's no empirical evidence
PaulK, the guy that runs that site is a scientist that regularly publish on climate. If you wish to give up learning some rather simple science or if you think you have a better knowledge than climate scientists, feel free to waste your time elsewhere. -
PaulK at 07:23 AM on 22 May 2010There's no empirical evidence
Riccardo, Sometimes, if you find yourself in a hole, it pays to stop digging. Your comment is wholly irrelevant to the question of what the F term means in the Schwartz model. Unfortunately, I am starting to suspect that you know that already. The site you referred me to for a "step-by-step explanation" appears to be some sort of junk science site, but in any event it is clear that the author of that site is not well trained in basic science. He is making the same conceptual mistake as you are in misunderstanding what the F term means in the Schwartz model, but he manages to “propagate” the error even further without making any attempt to question his own sometimes silly assertions. I quote from the site: Quote Now suppose that prior to our starting time, climate forcing was constant and equal to zero, and temperature departure was constant and equal to zero. After time t0, climate forcing increased to 1 W/m^2 and stayed there. Then the solution turns out to be: Theta(t) = (1 – exp(-lamda*t/C))/lamda Endquote It is hopefully evident to you that Theta (t), the temperature change from the forcing, must asymptote mathematically from this expression to a constant 1/lamda at large values of t. So now ask yourself the question whether it is possible in terms of first law of thermodynamics to have an imbalance of TOA radiative energy for an infinite time which results in a finite (constant) change in planetary temperature. If you can truly answer yes to this question , then I think that I am going to sign off, since I am wasting my time here. -
jenikhollan at 06:03 AM on 22 May 2010It's ozone
The second link (to science.nasa) for the quoted JGR paper works no more, its abstract is here. A fully accessible link to the Scientific Assessment of Ozone Depletion: 2006 might replace it - or directly its Questions and Answers (2 MB). Re#3: For rising temperatures see e.g. here.Response: I've updated the broken link, thanks for the heads up. -
jenikhollan at 04:55 AM on 22 May 2010CO2 emissions do not correlate with CO2 concentration
The rate of increase of CO2 levels had changed of course even in 1979 to 1982. It fluctuates a lot all the time, as visible from Mauna Loa or global data. This is due to due to the changing fluxes between atmosphere and other pools. A minor signal of yearly variability of human-emitted CO2 is scarcely detectable. A historic discussion of variability of concentration rise is within the Charles D. Keeling autobiography Rewards and penalties of monitoring the Earth from 1998. Excellent images on CO2, fossil fuels and the influences onto CO2 rise anomalies are within his 2005 Tyler Prize Presentation. A minor correction: Law Dome data have 2455 in its URL (the link within the text pointed to Tayler Dome, 2419).Response: Thanks for the heads-up, have fixed the link. -
Ned at 04:42 AM on 22 May 2010Climate's changed before
Rogerthesurf writes: In fact previous warmings disprove the hypothesis. That is a logical fallacy. Does the fact that previous fires were started by lightning disprove the hypothesis that a current fire was started by arson? I agree with the others above who say that you need to be more clear about exactly what it is that you're questioning. Be specific -- and if it's something that's discussed in its own dedicated thread on the site, discuss it there. Do you think CO2 is not a greenhouse gas? Or it is a greenhouse gas, but we're not increasing its concentration in the atmosphere? Or it is a greenhouse gas and we're increasing its concentration in the atmosphere, but negative feedbacks will keep the temperature uniform anyway? Unless you clarify what your question is, it's hard for others to answer it efficiently. -
Marcel Bökstedt at 04:00 AM on 22 May 2010Unprecedented Warming in Lake Tanganyika and its impact on humanity
Albatross> I must admit that I was relying mainly on John Cook's remarks on the glaciers of Kilimanjaro on this site. They still make sense to me. If you want to question this, why don't you go to that "skeptic argument" and repost there? Then we could try to figure out what is true in the proper thread. -
Climate's changed before
Roger writes "All that is in the explanation is a lot of theory which is not based on anything empirical" The explanation in this post describes how satellites have directly measured the change in the earth's outgoing and incoming radiation. This data does not come from models or theories, it comes from physical satellites with physical sensors which detect actual photons emitted from the actual atmosphere. None of this data collection process requires AGW to be true, photons are photons either way. This empirical data shows that CO2 in our atmosphere is absorbing and re-radiating energy just as predicted by AGW and associated theories. It is one of the strongest lines of empirical evidence underlying the theory. On top of this compelling evidence, past climate change is itself empirical evidence supporting the AGW theory. AGW and the theories underlying it predict a specific relationship between the earth's temperature and the various forcings that are theorized to affect it. This relationship can be confirmed or disconfirmed by examing reconstructions of the earth's climate and its various forcings. There are multiple independent methods for arriving at these reconstructions, none of them rely on AGW to be true. In general, the reconstructions depend on basic physical relationships between ambient temperature and various physical processes on earth. The reconstructions are created by observing actual physical evidence taken from the actual physical world, they do not come straight from models or broad theories. These independent methods all converge to the same picture of our climate's past, and are uniquely consistent with the predictions of AGW and associated theories. The same applies to observations of temperatures and forcings made within the past century, which, thanks to modern technology, can now be observed directly. -
Doug Bostrom at 03:11 AM on 22 May 2010Unprecedented Warming in Lake Tanganyika and its impact on humanity
Second Riccardo's remark regarding the rift. Do more work before launching speculations. Again, use BP (our BP, not the oily BP) as a model for emulation. Though BP is frequently wrong he comes up with original ideas, puts a lot of effort into his ruminations, has good math chops (better than mine, that's for sure) and is also (and this is a key point) capable of recognizing and acknowledging those times when he's obviously incorrect. It's not guaranteed of course, but generally if you see a blindingly apparent feature such as the African Rift unmentioned in a paper you may safely conclude that it's not relevant. It helps to remember, though in the space we occupy here there's an artificial atmosphere of controversy, in the actual mainstream research community anthropogenic warming is not even slightly controversial, so it is not considered necessary to explicitly address every possible niggling objection that may be raised by folks unprepared to understand or accept research findings. -
Riccardo at 02:43 AM on 22 May 2010Unprecedented Warming in Lake Tanganyika and its impact on humanity
RSVP, as for the rift, i'd not call skepticism when not reading the information available. Indeed, you should read Tierney's page she linked before and, if not convincing, eventually comment on the explanation provided there. -
RSVP at 02:30 AM on 22 May 2010Unprecedented Warming in Lake Tanganyika and its impact on humanity
Maybe I missed it somewhere, but I did not see any mention of this lake's level lowering and a possible correlation to temperature. It doesnt take much internet search effort to find that the level has changed historically and recently as well due to water being deviated by man. Down at the bottom of the lake there just happens to be a continental rift as well. The lake's temperature therefore doesnt seem like the best example for convincing Skeptics (like me). -
chris at 01:15 AM on 22 May 2010Unprecedented Warming in Lake Tanganyika and its impact on humanity
ooops...can I point out that in my post 57 above [under (iv)], when I say "sea surface temperature" I mean "lake surface temperature"!
Prev 2402 2403 2404 2405 2406 2407 2408 2409 2410 2411 2412 2413 2414 2415 2416 2417 Next


