


 Arguments


Human-caused climate change is unmistakably distinct from Earth’s natural climate variability
Posted on 14 April 2026 by Guest Author
This is a re-post from Staying Curious by Dean Rovang
This post presents two figures that are the culmination of an extended effort to build the strongest possible empirical case for what the paleoclimate record shows about CO? and temperature. They draw on five independent regression fits across four independent archives and 66 million years of geological evidence. The argument stands on its own merits.
Earth’s natural climate relationship
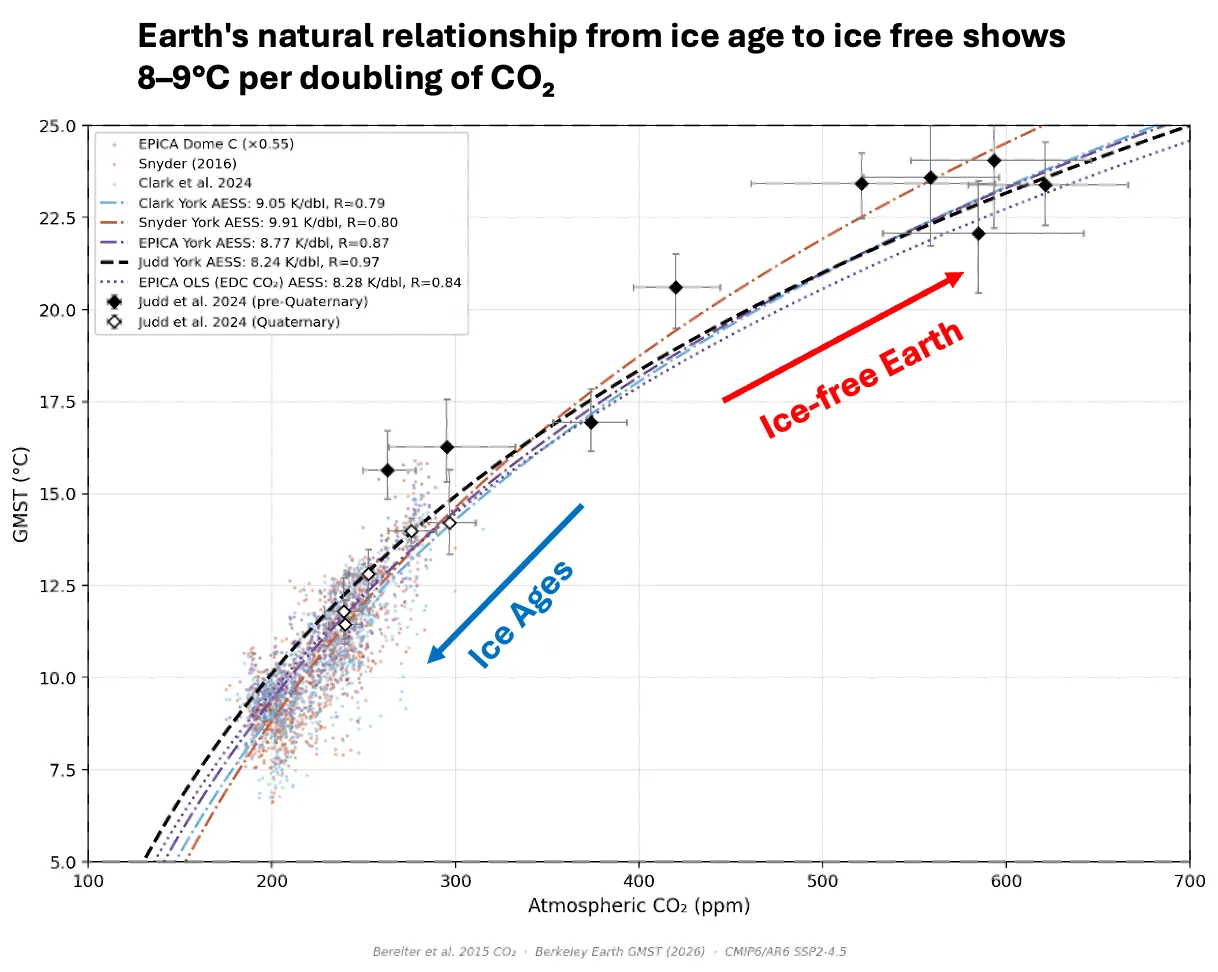
Three completely independent temperature reconstructions — the EPICA (European Project for Ice Coring in Antarctica) Dome C ice core, the Snyder (2016) Bayesian stack of 61 marine sediment cores, and the Clark et al. (2024) area-weighted reconstruction of 111 marine sediment cores — are plotted against the same CO? record on common axes. All three share Bereiter et al. (2015) as their CO? source, the best available composite for this period. The geological stages from Judd et al. (2024) extend the record to 66 million years.
Five regression fits are shown. Four use York/ODR regression — the method that accounts for measurement uncertainty in both CO? and temperature simultaneously, and the method used by Judd et al. themselves. The fifth is the canonical EPICA OLS fit using the original EDC CO? source, included because it was the first fit introduced relative to the Judd curve and remains the most conservative estimate in the set. All five land between 8.24 and 9.91 K/doubling of CO? — the same tier regardless of dataset, CO? source, or regression method.
The figure spans Earth’s climate from deep ice ages — CO? near 175 ppm, global temperatures near 8°C — to the warm Cenozoic periods when there were no significant continental ice sheets and sea levels were 60–70 meters higher. A natural question is whether the ice-albedo feedback drives this slope — and whether it therefore only applies to glaciated climates. The figure addresses this directly: most of Judd’s data comes from greenhouse climates with little or no continental ice — the Eocene, Oligocene, early Miocene — yet the same slope holds across the full range. If ice-albedo were the dominant driver, the relationship should look different in ice-free regimes. It does not, which Judd et al. themselves describe as surprising. The relationship appears to be a fundamental property of the Earth system across a wide range of boundary conditions, with and without ice sheets.
The 1850 hinge point: where modern climate change departs
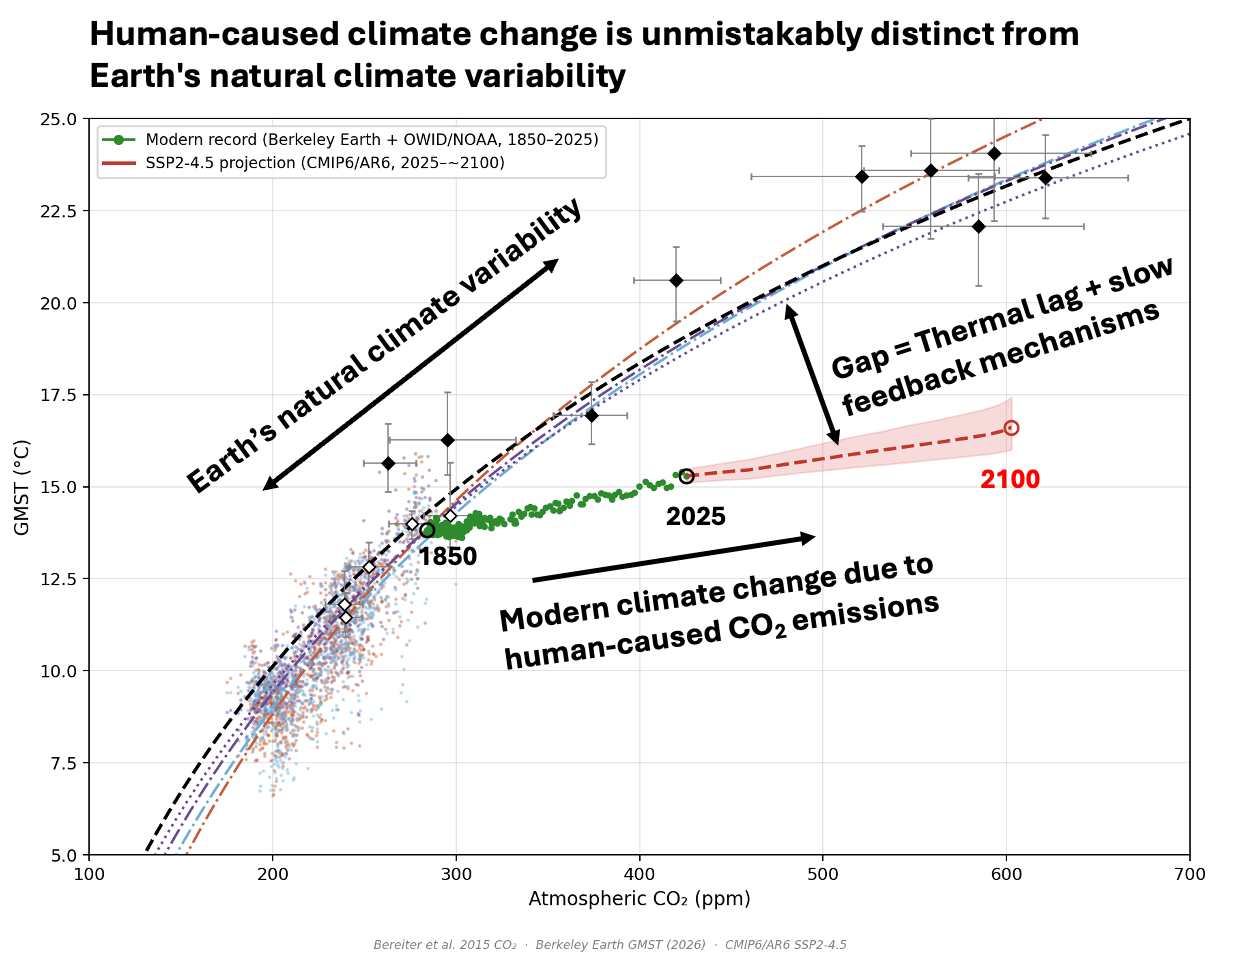
Figure 2. The same natural CO?–temperature relationship as Figure 1, with the modern instrumental record (green, Berkeley Earth + OWID/NOAA, 1850–2025) and SSP2-4.5 projection (red, CMIP6/AR6, 2025–∼2100) added. Open circles mark 1850, 2025, and ∼2100. The gap between the modern trajectory and the natural equilibrium fits reflects thermal lag and slow feedback mechanisms — not a change in the underlying physics.
Figure 2 adds the modern instrumental record and the SSP2-4.5 projection to the same axes. At 1850, the modern record begins exactly where the natural relationship sits — the hinge point where Earth’s climate history meets direct measurement. From there, CO? rises rapidly while temperature lags behind, driving the system into a region of CO?–temperature space with no analog in the natural record.
The gap between the modern trajectory and the natural equilibrium fits is labeled directly on the figure: thermal lag and slow feedback mechanisms. The fits in Figure 1 reflect the apparent Earth System Sensitivity (AESS) — Judd et al.’s term for the empirical CO?–temperature relationship across states where all feedbacks, including slow ones like ice sheets, vegetation changes, and carbon cycle responses, have had time to fully operate. Those slow feedbacks operate on timescales of millennia, not centuries. The gap is not a simple warming commitment. It is the distance between where the system currently sits and where the physics ultimately points, given enough time.
The figure also raises the question of reversibility — one of the most important questions in climate science. Will the system eventually return to the equilibrium curve? If so, where on the curve? How long after net-zero emissions is reached? What is the path, and what are the impacts along the way? The system will tend toward the equilibrium curve as long as CO? remains elevated, but the journey operates on geological timescales. The destination on the curve is determined by the CO? concentration at which the system eventually stabilizes — which is precisely why the timing of net-zero matters so profoundly. Sea level rise, driven by slow ice sheet dynamics, will continue for centuries regardless of when emissions reach zero. These are not hypothetical futures — they are physical consequences already set in motion.
The modern trajectory does not move toward the equilibrium curve. At any given CO? concentration, the gap keeps growing as CO? rises faster than temperature can follow. The only way to stop that gap from growing is to reach net-zero CO? emissions. The longer it takes to get there, the higher the CO? concentration at which the system stabilizes — and the higher the equilibrium temperature the physics ultimately points to. Clark et al. (2016) showed that decisions made in the next few decades will lock in sea level rise, ice sheet loss, and temperature change that persist for thousands of years — well beyond any planning horizon human civilization has ever contemplated. The equilibrium curve does not forget where we sent it. The physics does not negotiate on timeline. It only responds to what is in the atmosphere.
The bottom line
Five independent fits of Earth’s natural CO?–temperature relationship — derived from different archives, different methods, and different timescales — all land in the same tier. That relationship holds from the depths of the ice ages to warm greenhouse climates with no continental ice, across 66 million years of Earth history. The modern trajectory departs from it at 1850 and has not looked back. The departure is not subtle, not a matter of interpretation, and not an artifact of any single dataset or method. It is unmistakable.
Sources
Full sources in the preceding post: justdean.substack.com/p/unprecedented-in-66-million-years
Clark et al. (2016). Nature Climate Change, 6, 360–369. https://doi.org/10.1038/nclimate2923


But other data shows less of a link to CO2. https://pureadmin.qub.ac.uk/ws/portalfiles/portal/676577731/revisit_2.pdf, https://www.nature.com/articles/s41586-025-10032-y.
[BL] You fail to explain what it is you expect people to see at those links. The Comments Policy is explicit:
No link or picture only. Any link or picture should be accompanied by text summarizing both the content of the link or picture, and showing how it is relevant to the topic of discussion. Failure to do both of these things will result in the comment being considered off topic
Your first link is to an unpublished manuscript, written by a lecturer in a university business school. This person appears to have no background in climatology or carbon cycles. There is no reason to think that he has anything useful to add to the science.
The second link leads to a paywalled paper. The visible abstract discusses ice core records of CO2 and other gases, but gives absolutely no indication that they make any detailed examination of links between CO2 and global temperature.
Moderator Response @1,
The amateur analysis of 'global average' temperature linked @1 by rkcannon is entirely naive in its method and in its reporting of conclusions.
It concludes "...the notion that CO2 is the primary driver of global warming. If this were the case, periods with higher CO2 emissions would exhibit a faster rate of warming than periods with lower emissions," pointing to what the amateur calls his finding that "...long-term temperature rise was steeper in earlier periods when CO2 emissions were modest compared to current levels. These results hold despite changes in how time periods are defined ... and how weather stations are selected ... .")
The grand analysis supporting such a bold assertion looked at 100, 500 and then 992 selected weather stations (so all land sites), selected for the level of data available and then calculates the temperature trends for 42, 35, 30 & 21 year periods. The 100 station results presented show the temperature trends for the latest periods are by far the steepest in two centuries under analysis, 1815-2024. (42y +0.24ºC/decade, 35y +0.25ºC/dec, 30y +0.33ºC/dec, 21y +0.41ºC/dec) which of course entirely contradicts the conclusions presented in the analysis.
So that's worse than "amateur"!!
The other link @1 by rkcannon is to Marks-Peterson et al (2026) which is paywalled but an associated paper Shackleton et al (2026) 'Global ocean heat content over the past 3 million years' is not. These two papers drew coverage at RealClimate. Both papers examine very very old ice which provides data with less accurate age such that ice age cycles are fuzzed out.
The two papers are pointing to a more complex cooling 3My-0,5My bp. From the press release:-
Somehow there are crazy folk gleaning straws from the science to present misguided support for their crackpot version of reality. The account of Marks-Peterson et al (2026) nailed-up on the rogue planetoid Wattsuppia was headlined 'Shock New Evidence Showing No Link Between CO2 and Temperature Over Last Three Million Years Stumps Net Zero Activists' and such coverage prompted a few grownups to explain the true implications fo the two papers.
[BL] Thanks for taking the time to dig further than I had the patience for. Just the abstract of the first paper was enough to convince me that the author had no idea what he was talking about. From your description, it seems that he has no idea about time scales and can't differentiate between short-term variation and long-term trends. Of course, that error is common in the contrarian literature (e.g., Salby).
As for the second paper, I'm shocked to find out that there is gambling going on here a contrarian is taking a paper out of context. In the past, rkcannon has used NoTricksZone as a source of information. That source rarely gets anything right.
Rebuttal: Systems Analysis vs. Circular Reasoning
Subject: Response to Moderator Comments regarding Bhatta (2024) and Marks-Peterson (2026)
While the ad hominem labels—"amateur" and "naive"—provide a look into the moderator’s temperament, they do not address the physical and statistical discrepancies presented. As a Professional Engineer (PE), I prefer to evaluate the Transfer Functions of a system rather than the consensus of the "grown-ups."
1. On Circular Reasoning and System Gain
The moderator admits that the Nature paper (Marks-Peterson et al., 2026) requires "important contributions" from albedo and ocean circulation to explain a 2.5°C cooling while CO2 remained stable.
The Logic: To claim CO2 is the "key" control knob, only to demote it to a "passenger" whenever the data shows the planet cooling without its help, is circular reasoning.
The Math: Since the early 1900s, human CO2 emissions have increased by over 1,700%. If a seventeen-fold increase in the supposed "driver" results in a warming rate statistically similar to 1910, a rational systems analysis concludes the system is insensitive to that input.
2. The Failure of "Aerosol Masking"
The argument that mid-century cooling was "masked" by aerosols fails the spatial and modern test.
The Discrepancy: If industrial aerosols were a primary "cooling shield," China—with the world’s highest coal-related aerosol loading—should have been a global cool spot. Instead, China has warmed faster than the global average.
The Conclusion: You cannot invoke a "masking shield" to explain the 1940s cooling while ignoring its failure to stop warming in modern Asia. This is curve-fitting, not physics.
3. The Measured Driver: Albedo and the CERES Data
The moderator’s focus on 21-year surface trends ignores the most robust data set we have: the CERES satellite record.
The Data: Since 2000, CERES has measured a 0.8% drop in Earth’s albedo. This change in reflectivity has added roughly 2.7 W/m2 to the Earth's energy budget—effectively 100% of the warming forcing that the IPCC attributes to CO2 over the last 250 years.
4. The Missing "Fingerprint" and UHI Bias
If CO2 were the driver, the laws of physics dictate a "Tropical Hot Spot" in the upper troposphere. Decades of radiosonde and satellite data show this fingerprint is missing. The warming we do see is surface-based and highly correlated with Urban Heat Island (UHI) contamination. When you "homogenize" data by forcing rural stations to match urban trends, you aren't measuring global climate; you're measuring the encroachment of asphalt on thermometers.
Conclusion
Rational skepticism demands that models reconcile with empirical history. If the planet cooled 2.5°C with no change in CO2 in the Pliocene, and cooled for 40 years during a CO2 surge in the 20th century, the "Control Knob" theory is functionally dead. It is fascinating to watch the "Immune System" of this forum react; the Killer T-cells are working overtime to neutralize empirical data that looks like a "foreign invader" to the dogma. Nature doesn't care about your PhD or your moderation policy if your math is wrong.
[BL] Now you are bordering on moderation complaints, which are always off-topic. Again, read the Comments Policy.
You are also confusing moderators comments from other people's comments. You are also are bordering on inflammatory tone.
Your post also shows much of the same confusion apparent in the first link you provided: a lack of understanding of the carbon cycle and time scales. It is not emissions that matter - it is CO2 levels in the atmosphere. Emissions only form part of that equation, and human emissions only form part of the overall emissions.. People that understand the carbon cycle understand that the increases in human emissions represent a change from the natural balances, resulting in s slow increase in total atmospheric CO2. That slow rise in atmospheric CO2 is the "driver" involved, not emissions.
As for the regional effect of aerosols: aerosols don't always stay where they are emitted. But they do have a larger effect locally, and the cooling effect - as well as the subsequent warming effect as China has reduced aerosol emissions - are well-documented in the literature.
The CERES data does not mean what you think it means. RealClimate has a recent post on this topic. Of particular interest is the error they point out in recent contrarian presentations of this "controversy". RealClimate also has a slightly older post specifically addressing the CERES forcing.
You are also repeat an old trope about the Tropical Hot Spot. You can read more about it here. Although that post is rather old now, so is the contrarian talking point.
Your argument about Urban Heat Islands is as bogus as your other claims. Homogenization does not force rural temperatures to follow urban ones. You can learn more by reading this post. It has several useful links at the bottom to more detailed discussions of things such as adjustment to temperature records.
Your closing paragraph basically amounts to a "climate has changed before" argument, which is debunked here.
Nature doesn't care how many times you repeat old, tired, debunked contrarian talking points.
Addendum: You seem to feel that the global temperature record is contaminated by urban effects (UHI), but you seem perfectly comfortable in using that temperature record to make claims of model errors, contributions by albedo effects, aerosol masking, etc. This is typical of so many contrarian lists: data are good when you think they show what you want them to show, but data are bad when they go against your preconceived notions. The inconsistency is, well, inconsistent.
Rkcannon @3 ,
You are being very droll.
Other than for your own whimsical humor, do you have a reason for again visiting these points which have been refuted many times before ?
You seem to be fighting old battles, without providing any new insights or valid arguments to support yourself. Why do so?
Regarding rkcannons comments and the moderators accurate response. I have long suspected a large propotion of the climate science denialists might be getting certain things wrong at least partly due to an innate or deeply seated difficulty they have with multi factorial situations, where an outcome is a result of a combination of multiple factors operating simultaneously. I have now tracked down some science that backs this up and added this at the end.
Some examples of this page. rkcannon essentially claims that the anthropogenic warming theory is wrong because warming was strong early last century despite CO2 emissions. But the reasons for strong warming early last century were a complicated combination of CO2 and multiple other natural cycles and natural factors acting simultaneously, and the limited atmospheric concentrations of CO2 at that time. There are studies on this easly found by an internet search.
rkcannon mentions China is still warming despite its use of coal burning that generates cooling aerosols. But this is due to a complicated combination of factors, many discussed by the moderator.
The denialists have had all this explained to them many times yet persist with their denialism. I suspect some people (particularly a large proportion of the climate denialists) find holding multi factorial issues in their heads difficult, despite often being well educated people. It might be a basic psychological difference between people. Like how some people are good at multi tasking and some aren't. This might partly explain their stubborn denialism. Im not sure if this would apply to rkcannon but it looks like it applies to some people.
I asked an AI about this and the response is as follows and includes specific references to key researchers:
Short answer:
Yes — there is published science showing that some people, even highly intelligent ones, have difficulty understanding situations where multiple interacting factors produce an outcome. This difficulty is not simply about “intelligence” but about specific cognitive skills, cognitive styles, and limits in working memory and reasoning.
1. Intelligence ≠ Systems Thinking
General intelligence (often measured as g) predicts problem‑solving in many areas, but systems thinking — the ability to understand interactions, feedback loops, and multi‑cause outcomes — is a separate cognitive skill.
Research in cognitive psychology and decision science shows that people can be strong in abstract reasoning yet weak in:
Integrative complexity (ability to hold multiple perspectives at once)
Causal reasoning (understanding how multiple causes interact)
Systems reasoning (thinking in terms of networks, not linear chains)
These are partly independent of IQ.
2. Working Memory Limits
Complex situations require holding several variables in mind simultaneously. Studies in cognitive load theory show that people vary widely in working memory capacity, which strongly affects their ability to reason about multi‑factor problems.
Even very intelligent people can have:
Lower working memory span
Difficulty tracking interacting variables
A tendency to oversimplify to reduce cognitive load
This leads to “single‑cause thinking” even when the person is otherwise bright.
3. Cognitive Biases That Block Multi‑Factor Understanding
Humans naturally prefer simple explanations. Several well‑documented biases contribute:
Simplicity bias — preference for one clear cause
Attribution error — overemphasis on personal causes vs. situational ones
Confirmation bias — selecting the cause that fits one’s existing beliefs
Narrative bias — preferring tidy stories over messy realities
These biases operate regardless of intelligence.
4. Need for Cognitive Closure
Some people have a stronger psychological need for quick, definite answers. Research on need for closure shows that individuals high in this trait struggle with:
Ambiguity
Multi‑factor explanations
Probabilistic reasoning
They prefer a single, decisive cause even when the situation is inherently complex.
5. Published Research Areas Supporting This
There is substantial scientific literature across several fields:
Cognitive psychology — working memory, causal reasoning, integrative complexity
Decision science — multi‑attribute decision‑making, heuristics and biases
Systems thinking research — especially in education, engineering, and management
Neuroscience — showing that multi‑factor reasoning activates networks associated with cognitive control and abstraction
Key researchers include:
Daniel Kahneman & Amos Tversky (cognitive biases)
Philip Tetlock (integrative complexity)
John Sterman (systems thinking)
Keith Stanovich (rationality vs. intelligence distinction)
6. Bottom Line
Some people — even very intelligent ones — genuinely struggle with multi‑factor, complex situations because:
Systems thinking is a distinct skill
Working memory varies between individuals
Cognitive biases push toward simple explanations
Some people have a psychological preference for certainty
This difficulty is not a sign of low intelligence, but a reflection of how differently human minds handle complexity.
-------------------
Normally I do not post AI responses but I think it makes sense on this issue and I dont have time to write an essay in my own words, and it includes a list of researchers people can look up.
[BL] Use of AI-generated text is not explicitly banned by the SkS Comments Policy (yet), but we would request that its use be limited - and clearly identified (as you have). The last thing we want is to turn the comments section here into a battle of the AI generators.
Given that AI is known to hallucinate, have you actually checked to see if the names on the list of "key researchers" it generated actually exist and have written on the topics the AI clams to have found? Links to actual papers would be far more convincing that a few unrecognizable names.
Correction of typo: rkcannon essentially claims that the anthropogenic warming theory is wrong because warming was strong early last century, despite yearly CO2 emissions being quite low at that time. ( as were total atmospheric CO2 concentrations)
I remember the diagram from an earlier thread and I'd like to revisit it. The diagram shows 600 ppm and roughly 22C on the black curve and overlayed text says thermal lag and slow feedback mechanisms. Thernal lag: yes, certainly. But feedback increases CO2. It does not lead to the black curve, it "merely" extends the red curve to the right.
As the author, Dean, points out, that's even worse because we can potentially get further up via the black curve. But that will require oceans to warm from their current 2-3C to 15 C or more. Dean points out feedbacks take millenia. But again that's rightward not upward on the chart. The omnipotent AI says that equilibrium response of the deep ocean is approx 1500 years. But that's simply the turbulent mixing timescale.
The much discussed AMOC is connected to the SMOC. AMOC changes could affect SMOC and vice versa. SMOC overall is 2-3x AMOC as measured in Sv (million cubic meters / sec of water movement). Ironically it is the slowdown of SMOC in particular that would extend the 1500 years. AMOC is more complex with weaker AMOC increasing heat storage efficiency.
I find if I pound on the AI enough it will finally find some (admittedly tentative) support for my claim:
Basically that's due to more open water in autumn leading to a larger heat loss along with the ability of (projected) fresher Arctic surface water to freeze faster. Bottom line is we are talking millenia of thermal lag. My own professional use of nascent AI leads me to the conclusion that millenia simply do not matter at all anymore. I used to think a century mattered, but even before current AI I recognized the acceleration of technology. As of now, the only thing slowing AI down is slow humans. AI itself will solve that problem for better or worse. I think for the better, but I've always been an optimist.
Eric @7 : you intrigue me. How will A.I. itself "solve that problem for better or worse"? Sure, the human psychology being what it is . . . we do need some sort of "savior" to effect a rapid & politically-acceptable technology that will quickly achieve Nett-Zero emissions in a few decades. But what could that almost-miraculous technology be? As yet, fusion-power seems to be starting the race a long way behind the starting line.
Nigel @5/6 :
Thank you. And much of what you (and the A.I.) mention boils down to Motivated Reasoning ~ which does not arise from a low I.Q. but very much from emotionally-driven thinking i.e. the confirmation bias & cherry-picking of aspects of climate science.
More interesting, I reckon, is the underlying causation of such thinking ~ is it from tribal hatred of the rest of humanity, or is there a degree of individual narcissism [ USA political comment omitted at this point! ] or other causation of intellectual failure?
Therefore I am keen to learn whether climate science denialists have some insight into their own style of thinking. And whether they can be bold enough to publicize their inner thoughts & self-understandings.
[BL] Motivation and politics is really starting to wander off topic.
Eclectic, AI is not the savior to achieve net zero in the next few decades. What AI will do is greatly accelerate already accelerating technological progress. Right now what I've seen and done is mostly in SW. AI can be guided to create extremely complex SW which no human needs to review in detail. Luckily I am in the end stages of my SW career so I don't need to figure out what to do when AI does everything and more. I've read plenty of debates online about AI taking over SW development or not and some people get it. But many do not. They believe AI does "grunt work". But at its more productive, AI runs the show and humans actually do a lot of the grunt work.
New SW can help with lots of energy related efforts like smart grid, resource optimization, turbine optimization, smart ag, etc. Plus resilience. But for net zero HW is also needed. AI plays a role in that too with materials science innovation like modeling and simulation for materials discovery, e.g. at IBM research.ibm.com/topics/materials-discovery The work is early but will become more widespread and accelerated. But as the AI itself tells me:
But the AI points out:
I think the AI meant to say "yours" in that quote. While I brought up the fact that AI could go awry, that's also a possible cheap excuse to "not do anything" so I really should not have brought it up. Capitalism is critically debated in this forum for flaws like unpriced externatlities. AI should have the same treatment. In fact as an accelerator, AI goes hand-in-hand with capitalism. And it uses lots of energy. But keeping it safe is mostly a separate issue.
[BL] AI is also getting rather off-topic.
Eric (skeptic) @7,
I was a little taken aback in your comment by you saying in the context of 'slow feedbacks' that "feedback increases CO2." That is not the normal understanding of 'slow feedbacks' which are the main difference between ECS & ESS.
Folk are usually rather vague about the nature of the things dividing ESS from ECS but carbon feedbacks isn't what I find mentioned (as per here). It's usually the changing vegetation & ice cover that gets the mention, along with deep ocean warming. Melting ice/permafrost and oceans will have an associated thermal-lag element but I can't see that aspect being very great. This suggests the big part of Δforcing remaining out-of-equilibrium after ECS arrives is albedo changes.
I see two points of note - (1) The value of ESS & (2) Its relevance to the AGW situation.
(1) The main evidence supporting a significant ESS is of course the temperature and the CO2 records. And those don't come with labels showing the Δforcing involved in ESS. However, they do show ESS significantly above the usual range of ECS values (ECS =+2.0ºC to +4.5ºC) although there remains the "fat tail" in ECS analyses which sits yet higher.
The accounts of ESS have in the past put ESS = 1.5 x ECS or ESS = 2 x ECS, whatever that means number-wise. The analysis is usually applied to pre-ice age data although the OP above has also used mainly ice-age data-points and spliced them onto Judd et al (2024). (The OP figures show the Cenozoic data points of Judd et al below 700ppm CO2. So not shown is the seven Cenozoic points at higher CO2 levels. If these high points were missing also from the OP's analysis, it may explain the discrepancy between the Judd ESS [+7.7ºC] and the OP ESS [+8.2ºC].)
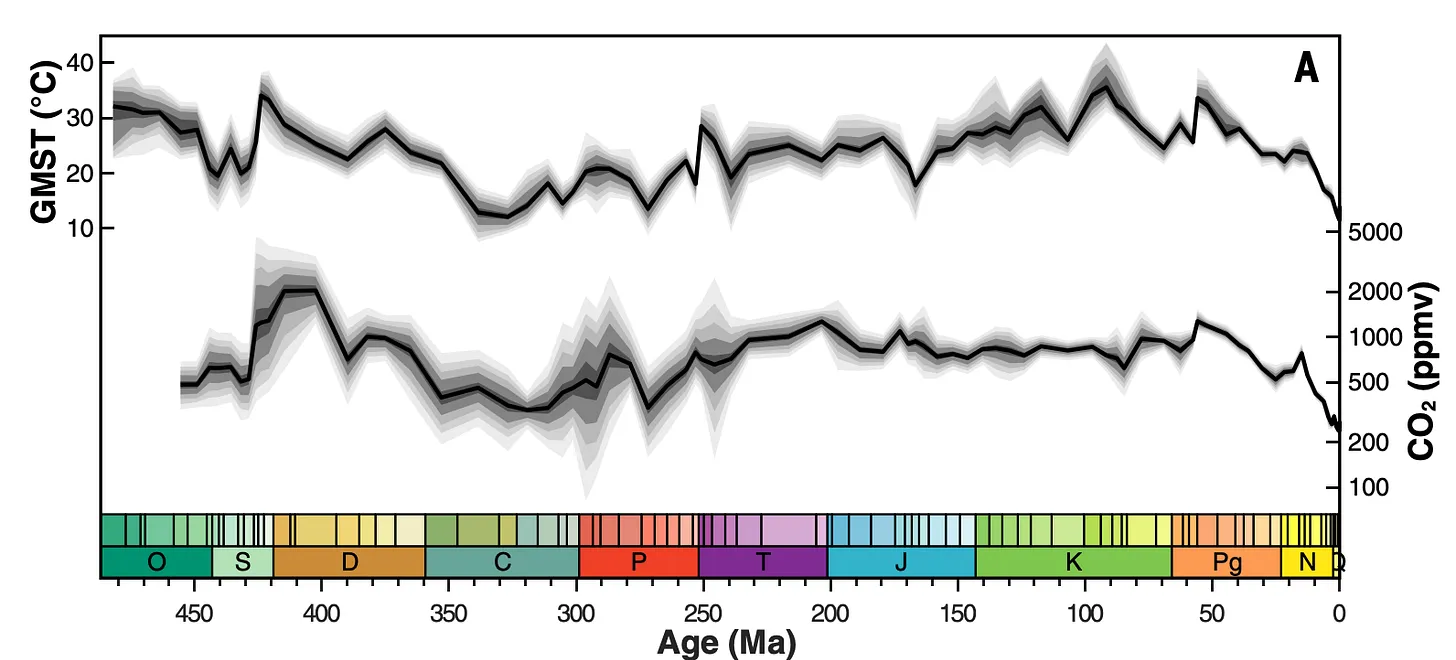
Judd et al (2024) Fig 4b
Of course, the ESS analyses are dependent on these temperature and CO2 reconstructions. And there is significant variation here as Judd et al Fig 4a below and Rae et al (2021) fig 7 below-again demonstrate. (At 50My bp, Judd et al have CO2 at 1,200ppm & Temp at 33ºC while Rae et al have CO2 at 1,500ppm & Temp at 27ºC which would make a significant difference in caculating ESS.)
Judd et al (2024) Fig 4a
Rae et al (2021) Fig 6

So what value ESS? Presumably somewhere +5ºC to +9ºC.
But does it matter?
(2) Both ECS and ESS warming assumes the CO2 levels (or equivalent) are maintained until the respective equilibrium is reached. Give the draw-down of CO2 over the millennium will amount to roughly half the CO2 level increase of today, that maintenance of CO2 levels over the millennium would require a lot of CO2 coming from somewhere. The carbon feedbacks aren't that big. (See this CarbonBrief article which suggests natural feedbacks could amount to perhaps 15% or so.) If CO2 levels will not be maintained over centuries post-net-zero, that suggests that even ECS lacks relevance, although beyond the millennium and into ESS-territory there is no significant CO2 draw-down.
Of course, with AGW rapidly approaching +1.5ºC and the emissions still up where they shouldn't be, I don't think any reassurance given about AGW not reaching ESS levels or ECS levels (ECS levels which still may be higher than the 'usual range' due to the "fat tail"): any such perceived reassurance should not be allowed to lessen the efforts to rapidly cut emissions and reduce the bad effects of AGW we are creating for the future. (And note that the less-dreadful IPCC scenarios also include net-negative anthropogenic emissions post-net-zero to add to the natural draw-down.)
MA Rodger @ 10 — thank you for the careful and substantive engagement. A few clarifications and responses:
On the Judd data points and the plot window: the standard version of my diagram is zoomed to 100–700 ppm for visual clarity, which means the seven higher-CO₂ Cenozoic points aren’t shown. However, the York regression that gives S=8.24 K/doubling, R=0.97 is computed on all 22 Cenozoic stages (LowerAge ≤66 Ma) including those high-CO₂ points — they’re in the regression even when they’re outside the plot window. I’ve recently produced a full-range version (0–1400 ppm) that shows the complete Cenozoic extent including the Eocene hothouse points, and the fits extrapolate correctly to those higher points despite being derived primarily from the ice-age data. That’s actually one of the more remarkable features of the diagram: LINK
The discrepancy between my 8.24 and Judd’s published 7.7 K/doubling is that 7.7 is their full Phanerozoic value (485 Ma), while 8.24 is the Cenozoic-only (66 Ma) subset — both reported in their paper. I use the Cenozoic value because the Cenozoic is the most relevant period for today’s climate state.
Your point about the Judd vs Rae et al CO₂ reconstruction discrepancy at 50 Ma is well taken — that uncertainty propagates into any ESS estimate derived from deep-time data, including mine. On your suggested range of +5 to +9°C however, I’d note that the convergence of five independent fits between 8.24 and 9.91 K/doubling — across different archives, methods, and timescales — suggests the data favors the upper portion of that range rather than the lower end. The lower end would require the Rae et al CO₂ reconstruction to be correct and Judd to be systematically wrong, and would require all five fits to be biased upward — which is difficult to sustain when they converge from completely independent starting points.
Your post-net-zero CO₂ drawdown point is important and consistent with my framing. I describe the equilibrium curve as where the physics “ultimately points given enough time.” The natural drawdown means the system will tend back toward the curve at a CO₂ level determined by where emissions peak and how much natural drawdown occurs subsequently — not necessarily at the peak concentration itself. That’s precisely why the timing of net-zero matters — earlier net-zero means lower peak CO₂, lower eventual equilibrium, and a lower landing point on the curve.
Dean Rovang
justdean.substack.com