


 Arguments


Recent Comments
Prev 382 383 384 385 386 387 388 389 390 391 392 393 394 395 396 397 Next
Comments 19451 to 19500:
-
nigelj at 09:04 AM on 31 May 2017Endorsing the Paris Agreement is Trump’s best opportunity for a big win
Economies constantly change, and this is both exhilarating, and benenficial overall, and also frightening, creating some dislocation, job pressures, and some challenges. For example fracking for gas has decimated the coal industry, right at the same time the climate issue has emerged that is also putting pressure on coal. These are the harsh realities, very hard on people, yet they are driven by capitalism, free markets, and technology, things we mostly all say are good things and they are generally good things surely? Isn't this the so called creative destruction of capitalism?
There are various ways of responding to all this. Trump is making the choice to go backwards and ignore market forces, and try to somehow preserve coal. This goes in the face of market forces, and is very state top heavy. Remember how Venezuela become so dependent on one export industry of oil, with a lot of state support for this industry, and got into huge trouble when the price collapsed. Part of this was the inflexibility of their state owned oil system, but Trump is just showing another similar form of inflexibility and is ignoring the fundamental facts about capitalism.
Of course Trump is also in total denial about the reality of climate change.
Another response to changing technology and changing environmental pressures is to help communities and ordinary people that are left behind with change. This is a more sensible idea to me and better use of government and tax money, than subsidising old industries past their use by dates, with an extended version of crony capitalism, that just tranfers public money to people who are already rich.
One of the desperate problems we have is in theory people that lose jobs due to technology change should "move to where the jobs are" but this is never so easy. People from very close community attachments. These communities may benefit from some help. As the article says, a carbon tax may help these communities branch out into new industries, renewable energy, or at least gives them money to relocate to other cities, and other options.
But you come up against the Republican antipathy towards taxes or government initiatives to help people. This leaves Trump and his alternatives of isolationism, trade protectionism or subsidising / protecting the industries of the past and ignoring environmental threats. It's a stark choice, either accept and adapt to change with some government help, or go back and hide in the past, adopt protectionism, bury your head in old industries, and ignore current realities.
-
Evan at 08:09 AM on 31 May 2017SkS Analogy 6 - Speakers, tuning forks, and global warming
Thanks Nigel@9 for the comments and the article. It is an interesting perspective. I would add the following in defense of analogies, accepting that they might invite increased criticism from deniers.
The analogies are not intended to be a better form of communication, just a different form. The hope is that the analogies will resonate with people, for whom some of the other material in SkS does not. We write to help people who are honestly searching and trying to understand. We are not trying to convert the deniers.
It is absolutely monumental what a 1% shift in voters in the last US presidential election would have made to the very direction of our efforts to combat climate change and to the direction of global politics. Look at what is happening because 1% voted for one candidate versus the other. All we needed to do was to reach 1% of the voters and sensitize them to the issue of climate change, and the outcome might have been very different. Things might have been very different. So we don't necessarily want to measure our success by 10's of percentage points, but by much more modest gains, with can have a magnified effect at the voting booth. The hope is that an increased variety of messaging methods will increase the penetration of our message.
Of course, if you feel that the analogies are hurting our messaging of the need for urgent action on climate change, then that gives me reason for being much more careful in crafting these. I am trying to create understanding that will help those honestly searching to see through the denier arguments.
Thanks again for your input Nigel@9.
-
nigelj at 06:53 AM on 31 May 2017SkS Analogy 6 - Speakers, tuning forks, and global warming
I can relate to Wol's comment that analogies create another target for denialists. I have noticed that when I use analogies in recent years, they come under a lot of attack, much of it dumb and cynical, and very annoying.
But if anything this suggests the climate denialists have come to see analogies as a big threat to their junk science, so it suggests analogies have value. Analogies have also helped me understand things. I think on balance analogies are useful.
Reading the comments, I was wondering about the history of whether analogies worked, and came across this persons personal blog which so perfectly describes the issues.
scampblog.blogspot.co.nz/2013/08/do-analogies-still-work.html
But it means analogies have to be pretty good, and carefully considered, or they will be torn apart. This creates a challenge, as the value of analogies is simplicity, but this very simplicity makes them an easy target for criticism sometimes.
-
MA Rodger at 05:21 AM on 31 May 2017It's the sun
cready @1236,
The upper panel of AR5 Fig 5.2 plots SST, SL & southern ocean dust as well as paleo CO2. If it is just the CO2 you wish to plot out, this NOAA directory may be useful. The data is a little old now (all pre-2006) but it probably provides half of the data in Fig 5.2.
-
Evan at 01:21 AM on 31 May 2017SkS Analogy 6 - Speakers, tuning forks, and global warming
Wol@6. Another point about the useful of analogies. I have often heard it said that the best learning occurs when 80% is familiar and 20% is new. The goal of analogies is to relate things that are new to things that are familiar, thereby facilitating learning. I can accept that I may be missing the mark in crafting analogies, and that these can be improved, but analogies are commonly used by most every speaker, writer, and teacher I've encountered. They therefore seem, to me anyway, to be extremely powerful tools for conveying information about subjects that are new to people.
-
cready at 01:04 AM on 31 May 2017It's the sun
Tom Curtis @1235, thanks. I did find that page, but I got horribly lost looking for the right data to reproduce that figure. I'm not really sure what I should be looking for, however. Any ideas?
-
Evan at 00:45 AM on 31 May 2017SkS Analogy 6 - Speakers, tuning forks, and global warming
One of the beauties of online publication is that we can continually improve the publications. They are not stagnant. So with the help of useful criticism, we will continue to improve the effectiveness of these analogies.
There are many deniers who simply will not change their position, yet there are others who are truly confused and trying to understand. It is to this latter group that we expend great effort to help them, and it is our hope that these analogies will help those "seekers" understand. I really don't know what formula will convert the deniers, but I am open to criticism about what will improve these analogies. Do you have a specific suggestion?
Is it by chance that nearly all Republicans oppose action on climate change and nearly all Democrates support it? Could there be something larger at play here? Should it be our goal to write analogies that will convert even the most stubborn Republican, or simply try to clarify the truth?
-
Wol at 22:59 PM on 30 May 2017SkS Analogy 6 - Speakers, tuning forks, and global warming
I'm not at all sure that these analogies are helpful in convincing anyone. They insert an extra layer of "debate" and offer yet another opportunity for deniers to fabricate "arguments".
-
Evan at 07:41 AM on 30 May 2017SkS Analogy 6 - Speakers, tuning forks, and global warming
Thanks Nigel for the link. Very effective and educational.
-
nigelj at 06:42 AM on 30 May 2017SkS Analogy 6 - Speakers, tuning forks, and global warming
This article below is a simple, clear, animated version of the whole process.
agreenerfutureblog.wordpress.com/1-the-natural-greenhouse-effect/
-
ubrew12 at 05:24 AM on 30 May 20172017 SkS Weekly Climate Change & Global Warming Digest #21
Regarding Joe Romm's Alaskan Permafrost Melt report, and the Scientific feedback that called it 'alarmist', it seems to me that many of the Scientists who critiqued it wished to err on the side of Scientific conservatism. But ordinary citizens aren't Scientists. We're more like stakeholders: we care about the planet because we live here. What is 'conservative' for the people Romm is writing for is not what is 'conservative' for a Scientist. For example, one researcher stated that if the permafrost melt leads to a 10% feedback (according to him, a 'large positive feedback' for climate), then a 1 C rise in temperature will actually lead to a 1.1 C rise, and then 1.11 C, and so on, from the permafrost melt. From a Scientists viewpoint, this appears prudently conservative, but, from the point of view of Romm's readers, what if he's wrong? It's not 'conservative' then, more like outlandishly optimistic. And just casually, its not lost on many of us that if a tray of ice is brought to 1 C, it doesn't melt by 10%, it melts by 100%. So the potential for catastrophe is certainly there: Romm is correct in noting that there is twice as much carbon in permafrost as there is in our atmosphere. Certainly these Scientists can admit there is at least a possibility of a 'thermal runaway', which is a term they really want to avoid using so as not to be called 'alarmist'. But imagine, for a second, the public's response if a Scientific paper got published that definitively showed the permafrost was in 'thermal runaway'. Such a situation is unrecoverable: that's how high the stakes are. I think the public would not be impressed by some Scientists being able to claim that at least they had been 'conservative', and that is the public Romm correctly has in mind.
-
Evan at 05:21 AM on 30 May 2017SkS Analogy 6 - Speakers, tuning forks, and global warming
The main point is that with increasing CO2 concentrations, that more energy is trapped. The details of how much is retained, reradiated, etc. is another story. When you sit next to a fire, you absorb infrared radiation. This causes you to heat up, so that your surface temperature increases. Because your surface temperature increases, the amount of infrared radiation you radiate also increases. But air molecules next to your skin will heat up, because your skin is warmer. So for CO2 molecules, whatever the detailed mechanism of the fraction that is retained vs reradiated, there is some local heating in addition to the heating that occurs due to reradiation.
Another SkS article explains what I think you are getting at, that the actual mechanism of global warming is that the layer where CO2 is are saturated moves to higher altitudes as their concentration increases. By trapping an increasing fraction at higher altitudes, more energy is added to the higher altitudes, where the greenhouse effect is not yet saturated.
This is a lot of detail, an in the spirit of how Fourier looked at the problem in the early 1800's from an overall balance of the energy into and out of Earth's atmosphere, all that I am saying is that from a simple energy balance, when we put more CO2 into the atmosphere it traps more energy. The details of how that happen are slightly more complicated.
As an interesting note, there is a similar phenomenon with the sun. We all know that light coming from the surface of the sun only takes about 8.5 minutes to reach Earth, but for light to get from the center of the sun, where nuclear fushion creates the photons, to the surface, takes about 100,000 years. The atmosphere is so dense in the core of the sun that the photons bounce around from atom to atom (or whatever state the matter is in) for many millenia before making it to the surface.
-
RedBaron at 05:12 AM on 30 May 2017More Carbon Dioxide is not necessarily good for plants.
@ahfretheim 245,
You have apparently been reading off the denial sphere. There are several inaccurate conclusions being bandied about regarding CO2 fertilization, and climate zones marching northwards.
The first important one to understand is that "greening" does not always mean increased photosynthesis. With regard to desertification just the opposite is true. Increased "greening" is a sign of a degrading grassland ecosystem that ultimately can in many cases turn to true desert.
It is counter intuitive. I understand that. But C4 grasses that produce far more photosynthesis than C3 scrub beginning to lose their dominance in a grassland biome is often the first sign on a long term trend to highly degraded land.
C4 carbon fixation - Wikipedia[1]
C4 metabolism originated when grasses migrated from the shady forest undercanopy to more open environments,[2] where the high sunlight gave it an advantage over the C3 pathway.[3]
… Today, C4 plants represent about 5% of Earth's plant biomass and 3% of its known plant species.[4][5] Despite this scarcity, they account for about 23% of terrestrial carbon fixation.[6][7] Increasing the proportion of C4 plants on earth could assist biosequestration of CO2 and represent an important climate change avoidance strategy.
The other thing they commonly "overlooked" is the angle of the sun. Just because some tundra might melt farther north doesn't mean at all that there will be anywhere near the same level of productivity. You still have the problem of no sun for 6 months! You can't grow winter wheat, winter rye, cool season crops like brassicas and peas etc... when there is no sun!
Lastly the types of plants we are seeing are not as good at building soil. The LCP is either limited or not present at all. Meaning net carbon into the soil sink decreases even when vegetative cover increases....in these cases.
-
Tom Curtis at 05:09 AM on 30 May 2017It's the sun
Cready @1234, this is a good first point of call.
-
Tom Curtis at 05:05 AM on 30 May 2017SkS Analogy 6 - Speakers, tuning forks, and global warming
sailingfree @1, actually nearly all absorbed radiation is given up as kinetic energy in collisions with other molecules in the atmosphere, most of which are to nitrogen and oxygen (N2 and O2). On the other hand, the CO2 molecules are continously being excited by those same collisions. As a result a near constant proportion of the CO2 molecules will be in an excited state, and able to radiate IR radiation at any given time. As a result, the radiation is governed by the local atmospheric temperature, not the rate of absorption of IR radiation.
The radiated IR photons can, however, go in any direction with equal probability. Because those radiated with a side ways component are matched by radiation from neighbouring parcels of gass, the energy tranfer from which effectively cancels out, the lateral components can be ignored, and the radiation treated as being radiated in equal amounts upwards and downwards.
-
sailingfree at 04:45 AM on 30 May 2017SkS Analogy 6 - Speakers, tuning forks, and global warming
Explaination needed here" "...When they absorb waves they trap heat, warming the atmosphere."
I thought that rather than absorb and retain heat, the CO2 more accurately, quickly reradiated it, some downward, which warmed the surface and the ocean. The warming surface/ocean then warms the lower to middle atmosphere.
Is that correct?
-
cready at 04:26 AM on 30 May 2017It's the sun
Would anyone know if there is a simple way to download the data used to produce Figure 2 from the IPCC AR5 Chapter 5? I'd like to show their calculations in a presentation, but the charts as provided are a bit busy. If I can present them as individual charts in Apple Keynote, it would really help.
Thans in advance, and thank you for Skeptical Science!
Christian -
Tom Curtis at 15:47 PM on 29 May 2017Temp record is unreliable
While strongly suspecting that moonrabbit @411 is yet another sock puppet, I will point out that my post at @406 exclusively criticizes cosmoswarrior/diehard/dieharder's claim @405 that:
"Not only that, but the temperature history during the last two decades of the 20th century was rewritten to double the rate of temperature increase."
As can be easilly seen from the graph @406, and the equivalent graph from Karl et al shown at @409 (panel b), the trend in the last two decades of the twentieth century, ie, from 1980 onwards, was not doubled when comparing adjusted to raw data. cosmoswarrior/diehard/dieharder's claim to the contrary is indeed a gross error. Somebody who cannot acknowledge even that, and who continuously misrepresents the argument made against his claim to avoid doing so in not amenable to reason.
If they (and moonrabbit, on the assumption that is not just another sock puppet) cannot acknowledge even that gross error, or even correctly represent the argument against it, how on earth can they be expected to discuss reseanably the more subtle issues relating to the 1998-2012 trend (ie, the so called "hiatus").
Moderator Response:[DB] Yes, this was just yet another tired, tepid sock puppet iteration of serial spammer cosmoswarrior.
-
moonrabbit at 15:21 PM on 29 May 2017Temp record is unreliable
I would like to comment on your responses to cosmoswarrior and diehard in their postings about the reliability of NOAA temperature data. First, in the response Tom Curtis gave to cosmoswarrior in @406, he showed the GHCNv3 data before and after the corrections, and pointed out that there was "almost no difference between the raw and adjusted data from 1980 forward". Tom Curtis then used this fact to argue that cosmoswarrior was incorrect in his/her statement about the data adjustments made in 2015 (which eliminated the "warming hiatus") also rewrote the temperature data for the last two decades of the 20th century. This is not an equitable comparison, however, since GHCNv3 was a land-based dataset only and the major changes had to do with the sea-surface measurements. Therefore, we cannot use this fact to argue that the statement by cosmoswarrior about "pause-buster" data corrections is "simply false" or that he/she is in "gross error".
At this point, I don't believe the fact can be disputed that NOAA made major changes in temperature data in June 2015 which in fact eliminated the appearance of a warming slowdown after 1998. The writings and videos by Kevin Cowtan and Zeke Hausfather that you in fact post and reference discuss the affects of these "adjustments" on the temperature trends. Additionally, news of these sweeping changes, including rewriting of data (which at least most of us have never seen before in any scientific effort), caused a huge controversy in the entire climate science field and eventually prompted a Congressional investigation. Therefore, if cosmoswarrior and diehard are mistaken in their statements, they are far from being the only ones.
Moderator Response:[PS] Try again - after you have read the comments policy. Note, no sloganeering, no accusations of fraud. Check for accuracy of your premises (what you read on some denier site is likely wrong) and logic. Unless you think a telescope works best without wiping the dust off, you need provide evidence that adjustments to temperature record are scientifically invalid, not that you dont like the results.
[DB] This sock puppet of serial spammer cosmoswarrior will not be rejoining this conversation.
-
Glenn Tamblyn at 14:36 PM on 29 May 2017Does Urban Heat Island effect add to the global warming trend?
EE
Your right that it is a change in the local characteristics of a site that can potentially skew the results.
How do they corrrect for this changing? Hopefully the metadataassociated with each station is updated as any such change occurs.
Also, the GHCN dataset that is used as the basis for some of the temperature products uses an automated pairwise adjustment method, contrasting nearby stations with each other to look for unusual variations in any station.
The data set produced by NASA GISS goes further. They use satellite data about lights at night to estimate degree of urbanisation, independent of station meta data. So any evolution of a site from rural to urban, at least in the satellite era can be detected. -
Eclectic at 09:41 AM on 29 May 2017More Carbon Dioxide is not necessarily good for plants.
Ahfretheim, you have failed to consider the overall context here.
If Earth had a very much smaller population of humans, and the current climate change were happening at one quarter its present speed — then yes, adaptation to global warming could proceed in the comfortably gradual, orderly, and harm-free manner that you indicate.
But the world is already overpopulated, especially in the tropics. And the production of staple foods (not apples or grapes) is under pressure from rising temperatures, rising extremes of heat-wave flood and drought, and rising sea level (invading the fertile river deltas and other low-lying farmlands).
Realistically, there is zero room for complacency and inaction about AGW.
-
ahfretheim at 04:36 AM on 29 May 2017More Carbon Dioxide is not necessarily good for plants.
1) Actually there's a great deal of disagreement on this point, as can be found in the American Meteorological Society study from 2014 reference by this ironically titled LA Times article: http://www.latimes.com/science/la-me-0305-drought-watch-20150305-story.html While it is true that greater heat does lead to greater evaporation, which leads to less water in the soil GIVEN THE SAME LEVEL OF PRECIPITATION, that water does not simply then disappear but ends up as vapor pressure in the atmospher, leading to greater precipitation. Indeed (also referenced in same ironically titled article) the Diffenbaugh, Swain and Tuoma study from Stanford did find that even in California winter precipitation would modestly increase, while also complaining that summer storms would be pushed north. What seems to emerge here is not an entire planet that is growing drier, but rather, winners and losers, and with decreasing permafrost making many non-arable lands in the arctic circle that would otherwise be possible candidates for agriculture open to utilization, it is likely that winners will greatly outweigh losers.
2) Every plant is different in this regard, and farmers already adjust their crops on a yearly basis based upon both weather patterns as recorded in thier almanac and crop prices. What will likely happen is, to adjust for the higher water usage, a shift away from water-enabled crops such as soybeans and towards water-disabled crops such as apples, tomatoes or grapes. One of the major problems with climate models in this regard is they tend to assume farmers are stupid or would simply stay in one place and let themselves be destroyed.
3) That actually depends upon your way of doing agriculture. There are methods of agriculture that don't involve artifical fertilizers and mixing the two approaches may prove best in the future. Also we're really not running out of natural gas, in fact many more expensive to operate gas fields are closing due to lack of demand.4) You can't have it both ways. Either there is increasing photosynthesis leading to greater need for CO2, water, nutrients and sunlight or there is not. Certainly if there is not increasing photosynthesis, your concerns in points 1, 2 and 3 are invalid.
5) Switch to more insect-resistant crops. This is the sort of on-going evolution that agriculture has been experiencing for hundreds of years. 400 years ago an insect destroyed the old French wine - they cross bred the plants with a wilder strain, and developed the heartiness to withstand the insects, but also lost a certain characteristic sweetness and innocence of the wine. When the Grand Coulee dam was built in the early 1900's, bringing accessible irrigation water to the bone dry and once sandstorm filled deserts of Eastern Washington, they were able to grow the old French strains once again in a place that never had the populations of insects to destroy them. Similarly, 70 years ago the Bowl Weevil evicted cotton from the Old South, leading to its replacement with many other kinds of agriculture from Oranges to Peanuts to Sugar to commercial timber. -
Tom Curtis at 23:31 PM on 28 May 2017Mars is warming
EE @50, I have responded to your comments on Venus on a more appropriate thread.
-
Tom Curtis at 23:30 PM on 28 May 2017Venus doesn't have a runaway greenhouse effect
Elsewhere, EE writes:
"Regarding question by mj at 43, I think skeptics are correct in that mentioning Venus is not very useful in advancing GW argument. By using the same albedo/black body radiation that was used for Mars..... Venus is 67M miles vs 93M miles so it absorbs twice the solar radiation. If Venus had the same albedo and same greenhouse as earth, it would still be unbearably hot. About 185 degrees Fahrenheit....too hot for me. Greenhouse or not, I'd be dead on that planet. "
I am not sure what is meant by "the same greenhouse effect", but it is interesting to explore the difference between the actual Venus, and Venus with an Earthlike and with zero albedo, all with no greenhouse effect.
First, the mean incoming solar radiation for Venus an albedo of 0, 0.306 (ie, Earthlike) and 0.77 (its current value) are 650.4, 451.4 and 149.6 W/m^2 respectively. As it happens, for a body with liquid water, the water vapour feedback imposes a cap on OLR on the assumption that there is such a thing as the greenhouse effect. That cap arises because, as temperatures rise, the water vapour feedback becomes stronger until a point is reached were the increase in the water vapour feedback compensates for any increase in outgoing radiation from the surface, so that while the temperature may rise, the OLR does not. That cap, for Earth is approximately 385 W/m^2 (Nakajima et al, 1992), and would be similar for Venus. Indeed, prior to the formation of Venus very thick atmosphere, it would have been slightly lower.
Crucially, for Venus with 0 or an Earthlike albedo, that cap is less than the globally averaged incoming insolation. That means that for Venus with Earthlike albedo, there is an excess of about 70 W/m^2 between the energy Venus would recieve from the Sun, and the amount it would radiate to space. That extra 70 W/m^2 must go into heating the surface, first by boiling away any liquid water on the surface, and then by raising the temperatures well above anything like the temperatrures we are used to.
That, in essence, is the runaway greenhouse effect. It cannot exist without a greenhouse effect, but a Venus with Earthlike albedo and zero initial greenhouse effect cannot avoid it.
In some respects, even more interesting is the current very high upward surface radiation coupled with the very low OLR found on Venus, or in simpler terms, the fact that Venus with less recieved radiation than Earth, has a surface hot enough to melt lead. Given that Venus is less dense than Earth, and consequently does not have as much radioactive material, that cannot be due to high geothermal heat flux. Consequently it is inexplicable without a greenhouse effect.
These two crucial facts about Venus show that the greenhouse effect is real, and that it is potent. There exist no other viable explanations; and certainly none proposed by AGW "skeptics" (whose explanations tend to start by ignoring the conservation of energy). In science, a theory is only as good as its ability to explain things better than its competitors. In this case the greenhouse effect is an efficient explanation of both the current state of Venus, and how it got into that state. It has no viable competition in that role. This, rather than our relative comfort on Venus with no greenhouse effect (or a much reduced greenhouse effect) and Earthlike albedo is what makes mention of Venus a good argument in favour of the theory of the greenhouse effect.
Granted it will not persuade all AGW "skeptics", but that is because most AGW "skeptics" have decided to make their beliefs on AGW immune to evidence. Nothing is a good argument for those with minds so closed.
-
scaddenp at 13:43 PM on 28 May 2017Does Urban Heat Island effect add to the global warming trend?
I dont think I understand your point at all. A rural area that has become urbanized is no longer "rural" for the purposes of correcting the record and cannot be used for such. I highly recommend that you read some of the detailed methodology. Eg Hausfather et al, 2013
-
EE at 12:53 PM on 28 May 2017Does Urban Heat Island effect add to the global warming trend?
I see how they correct for UHI in the urban areas by using nearby rural areas. However, a difference in urbanization between city and rural would not skew global warming as much as the difference in urbanization rates between city and rural. In other words, a city that stays the same size would not give a false global warming effect. But a rural area that turns into a town that grows to a city would.
How do the correct for the urbanization of rural areas?
-
scaddenp at 11:27 AM on 28 May 2017Climate is chaotic and cannot be predicted
I certainly hope you do not think that policy-makers should be guided by what you "sense" as opposed to scientists reasonable skill at predicting future climate (a cycle is not climate by definition really).
You need to be clearer about the difference between weather and climate. It would be very hard to predict the temperature for 24Dec 2017 where you live. However, I think you could nail the average temperature for Dec now with reasonable accuracy.
Furthermore, you can state with very high confidence that the average temperature for June will be warmer (if in NH temperate area) than average temperature for Dec. Now think for a moment. Why is that true? What is your answer?
-
EE at 09:48 AM on 28 May 2017Mars is warming
The conclusion of Fenton, that Mars temperature rose, is just a physics calculation that I remember from college Astronomy. If the surface darkens, more sunlight is absorbed, the temperature will rise, causing more heat radiation (black body radiation). Temperature will rise until the black body radiation of the higher temperature is in equilibrium with the new heat absorbtion. It assumes TSI is constant. So this is not a measurement per se.
Regarding question by mj at 43, I think skeptics are correct in that mentioning Venus is not very useful in advancing GW argument. By using the same albedo/black body radiation that was used for Mars..... Venus is 67M miles vs 93M miles so it absorbs twice the solar radiation. If Venus had the same albedo and same greenhouse as earth, it would still be unbearably hot. About 185 degrees Fahrenheit....too hot for me. Greenhouse or not, I'd be dead on that planet.
Here is link on Planet tempearature and blackbody radiation: https://en.wikipedia.org/wiki/Planetary_equilibrium_temperature
-
chriskoz at 07:54 AM on 28 May 2017Skeptical Science now an Android app
I just inatalled android ap buit i dont see the home menu with this blog. Is this blog hidden somewhwre in these mobile apps and can i access latest articles commemts from it or do ihave to revert to this site which is not optimised for mobile...
-
Eclectic at 21:39 PM on 27 May 2017Climate is chaotic and cannot be predicted
Interesting, Alnero2 @118 , that the way you see it is that you could be wrong. You are quite correct in that!!
Interesting also, that you sense there's more than one "major parameter" science is not yet aware of. Your claim is not just extraordinary, but more than extraordinary! How reliable is your ability to sense the unknown — for instance, can you reliably sense the results of future horse races?
I sense, yet I cannot prove, there is a sock missing from your sock drawer.
-
alnero2 at 19:31 PM on 27 May 2017Climate is chaotic and cannot be predicted
The weather has, is and always will change and I think, there is nought that is in the human dynamic, that will change this.
As science is a thing in progress and has not yet reached its zenith, then predicting long term cycles in weather, remains an aspiration.
I sense, yet I cannot prove, there are major parameters that affect weather of which science is not yet aware of.
I could be wrong, its just the way I see it.
-
Digby Scorgie at 15:03 PM on 27 May 2017Trump's Fox News deputy national security adviser fooled him with climate fake news
Quidam @5
So there's more to penguin life than I thought. I've seen them at nesting grounds with wings open on "warm" days but I don't recollect seeing them with beaks open — that's a new one on me.
-
Digby Scorgie at 14:57 PM on 27 May 2017SkS Analogy 5 - Linear, Non-linear, and Coastal Flooding
nigelj @38
Without wading through all the comments, I remember reading somewhere that initially the contributions to sea-level rise were mainly from glaciers and thermal expansion. Recently, however, meltwater from the Greenland and Antarctic ice caps has become a third important source. This apparently explains the recent acceleration. If I've misunderstood, somebody please correct me.
-
nigelj at 06:30 AM on 27 May 2017SkS Analogy 5 - Linear, Non-linear, and Coastal Flooding
Daniel Bailey @37, ok thanks.
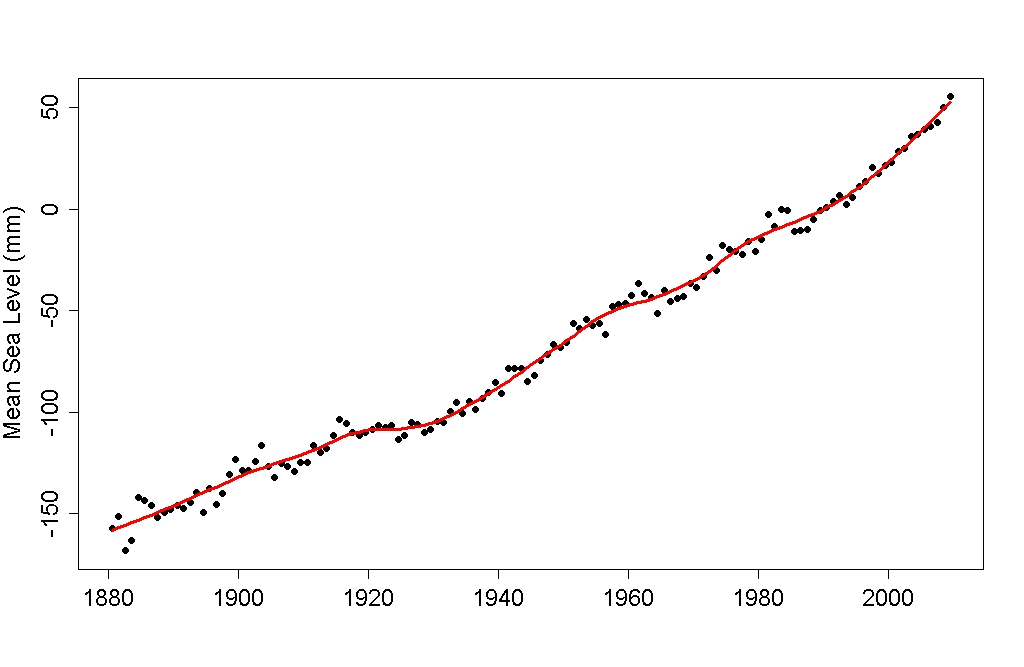
But one thing mystifies me. I would have expected sea level rise since 1900 to have accelerated in a roughly smooth curve, but squinting my eyes down the increase does look to be in a series of steps, for example after 1930, there is a definite and quite abrupt change in pace, and again after 1990 you have the same. Or maybe the lines imposed on the graph make it look that way.
But if it is a series of step changes, especially after 1990, why would that be? Did something happen around 1990 in terms of ice sheet behaviour, to cause this? Did melting in the arctic region accelerate about then?
-
Daniel Bailey at 00:42 AM on 27 May 2017SkS Analogy 5 - Linear, Non-linear, and Coastal Flooding
nigelj, that graphic is through 2012. This one is updated through 2015:

Bigger image here.
-
Quidam at 23:17 PM on 26 May 2017Trump's Fox News deputy national security adviser fooled him with climate fake news
>Digby Scorgie at 13:50 PM on 24 May, 2017 What I find amusing is that penguins hold their wings like that when they're hot and trying to cool off!<
Not just when they're hot. They also hold their wings like that for balance when walking and to dry off after they have come out of the ocean. That Adélie penguin is clean and she's on snow, not a nesting spot, so it's likely she's just come out of the ocean and was climbing to the colony when she was interupted by the photographer. (I'm just guessing it's a 'she')
If she were trying to cool off she would also likely have her beak open and be panting like a dog.
-
JWRebel at 23:16 PM on 26 May 2017Global climate projections help civil engineers plan
I would have thought that civil engineers are mostly interested in peak sstress values (rain, cold, warm, max wind) and seasonal averages in given locations rather than in global averages. Interesting that engineers are waking up to a new frontier.
-
John Hartz at 13:15 PM on 26 May 2017SkS Analogy 5 - Linear, Non-linear, and Coastal Flooding
Recommended supplemental reading:
10 things you should know about sea level rise and how bad it could be by Rob Motta, James White & R. Steven Nerem, Capital Weather Gang, Washington Post, May 20, 2016
-
nigelj at 11:48 AM on 26 May 2017SkS Analogy 5 - Linear, Non-linear, and Coastal Flooding
Tom Curtis @34, thanks for the explanation. I meant this sea level rise graph, which is very similar to your first example anyway, but with some trend lines shown and extended from 1880 to about 2016. I could not reconcile this with what Joe was claiming until I read your explanation.
I copied and pasted the wrong thing somehow above, hopefully it works this time. I have a new laptop, so I'm going to blame that.
-
chriskoz at 11:43 AM on 26 May 2017NCSE's counter-Heartland flyers
nigelj@1m
You feel so strongly about protecting children and minorities from the rubbish by professional AGW denialist. What aould you then say about protecting future generations, as they will be bearing the brunt of those denialists who want to ensure lack of mitigation in their time, just like we bearing the brunt of our fathers who buned FF without limit throughout most of XX century. Future generations are even more vulnerable than current children, as they cannot say anything, they cannot even cry.
-
Tom Curtis at 09:20 AM on 26 May 2017SkS Analogy 5 - Linear, Non-linear, and Coastal Flooding
nigelj @33, if you mean one of the graphs from this page by Tamino, then the Church and White data is actually from 1800-2009 (ie, the original data from the paper without updating), or from 1930 for the last three graphs. Of the graphs there, this one seems to best fit your description:
You will notice that though the data is noisy, the slope of the smoothed curve over the initial decades is less than that over the final decades, a fact that indicates acceleration.
Better yet is this graph, which determines acceleration on the assumption of a parabolic fit from each date up to 1990, showing uncertainty intervals:

The initial and 1900 values plus uncertainty intervals are close to those stated by Church and White, suggesting that is the technique they used. Tamino goes on to use better techniques to understand the structure of the acceleration, but only with the data from 1930.
For what it is worth, using a linear fit on the annual differences in sea level, the OLS trend is 0.006 +/- 0.019 mm/yr2. That is, it shows acceleration, but it is not statistically significant. For comparison, using the same technique on the data to 2009 shows an OLS trend of 0.018 +/- 0.016 mm/yr2; while from 1900 to 2014 shows an OLS trend of 0.019 +/- 0.015 mm/yr2. All errors are for 1 standard error only, so none of the accelerations shown are statistically significant, though all are greater than that reported by Church and White. Because of the accelerations shown, it is more likely than not that using the better techniques used by Church and White, and by Tamino in his last figure, would also show acceleration over that interval. Because of the larger relative errors, that is not certain, and it is certainly not clear that the data to 1990 would show a statistically significant acceleration, even using those better techniques.
-
nigelj at 08:37 AM on 26 May 2017NCSE's counter-Heartland flyers
If this sort of climate nonsense and deceit is allowed into schools, where does it stop? Next anti vaccination and anti flouride rubbish will be allowed in. Children will become missinformed, and at the very least totally confused.
I'm a strong believer in freedom of speech and rights of lobby groups, as far as the adult world goes, but I feel children have to be protected from rubbish from lobby groups, as they are not in a position to discern good from bad, or misleading information. Free speech is a right, but comes with a few responsibilities, and limits in some cases.
-
nigelj at 08:18 AM on 26 May 2017Global climate projections help civil engineers plan
"While people in the halls of Congress or in homes at holiday time may still argue about whether climate change is happening, scientists and engineers now have enough information to make informed decisions."
Yes exactly right. But one point, buildings and other civil works are mostly designed to building codes, which are ultimately political decisions! And many politicians are climate sceptics or are captive to lobby groups who are sceptics. In fact where I live politicians have not changed building codes, and have basically said it's up to the buyer and builders to do as they wish in terms of climate change. I think this is a totally inadequate political response.
It's possible of course to design above code, but this is just not always going to happen. This is human nature. As a result many people will go on building in vulnerable areas, and in silly ways, and this will ultimately become a burden on society as a whole.
You have to improve building codes and civil engineering codes, and make it mandatory. You may have to put some land off limits for development as well, if it's very vulnerable.
-
nigelj at 07:23 AM on 26 May 2017SkS Analogy 5 - Linear, Non-linear, and Coastal Flooding
Tom Curtis @31, thanks for making sense of this mystery. It appears to me Joe had the right method, but the wrong assumption on data previous to 1990, which is maybe understandable, as it wasn't so clear.
This graph is based on Church and White with the satellite data stiched on, from 1880 to 2016.
I can't see any increase in the "rate of the rate" from 1900 - 1990. It looks flat overall, but has a convex hump. There's an obvious increase in the rate of the rate from 1990 onwards.
-
MA Rodger at 23:59 PM on 25 May 2017SkS Analogy 5 - Linear, Non-linear, and Coastal Flooding
Tom Curtis @31,
I agree that the interpretation of the Smithsonian quote I present @30 is ludicrous and should be interpreted as you set out. Yet the interpretation @30 does after a fashion yield the values presented by joe@12. Despite being shown the need for a proper explanation, joe says no more than "I am going to refer you back to the the citation from the smithstonian. The rate of growth was straight from the data provided which is also from NOAA."Of course there is nothing preventing joe properly explaining how he derived his values if my explanation of it is wrong.
-
Tom Curtis at 19:29 PM on 25 May 2017SkS Analogy 5 - Linear, Non-linear, and Coastal Flooding
MA Rodger @30, comparison of the Smithsonian's claims to both Church and White (2011) and Jevrejeva et al (2014) data suggests the Smithsonian is basing its claims on Church and White for the interval preceding the satellite data, and the satellite data thereafter. That conclusion is given circumstantial support by the fact that one of the author's, Joshua Willis, works for NASA, whose vital signs page uses just that combination of data.
In any event, I interpret the Smithsonian quote as saying, not that sea level rose at a rate of 1.2 millimeters per year in 1900 and 1.7 millimeters per year in 1990, but that the linear trend from 1900-1990, given uncertaintly, lies between 1.2 and 1.7 millimeters a year. In support of that, using the linest function on the Church and White data from 1900-1990 yields a linear trend of 1.5 +/- 0.3 mm/year. I would conclude that no estimate of acceleration from 1900-1990 can be made from the Smithsonian statement, and certainly not one in contradiction of Church and White itself.
Nor can the difference between the 1.7 mm/year upper bound on the uncertainty interval fo the 1900-1990 trend be used to calculate a rate of acceleration from 1990-2000. That is especially the case given that the second part of the Smithsonian statement appears to be based on the satellite data, and therefore is not directly comparable.
For what it is worth, the linest estimated OLS trend for 1991-2000 is 2.16 +/- 0.4 mm/year. From 2000-2014 it is 4.0 +/-0.2 mm/year. Again, that shows a noticable acceleration.
Of course, Joe may have been relying on a different data source, in which case this analysis is irrelevant to his claims.
(Note: all calculated error margins given for 1 standard error.)
-
MA Rodger at 17:03 PM on 25 May 2017SkS Analogy 5 - Linear, Non-linear, and Coastal Flooding
Tom Curtis @28,
Concerning your first question posed, I suspect that the values presented thus by joe@12 :-
"Based on the data in the aforementioned article, the rate of increase in the rate of sea level rise was appox .0036 per annum (0.36% ) from 1900 to 1990. The rate of the increase in the sea level rise from 1990 to 2000 was approx .061 per annum (6.1%). The rate from 2000 to 2016 reverted back to .0040 (0.4%). which is much closer to the historical norm."
- were calculated from the rates of SLR described in the second pragraph of the Smithsonian Ocean ortal SLR page linked @12:-
"Between 1900 and 1990 studies show that sea level rose between 1.2 millimeters and 1.7 millimeters per year on average. By 2000, that rate had increased to about 3.2 millimeters per year and the rate in 2016 is estimated at 3.4 millimeters per year. Sea level is expected to rise even more quickly by the end of the century."
(Note the 3.4mm/yr 2016 figure is also given as 3.7mm/yr further down the Smithsonian article.) If this Smithsonian quote is interpreted as stating that the SLR 1900 was 1.2mm/yr, 1990 1.7mm/yr, 2000 3.2mm/yr and 2016 3.4mm/yr and an average percentage for the acceleration of SLR then calculated, you obtain 1900-1990 - 0.35%/yr (assuming a full century and not 90 years), 1900-2000 - 0.71% over 10 years, 2000-16 - 0.4% over 15 years. This is a bit of a stretch but is not a million miles from the values presented @12.
The "NOAA" data mentioned @21 (and also "smithstonian/NOAA data" @23) I suspect is the Church & White data you suggest @28. A plot of the exponential increase using the 'joe' values will slice through the wobbles of the Church & White data up to the 1990s. However, it is evident that the 'up' wobbles are larger than the 'down' wobbles which is why the 20th Century SLR is greatly underestimated by the assumed exponential growth.
-
bozzza at 12:45 PM on 25 May 2017Trump's Fox News deputy national security adviser fooled him with climate fake news
I love the graphic illustrating denier staganation: the world is turning and the rest is just all pause-button-politics as Jevons Paradox pays the taxes.
The people lead: Governments follow! (Can you believe Arnold Schwarzenegger said that? That's how basic this conundrum is!!)
-
John Hartz at 12:36 PM on 25 May 2017SkS Analogy 5 - Linear, Non-linear, and Coastal Flooding
We all need to keep in mind that Sea Level Rise does not occur uniformily throughout the global ocean system. Cases in point...
A 2016 Rutgers study found that seas near New Jersey could rise between 1 and 1.8 feet by the middle of this century under a scenario of low carbon emissions. But under a high emissions scenario, seas could swell as high as 4.5 feet by 2100. Recently, a National Oceanic and Atmospheric Administration study estimated mean global sea levels could rise as high as 8 feet by the end of the century.
Another study by researchers at the real estate firm Zillow found that nearly two million U.S.homes worth almost $900 billion could be underwater by 2100. The researchers weren’t referring to a situation where the market value of a home dips below the value of the mortgage; they literally meant underwater, swamped by rising sea levels.
Zillow researchers looked at coastal states where sea levels would rise by six feet by 2100. In Florida, the most vulnerable and heavily developed, they found nearly 1 million homes – one of every eight in the state – would be underwater. The next most vulnerable state was New Jersey, where 190,429 houses would be inundated.
How Rising Seas and Coastal Storms Drowned the U.S. Flood Insurance Program by Gibert M Gaul, Yale Environment 360, May 23, 2017
-
Tom Curtis at 11:07 AM on 25 May 2017SkS Analogy 5 - Linear, Non-linear, and Coastal Flooding
Joe, using Church and White (2011) (data downloadable here) as a basis of discussion, they claim that:
"The linear trend from 1900 to 2009 is 1.7 ± 0.2 mm year−1 and since 1961 is 1.9 ± 0.4 mm year−1. There is considerable variability in the rate of rise during the twentieth century but there has been a statistically significant acceleration since 1880 and 1900 of 0.009 ± 0.003 mm year−2 and 0.009 ± 0.004 mm year−2, respectively."
0.009/1.7 =0.0053, or 0.53% increase per annum in the rate of sea level rise (2nd derivative) over the course of the 20th century. More importantly, that rate of increase extended over the period 1900-2009 would result in a rate of increase of sea level (first derivative) 2.27 mm/year in 2009. The actual rate of increase of sea level for the decade terminating in 2009 was 3.41 mm per annum. What is more, by 2014, the rate of increase for the preceding decade had risen to 4.53 mm/yr. There is a relatively smooth rise in rate of sea level rise over a decade from 2000 to 2014 of 0.17 mm/yr^2, which is approximately a rate of increase in the rate of increase of sea level of 5% per annum.
This raises two questions:
Given that your estimates of the rate of increase of the rate of increase of sea level are under estimates whether we take the 20th century values, or the more recent much more rapid rate of increase, where did you get those estimates from (or how did you make them)?
Given that the rapid rate of increase in sea level rise coincides with the onset of rapid loss of ice from the Greenland and West Antarctic Ice Sheets, is there any reason we should not expect it to continue, and therefore project a 14 year doubling time of the rate of sea level rise over at least the first half of the 21st century?
Prev 382 383 384 385 386 387 388 389 390 391 392 393 394 395 396 397 Next


