


 Arguments


American conservatives are still clueless about the 97% expert climate consensus
Posted on 5 April 2018 by dana1981
Gallup released its annual survey on American perceptions about global warming last week, and the results were a bit discouraging. While 85–90% of Democrats are worried about global warming, realize humans are causing it, and are aware that most scientists agree on this, independents and Republicans are a different story. Only 35% of Republicans and 62% of independents realize humans are causing global warming (down from 40% and 70% last year, respectively), a similar number are worried about it, and only 42% of Republicans and 65% of independents are aware of the scientific consensus – also significantly down from last year’s Gallup poll.
The Trump administration’s polarizing stance on climate change is probably the main contributor to this decline in conservative acceptance of climate change realities. A recent study found evidence that “Americans may have formed their attitudes [on climate change] by using party elite cues” delivered via the media. In particular, the study found that Fox News “is consistently more partisan than other [news] outlets” and has incorporated politicians into the majority of its climate segments.
Americans are gradually becoming better-informed
Nevertheless, public awareness about climate change realities has improved over the long-term. For example, about two-thirds of Americans now realize that most scientists agree global warming is occurring, up from less than half in 1997.
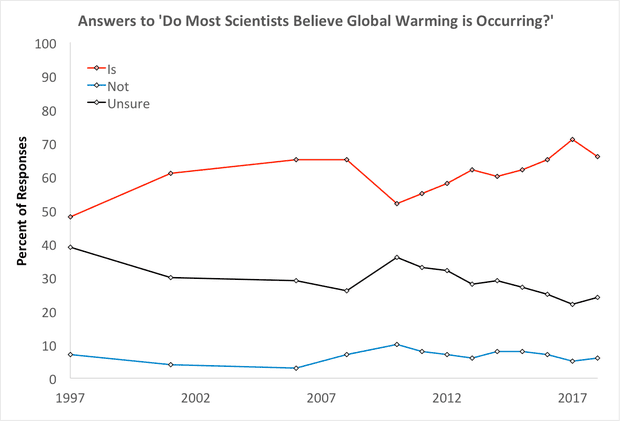
Responses to Gallup survey question asking whether most scientists believe global warming is occurring. Illustration: Dana Nuccitelli
There’s also a strong correlation between awareness of the expert consensus, that humans are causing global warming, and concern about the issue. This suggests that when people are aware that experts agree, they accept the consensus and realize we need to address the problem. This is consistent with research finding that the expert consensus is a ‘gateway belief’ leading to public support for climate action.
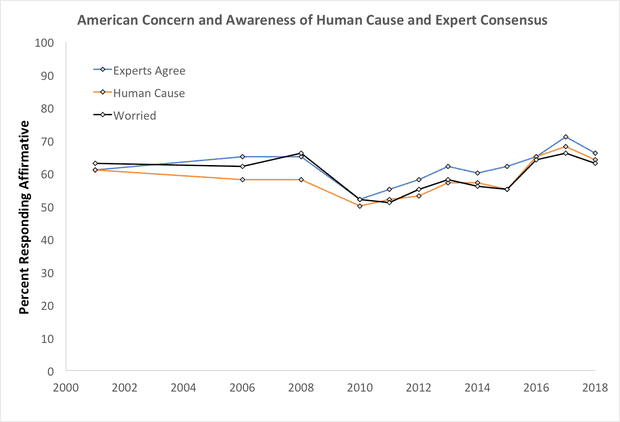
Responses to Gallup survey questions asking whether scientists agree global warming is occurring (blue), whether humans are responsible (orange), and whether respondents are worried about it (black). Illustration: Dana Nuccitelli
There’s a handbook for that
John Cook and Stephan Lewandowsky, who previously published The Debunking Handbook, teamed up with Sander van der Linden and Edward Maibach to write The Consensus Handbook. It’s a concise and definitive summary of everything related to the expert climate consensus, including how we know 90–100% of climate scientists agree on human-caused global warming, efforts to manufacture doubt about the consensus, its role as a gateway belief, its neutralizing effect on political ideology, and how to inoculate people against misinformation.
Those last points are particularly important in light of the Gallup survey data. There’s an intense battle over public opinion on climate change, with cues from political elites having a polarizing effect that’s largely offset when people become aware of the expert consensus.
Thus, there’s been a concerted campaign to misinform people about the consensus. That was a key issue that major oil companies accepted in a recent court case, while their fossil fuel-funded supporters denied the consensus in briefs submitted to the court. Meanwhile, the Trump EPA is distributing misleading statements about scientific uncertainty on climate change, helping create this tribal identity that ‘Team Conservative’ denies the realities and dangers associated with human-caused global warming.
However, as the Consensus Handbook discusses, research has shown that inoculating people against misinformation can largely offset its influence.
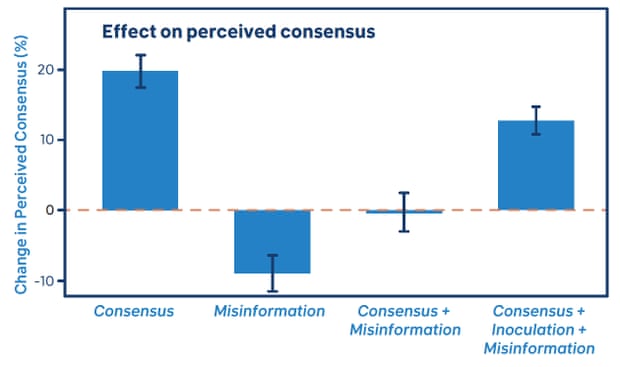
The effect of different types of messages about climate change. Illustration: The Consensus Handbook.
The bad news is that misinformation can totally offset the influence of facts on topics like the expert consensus on human-caused global warming. The good news is that people don’t like being fooled, so when they’re additionally informed about the tactics used to trick them with misinformation, they’re more likely to accept the facts.
Some are polarized, but many are simply unaware
The challenge is that politicians on Fox News and other media outlets are able to reach a wide audience with their polarizing messages about climate change. Reaching a similarly sized audience not only with facts but also inoculation against the misinformation is a daunting task. However, as John Cook notes,


Very informative article. The level of concern about climate change looks to have dropped around 2009, which approximately matches with the climate research unit email controversy, which initially created a bad look in a superficial sense. Several investigations cleared everyone of any wrong doing, but it looks like it was a temporary setback in terms of public acceptance of the climate problem, but acceptance has fortunately improved since 2009 in the graph in the article.
I think one of the main reasons some republicans are unaware of the 97% consensus level research is many of them only watch Fox, from some study I saw somewhere. Fox seldom refers to the consensus studies and is sceptical of climate science, so this group of republicans simply aren't getting the information. The internet seems to have had a peculiar effect of enabling people to hide in little bubble worlds full of fake information, or information is just deliberatly left out. The later can be just as damaging as misleading or incorrect information, imho.
It may be worth climate organisations trying to identify and target this group or republicans somehow.
Fox also has low accuracy in its climate change reporting compared to other media, although some small improvements recently here in this article.
We appear to have two main groups of people in this world in relation to how science is perceived. Firstly look at historical controversial science issues as well as climate science. like evolution, vaccines, and tobacco problems, and theres quite a lot of initial scepticism in the general public, but acceptance does slowly improve over time with most people. This must surely be due to education, people work through the issues in their minds, and seeing the trickery of lobby groups slowly exposed, seeeing through the campaigns of doubt, and seeing through the misleading rhetoric full of logical fallacies.
So we have a decent sized group of people that have some innate healthy scepticism, but are apparently able to be persuaded or change their views over time. The more the fake arguments of the denialists are exposed, the more people are likely to be persuaded one would think.
And of course the fact corporations hid knowledge of problems inevitably gets leaked sooner or later.
However you have another group of people, a very stubborn core group of denialists. Again just look at debates over climate science, safety of vaccines, tobacco and evolution and this smaller group of denialists still exists even after decades. A lot of evidence suggests political and ideological motives, and vested interests as key driving factors. It's hard changing people's politics, or things like unusually high levels of cognitive bias and the dunning kruger effect. That's not to say we shouldn't try, however success may be very slow coming.
Therefore while the stubbborn denialists arguments should always be challenged,society may be best to stop thinking they will ever accept the science fully, and work around them, isolate and ignore them. Democrats may need to take stronger ownership of the climate issue, both in terms of stronger legislative positions rather than weak positions that try to please everyone (and yes I know its tough in politics) and also make more efforts on an individual level and local community level. This will force the Republican Party to take notice, and take at least some action in case it is seen as totally behind the times and at risk of losing votes.
So I think we have these two groups of people who respond a bit differently, and its important to realise they are separate groups and so strategies have to be different. Too many people confuse them, and think either everyone can be convinced of the science, or all attempts to convert sceptics are hopeless. The truth is a bit more nuanced.
One nit pick. The paragraph near the end of the article "one key point Gallup poll" was a bit confusing.
A new survey of published climate related papers shows that there is actually a 99.94% consensus on human made global warming.
Here the peer-reviewed paper => journals.sagepub.com/doi/abs/10.1177/0270467617707079
97% of the leading thinkers of their day once believed the earth was flat. The percent of scientists believing that climate change is real is a very weak argument. On the other hand the fact that 97% of scientists have done research and that their results are consistent witht the theory that the climate is changing and that we are causing it is a very strong argument.
William @3
I normally agree with your comments, but I think your alternative wording is over complicating this. People will also say "97% of scientists have done research and that their results are consistent witht the theory etcetera" was done in the past and was wrong.
Keep it simple. There are no clever wordings. People must surely know a consensus is not 100% proof, but they realise a strong consensus counts for quite a lot. This is why the denialists attack the consensus idea so much.
We can't do much about people that choose to interpret a consensus totally cynically or stupidly and they will do this however it is worded. You aren't going to change, this because their mindset is driven by ego, emotion and politics.
We can only convince people who are open minded and seeking information.
SirCharles:
The paper you link to is from May 2017. It is a response to a comment on an earlier paper by Powell. The comment was written by several SkS participants, and our dear late friend Andy Skuce was the lead author. Andy wrote a blog post about it when the comment paper first appeared (at the same time as Powell's reply):
https://skepticalscience.com/S17blogpost.html
"For example, about two-thirds of Americansnow realize that most scientists agree global warming is occurring, up from less than half in 1997."
To amplify william's comment, it's not the scientists that are in agreement on this, it is the data. And there has been high confidence in the data of human fored climate change by the massive emissions of carbon dioxide through repeated demonstration of its accuracy through direct observation for decades.
The chances of the science behind an increasing positive forcing of the radiative balance through massive emmissions of a molecule tuned to absorb heat being in fundanmental error is vanishingly small.
The chances of ongoing claims that there is no significant forcing of the radiative balance through the emission of gigatons of CO2 every year is also vanishingly small.
This isn't a question of one group of experts out-competiting another group with a rival theory, this is a question of virtually all the verifiable data indicating a very specific response to changing the ability of the atmosphere to absorb heat as opposed to the intellectual equivalent of a child putting their fingers in their ears and chanting loudly so they don't hear something they are unable to accept.
Isaac Asimov coined a term, the Relativity of Wrong. This compares competing hypothesis that are attempting to descirbe a phenomena. It scales a hypothesis by how well it explains something in testible terms.
Applying this relativity of wrong concept to the science of human forced climate change by the massive emissions of carbon dioixde to the hypothesis that it has no major radiative forcing, there is no comparison.
In pure information respects there is no competing hypothesis to explain why the Earth is rapidly warming as we drive the concentration of atmospheric CO2 ever higher.
Which means that those scientists who are doing genuine research in climate change and the human forcing factor are in far more than 97% agreement.
Like a massive object trying to achieve the speed of light, it is never possible to achieve 100%. I'd say that the genuine science on this has to be more 99.99%.
Because virtually all the observation is in agreement with the fundamental theories. Are we going to tweek quantum mechanics now to appease the fossil fuel sector...
If so then modern society will come to a crashing halt, because the same quantum theories that allow all our modern transistor based electronics to work also describe why molecules like N2 and O2 - which make up almost all the atmosphere - are transparent to heat but CO2 isn't.
Anyone posting online how the science of human forced climate change is in error has just disproved their own statements by demonstrating our high confidence in the fundamental theories that allow them to enter the online digital world and also explain why the Earth will warm as we increase the concentration of a gas that has been demonstrated in clear quantum mechanical terms to absorb heat.
Recommended supplemental reading:
Trump’s Climate Change Denial Is Already Reshaping Public Opinion. Opinion by John Cook, HuffPost, Apr 3, 2018
Perhaps it's the simplicity of the question that invites resistance from a significant minority. Most people are aware that vast majority of scientists agree that rising CO2 causes warming of the atmosphere and other changes to the climate system, but that doesn't itself provide the level of detail that many people feel is necessary.
It shouldn't be too difficult to create a more refined analysis that indictes what percentage of scientists say that the consequences will be severe unless urgent steps are taken now to limit atmospheric CO2 to 'nnn' ppm, or limit global temperature to nn degrees C etc.
The difficulty I see with consensus surveys is the definition of what the consensus components are. For example, President Obama defined the consensus as “warming is real, manmade and dangerous”. Unfortunately, that definition is wrong, per the scientific papers on the consensus, and also other surveys of the scientific community, so it’s easily attacked. If the definition is watered down to “CO2 is rising and the planet is warming”, then there is consensus, but it’s meaningless, because most skeptics agree with that as well. Getting a meaningful consensus statement such as “It is warming, man is over 50% responsible, with fossil fuels the majority of the driver, and will lead to dangerous effects if not reversed”, is difficult, given the state of the peer-reviewed science, and is certainly not the consensus at the 97% level.
I think it would be well for political purposes to be more cautious about climate change attribution, and attempt to rebuild credibility among persuadable skeptics. Non-scientists who fuel alarmist memes are hurting the cause, and reducing the credibility of climate science, as amply noted in the trends the article describes.
TPohlman @9 , the consensus among scientists is very clear: that the attribution is approximately 100%, not 50% or a bit over 50%.
Are there any "persuadable skeptics"? None that I've ever heard of, in the past decade or so. There are deniers and dismissives [=deniers]. Real skeptics were all persuaded by the scientific evidence, many years ago, that the climate scientists are correct. So . . . there are no persuadable skeptics left to be influenced by soft-soap "rebuilt credibility".
Presenting information focused on the consensus regarding climate science matters may be improved by adding that the consensus is a strengthening robustly developed emergent truth. The number is rather irrelevant, but a high number does relate to how strong the emergent understanding is. It may also be helpful to always include an explanation for the motivations of some people in the field of investigation, and many people not in the field but having Private Interests that are negatively affected by the improved understanding, to try to argue against the emergent understanding.
More than 100 years ago there was little doubt about the impact of increased CO2 in the atmosphere. The only questions were about the specific magnitude of the impact and the nature of regional impacts.
The evidence gathered since then has strengthened the understanding that the impacts of the burning of fossil fuels are a net-negative for the future generations of global humanity, and the activity creates many 'non-CO2 impact' negatives for current day humans and future generations. The understanding was strong enough in the 1980s to mobilize global leadership in an effort to responsibly address what are undeniably unsustainable and harmful 'developed way that humans try to enjoy more benefit in their lifetime'.
The failure of global leadership to responsibly lead the correction of what had developed, particularly the failure of 'all' the richest among humanity to develop responsible behaviour, is also an emergent truth (something that there could be a consensus understanding about if everyone was honestly concerned about how their actions affected others).
To be fair, some of the richest have tried to help correct what has developed. But the socioeconomic-political games that have developed did more than produce the damaging unsustainable development of burning of fossil fuels. Those systems have also developed resistance to correction, particularly through carefully targeted misleading marketing appeals for people to be greedier or less tolerant and Unite and vote together to win what they want (the uniting of emotionally triggered voters who have been tempted to be greedier or less tolerant).
The abuses of the understanding of misleading marketing by the more irresponsible undeserving profiteers among the richest winners has delayed and diminished those efforts to correct the aspects of what has developed that undeniably need to be corrected. The worst of that group attempt to claim that rich people continuing to benefit from the burning of fossil fuels is required for the poorest to be able to live a better life, claiming that any perceptions of improved circumstances for the poorest are due to richer people benefiting from the burning of fossil fuels.
eclectic @ 10
"the consensus among scientists is very clear: that the attribution is approximately 100%, not 50% or a bit over 50%."
Could you provide some references in the IPCC Fifth Assessment for this statement?
If we have temperature increases in the 1930-1940's and rates of sea level rise per year during this period that match the average 1993 - present sea level rise rates, both of which I believe are presently attributed to "natural internal variability" (for the lack of any other explanation), then how can you say that the present temperature rise is 100% attributable to AGW?
I assume you do not attribute all of the present sea level rise to AGW, and if you do not, then what is causing that portion not attributable to AGW?
NorrisM @12 : You wish some references for the "attribution" having approx 100% human causation ?
NorrisM . . . Can I believe the evidence of my optics? [Yes, a Foghorn Leghorn quote seems called for, here !! ]
NorrisM, you will find many scientific literature [& IPCC] references supporting the 100% Attribution, if you care to take a quick scan through SkS's list of Most Used Climate Myths -— for instance, Myths numbered #1 ; #6 ; #12 ; #16 ; #30 ; #33 ; #34 ; #39 ; #43 ; #47 ; #49 ; #52 ; #56 ; #59 ; #61 ; #65 ; #68 ; #70 . . . and probably a good many of the subsequent 100+ Myths after number #70.
NorrisM, because my sandpapered antennae detect that your Attribution question may not be entirely lacking disingenuousness, I do not propose to lead you through Chapter & Verse of the science — any more than I would if someone had asked me for detailed evidence that The World ain't Flat.
My apologies to you, NorrisM, if my response to you has seemed overly brusque — yet I really feel that your question also indicates that you have spent disproportionately more time in posting your opinions at SkS, than you have spent in reading at SkS. (Reading the summarizations & articles at SkS, is a far more efficient use of your time than is the occasional reading of isolated scientific papers.)
As to the question of attribution of present sea level rise : we have (you and I) previously discussed this question, where I criticized Dr Curry's presentation/summation of the present state of play. She made a good case that maybe as little as 40-60% (in other words, roughly 100 mm) of MSL rise during the last 50-100 years was purely from AGW. I myself suspect that she has overstretched her argument that AMO and PDO and other cyclic changes/variabilities (plus increased groundwater extraction) had produced an equivalent 100 mm — but really, such small rises are a quibble when viewed against the general picture of the size of glacial/interglacial MSL alterations (and their rate of alteration). And against the present-day rapid MSL rise which is accelerating towards a drastic increase. There is no realistic comparison between the minor events of the 1930s/1940s and the subsequent [present and future] changes — which are ongoing and not trivial & cyclic in origin.
Additionally, I had (at that same time) pointed out that Dr Curry was indulging in the purely rhetorical method of implying (to the unthinking or inattentive reader of her statements) that a less-than-100% AGW causation of very recent MSL rise . . . must likely mean that modern Climate Change would also not be near 100% human-caused . . . and thus that the scientific consensus would be erroneous/questionable. I feel Dr Curry's line of argument was deficient in probity, in that it was incomplete and designed to mislead the reader.
Norrism:
From the 2017 US Climate Change Report:
"The likely range of the human contribution to the global mean temperature increase over the period 1951–2010 is 1.1° to 1.4°F (0.6° to 0.8°C), and the central estimate of the observed warming of 1.2°F (0.65°C) lies within this range (high confidence). This translates to a likely human contribution of 93%–123% of the observed 1951–2010 change. It is extremely likely that more than half of the global mean temperature increase since 1951 was caused by human influence on climate (high confidence). The likely contributions of natural forcing and internal variability to global temperature change over that period are minor (high confidence)."
The estimated warming from human sources is 93-123% of the warming. The central estimate is that humans cause about 110% of the warming. Natural processes would cause cooling on their own. That is the consensus. You have been given this information before.
All of sea level rise and all of warming is caused by humans.
If you wasted less time chasing Curries references to geothermal heat in the Antarctic you would be more informed. The critical issue with any geothermal heat is has it changed? Deniers claim any finding of heat causes warming. That is false, the source of heat must have changed to cause warming. There is no evidence of any geothermal, solar or other natural source of heat increasing.
In 1850 scientists predicted on the basis of the properties of carbon dioxide that the globe would warm and the sea would rise. In 1896 Arhennius projected the amount of warming accurately. Why is it so hard for you to accept what experts measure?
michael sweet @ 14
Thank you for your reference but I did request a comment from the IPCC Fifth Assessment. Surely, the papers have not changed on this analysis since 2013.
But even with the US Climate Report, these statements are not at the level of "Very High Confidence" (ie 90%) but rather "High Confidence". Again, “High Confidence” means moderate evidence (some sources, some consistency) medium consensus. "Likely" means at least a 66% chance of occurring. In other words, there is no slam dunk agreement of the experts. I think the reason why is that there is no clear explanation of what happened in the 1930-1940 period both as to temperatures and the rate of sea level rise at that time.
As for your statement: "All of sea level rise and all of warming is caused by humans.", how can you say that all sea level rise is caused by humans when everyone agrees that the sea level has been rising at an average rate of 1.1 to 1.7 mm/yr between 1901 and 2010?
By the way, I have not really responded to your first reply to my long blog on sea level rise. I have just been too busy on other things but I promise to get to it at some point. But I will say that I have zero disagreement with the premise that when it comes to building major infrastructure like a nuclear plant, we probably should use a 1% risk scenario. This may cut out Florida from a lot of infrastructure but so be it.
Norrism:
From Wikipedia":
"Recently, it has become widely accepted that late Holocene, 3,000 calendar years ago to present, sea level was nearly stable prior to an acceleration of rate of rise that is variously dated between 1850 and 1900 AD. Late Holocene rates of sea level rise have been estimated using evidence from archaeological sites and late Holocene tidal marsh sediments, combined with tide gauge and satellite records and geophysical modeling. For example, this research included studies of Roman wells in Caesarea and of Roman piscinae in Italy. These methods in combination suggest a mean eustatic component of 0.07 mm/yr for the last 2000 years.[15]
Since 1880, the ocean began to rise briskly, climbing a total of 210 mm (8.3 in) through 2009 causing extensive erosion worldwide and costing billions.[19]"
They provide a peer reveiwed source.
We find that sea level was stable for 3000 years until humans began seriously releasing carbon dioxide in 1850. Then sea level starts to rise. Scientists predicted that releasing carbon dioxide would cause sea level to rise. The rise from 1900-1950 was caused by the carbon dioxide released from 1850 to 1950. All of sea level rise is due to humans.
You cannot ignore the measured acceleration since 1900. Sea level rise is currently about 4 mm/yr and accelerating.
Curries waves are a figment of deniers imaginations. They were proved incorrect by the extreme temperatures since she proposed the idea in 2014. They are falsified by the measured data on sea level rise from 0 AD to 1900 AD.
Well NorrisM, you could just look up the Ar5 and find it. (ch 10). The attribution statement and pseudo-skeptic responses are discussed here with numerous useful references.
Scaddenp @17 , thank you for the link to RealClimate with the 27Aug2014 take-down of Judith Curry's "attribution" of modern sea level rise. Gavin Schmidt (the article's author) was distinctly more scathing than I have been, about Curry's lack of logical thinking.
I also read the near-200 comments following the article. Some amusing stuff there — and with honorable mention of MA Rodger and his [posts #163 and onwards] "analysis" of Curry's golden panacea, the "BNO" [Big Natural Oscillation] which she waves about in all directions. Actually, it didn't take long to read through the comments — my speed being helped by entirely skipping all posts by "Rob Ellison" (who has a track record of bloviating prolixity & crankdom & ne'er a useful point to make).
But I regret my curiosity letting me follow the [final] post's link to WUWT — and an article by [engineer] Matt Skaggs who promised to deliver a rigorous "Root Cause Analysis of Modern Warming" sort of engineer's approach to things. Alas, it turned out to be a complete waste of time . . . huge holes in his arguments. Yes, I should have known better than to think that any WUWT article could deliver enlightenment (rather than just amusement).
If I may quote from Gavin Schmidt : "In general, the shorter the time period, the greater potential for internal variability, or (equivalently) the larger the forced signal needs to be in order to be detected . . . ~ . . . Thus cutting down the period to ever-shorter periods of years increases the challenges and one can end up simply cherry-picking the noise instead of seeing the signal". Very fitting — because that is Judith Curry's modus operandi : she cherry-picks a sufficiently-short time period of Mean Sea Level rise . . . where it is just conceivably possible that a fortuitous combination of "BNO" [Big Natural Oscillation, excuse the sarcasm] might explain a substantial minority of recent MSL rise. But when you stand back and look at the bigger picture, you see that Curry's arguments are twaddle.
eclectic @ 13
I can assure you that I am doing much more reading than blogging.
But I have to admit that my question regarding the view of the IPCC was somewhat rhetorical because I was pretty sure that the IPCC Fifth Assessment had not made any statements on attribution beyond the following statement from the Executive Summary of Chapter 10:
"More than half of the observed increase in global mean surfacetemperature (GMST) from 1951 to 2010 is very likely1 due to the observed anthropogenic increase in greenhouse gas (GHG) concentrations. ...... The Atlantic Multi-decadal Oscillation(AMO) could be a confounding influence but studies that find a significant role for the AMO show that this does not project strongly onto 1951–2010 temperature trends. {10.3.1, Table 10.1}"
michael sweet has provided a "100%" attribution statement from the US Climate Report but the level of confidence is "High Confidence" which effectively means "medium consensus". I do not think we need to pursue this further. I was just responding to michael sweet's bold statement that 100% of AGW can be attributed to AGW since 1950. If he had said there was a "medium consensus" on this then I would have just kept quiet.
As to michael sweet's comment that my ballpark estimate of .4 m by 2100 (based upon what I had read up to that time) is just some figure of mine pulled out of the air, here is a paper by Rohling et al (2013) which has as its predicted "mid-point" for 2100 my same guesstimate of .4 m:
www.nature.com/articles/srep03461
The underlying premise of the Rohling paper is that the predicted rates for the period 2080 to 2100 to get to the higher levels of sea level rise per year relies on information based upon times when the volume of ice at the times of these high 10 mm/yr rates (and occasional 40 mm/yr pulse rates) was when the world had three (3) times the volume of ice we presently have. As well, much of this ice was sitting at lower latitudes and was therefore very susceptible to high melting rates.
Any thoughts on this?
I think I have said that the DeConto & Pollard (2016) paper referred to me by Glenn Tamblyn certainly raises issues about the WAIS. Can anyone direct me to where the observational evidence is about retreating ground lines? I understand there is some discussion somewhere.
NorrisM @19
If I can add my two cents worth. I don't see how you can get from high confidence in 100% human attribution of warming, to a medium consensus. The IPCC doesn't publish any result unless theres a strong consensus among the review team.
I look at the basics of the science behind this. There are only so many natural things that can plausibly cause a warming trend, including changes in solar energy output, big sustained changes in volcanic activity, possibly cosmic ray trends (still rather contentious) and longer term ocean cycles. Since the late 1970's the atmosphere has warmed, and theres no evidence these factors are currently causing a warming trend in recent decades. For example solar irradiance has been essentially flat.
When you eliminate the possible and plausible natural causes, you are left with burning of fossil fuels and the greenhuse effect. Various characteristics of how the atmosphere has warmed since the 1970's also point towards CO2, called greenhouse fingerprints.
Now nobody will claim 100% certainty, because its impossible to be 100% certain all data sets on these factors are 100% perfect, but when the IPCC says good confidence or high confidence it means the data sets and research are certainly good quality. Putting it another way, when they say high confidence, this is science speak for saying it would be very unwise to ignore what we are saying.
I don't think its wise to base your information on potential future sea level rise on just one single research paper on the past geological record, actually. You would need to review everything published on the issue, and even then past information is of limited value and so is only part of the picture and needs caution. Having said that it's an interesting paper, so thanks.
The underlying premise of the Rowling paper is not based on past history where ice volumes were three times presnet day volumes. They mention this in passing, but focus their main attention on the last interglacial (130 - 115 K ago), where ice volumes are similar to today, and note that when temperatures were approximately 1 - 1.5 degree above pre industrial averages, sea level rose about 7 metres total, at between 2.6 - 0.92 M century, (0.7M on average). They say there were probably shorter periods of more rapid sea level rise.
It needs to be noted we are ar risk of warming the climate more than 1 - 1.5 degree. Unless I'm missing something in the article, we are therefore at risk of more than 7 metres total sea level rise, and probably faster rates per century.
Their end conclusion is about 0.8 metre of sea level rise is likely by the end of this century, with 2 metres as the upper limit - but less likely. This is presumably assuming a worst case emissions scenario, and this is of course entirely a possible scenario.
I do not see your 0.4 M number in the study, and it may be assuming slower emissions growth and low sensitivity of how ice sheets respond. Anyway its a middle range estimate of some sort, and personally I wouldn't count on it.
There's nothing here to cheer about or be complacent about. Plenty of evidence points towards rates of ice loss being likely towards the pessimistic end of this scale such as recent behaviour of the greenland and antarctic ice sheets .
Typo alert. I meant .26M per century.
NorrisM @19 , allow me to unruffle your feathers. Yes, I was making a cheap shot in suggesting your posting activity outweighed your breadth of non-partisan reading. I am half-ashamed of my rudeness in attempting a witticism, there.
Still, you yourself know how strenuous is your advocacy for minimizing the appreciation of the adverse effects of AGW (and especially, regarding sea level rise). You appear to lean towards the cherrypicking of any studies/opinions hovering at the extreme-low end of the likely range of MSL rise for the next 80 years.
I won't insult you by quoting others who pointed out the need for prudent risk-management wrt AGW and MSL rise.
Yes, reading the [2013] 5th IPCC's Summary For Policymakers . . . is educational, but we must recognize that the whole IPCC output is toned down towards the "Lowest Common Denominator" (both in politically-acceptable terms and in terms of defending a smaller scientific position). And it is footling to attempt to "reverse engineer" a realistic scientific risk-assessment by shuffling phrases such a ">66%" , "highly likely" , "moderate confidence" , and so on.
Hence the unwisdom of viewing the real world entirely through a prism which (a) is 5 years out of date, and (b) is inherently tilted towards undue emphasis on The Least. (Of course, the IPCC reports are still a goldmine of information & references.)
Already (since 2013) we have seen the spectacular end of the "Hiatus" in surface temperatures, and we have seen evidence that ice-melt is occurring faster than previously thought. And we are only at the beginning of that 80-year period to Century's end ! Nor should we turn a blind eye to the much larger effects to come, in the centuries beyond 2100.
NorrisM, you are being irresponsible in wasting your time pointing at the "[merely midpoint] 0.4 by 2100" scenario (one of many scenarios based on information prior to 2013). Less partisanship and more prudence, please !
nigelj @ 20
"I don't see how you can get from high confidence in 100% human attribution of warming, to a medium consensus."
Nigel, how I get from "high confidence" to "medium consensus" is that this is exactly what the term "High Confidence" means when used by the IPCC and the US Climate Report. I think this term is rather misleading but here is the definition of "High Confidence" right out of the US Climate Report (see my long sea level rise post where I listed these definitions):
"High Confidence means moderate evidence (some sources, some consistency) medium consensus."
As for Rohling's midpoint estimate for 2100 of a .4M rise since 1700, please refer to Figure 3(d) in the paper which shows a range for 2100 of .2M to .9M with .4M as the mid range value. I think Rohling's reference to .8M is stating that it is near the upper bound of his 68% probability interval of natural change.
Rohling makes it clear that his projections following LIg values (previous interglacial) are based upon extrapolation of "well-constrained processes for Greenland" and that "proportionally greater contributions might be possible for Antarctica".
You asked me why I am always at the low estimates. My underlying reason for looking at the lower end is my underlying distrust of whether the GCMs are accurately predicting the amount of temperature rise we will actually have from now until 2100 and therefore the impact it will have on sea level rise both from a thermal steric standpoint as well as a mass increase from melting ice sheets. It comes from a general philosophical view that Hume is right that as soon as we move from empirical analysis we get into dangerous waters.
I know this is not the place to get into a discussion of GCMs but you asked me why I am always on the low end. I have a general distrust of the ability of the GCMs to replicate our complicated climate system especially with the admitted problems with properly inputting the impacts of clouds owing to a combination of not fully understanding their impact and not having the computing power to build them into the models. You then add to this serious questions as to whether RCP 8.5 is a realistic scenario given the move to alternative sources of energy in the world. I think China has realized that it cannot continue to use coal in an unlimited manner.
PS Presently reading a book which somewhat explains the "Age of Trump" by Kurt Andersen titled "Fantasyland - How America Went Haywire". It is a 400 year history of "delusion and make-believe in the US" since the first settlement of Jamestown, Virginia.
[DB] Off-topic snipped. I'd warn you about the repercussions for such continued violations of this venue's Comments Policy, but I know you'd just continue to ignore such.
Norrism:
According to the graph in Rohling you must look at graph C and not graph D (the scale is incorrect for the purpose in graph D) source:
I see that in graph C that the 95% range in 2100 is 0.3 m to 2.3 meters. Your claim that 0.4 meters is midrange appears to be deliberately incorrect. The 68% range is 0.4 to 1.8 meters, 0.4 meters is the absolute bottom of the range. Everyone knows that there is much more chance of sea level rise being higher than expected than it being lower.
Since Rohling was published Ringot has published data showing that Rohlings assumption that the maximum rate of sea level rise would be 2.0 meters/century is incorrect and the actual maximum rate is much higher. I have given you the reference previously but you ignored it.
Rohling points out that the current rate is at the very top of the 68% curve or 1.8 meters of sea level rise. You must provide justification why you think the rate will decrease to less than half the current rate for the rest of the century. Data shows that the rate is accelerating, not slowing down.
You are either incapable of reading a graph or deliberately being deceptive. When you are incapable of reading a simple graph it makes me wonder if you are really capable of calculating expected sea level rise yourself (the answer is no). People on this website check your references and know when you are misleading them.
It is sloganeering to repeatedly give incorrect information. You are very well informed about the low end of the data but seem completely ignorant of the upper end. You are misdefining the IPCC information.
I am sorry, the range of 0.4-1.8 meters is the 90% interval. The 68% interval is 0.5-1.2 meters.
michael sweet @ 24
Are you saying that graph d is incorrect? Graph c is hard to read the measurements for 2100. I understood that Rohling in graph d was simply expanding the size so that you could better read the measurements.
I have no recollection of any reference by you to a Ringot paper but in any event, could you provide me with some access to the paper? I appreciate that I could search it out but you seem to have url's that can get past paywalls.
Norrism:
The scale is largest around 2100 on graph C so it is the easiest to read. I note that your estimate of 0.4 m of sea level rise is well below the 68% range, nowhere near a midpoint value. This paper is used a lot by deniers because it is at the very lowest range of peer reviewed papers. The IPCC has relied on low papers a lot in the past and increases its projections every report because the low estimates are incorrect.
This paper by Hansen, Rignot and 17 other top scientists in 2016 (already cited by 196 others!!!) give projections of up to 17 feet of sea level rise by 2100. They discuss ice sheet disintegration. I could not immediately find again the paper by Rignot that describes the mechanism of ice sheet disintegration. He may not be the lead author. It is cited in the Hansen paper or you could go to his website and look at his list of publications for the years 2014-2016. The 19 authors of the Hansen paper have much more experience and past successes than Rohling and his coauthors.
Rignot had a youtube video previously linked for you that described the process. Search youtube.
I use GOOGLE or GOOGLE SCHOLAR to find free papers.
The central, consensus estimate of the IPCC is that humans were responsible for 110% of the warming since 1950. Your lawerly review of the terms does not appear to recognise that this is the central, consensus number. I cannot understand how you discount the central, consensus number. Gavin Schmitt at RealClimate calculated that there was only a 0.5% chance of humans causing less than 66% of the warming (Curry was unable to do the calculation and said scientists did not know how to either. She was wrong.)
The average sea level rise since 1900 is about 1.7 mm/yr according to you (I cannot find your post since it is not on the sea level rise thread). For the past 30 years sea level rise has been 3.4 mm/yr according to satalite measurements. Sea level rise must be accelerating since the most recent 30 year rise is double the average over the past century, no analysis is needed.
You think sea level rise will immediately slow down to 1.7 mm/yr again?? What is the physical mechanism for the decrease in sea level rise? Your suggestion of a decline in sea level rise appears unphysical (a very strong term in science) to me.
Scientists have predicted for over 100 years that sea level rise would accelerate due to AGW and that prediction has come true. Why could we possibly think that sea level rise will slow down to half of the current rate when peer reviewed papers measure more acceleration? As temperature increases the forcing for sea level rise increases and we would expect acceleration.
michael sweet @ 27
After looking at this carefully, there is no question that Figure 3 (d) is simply a blown up portion of Figure 3(c). Just look at where the heavy black dot is on both c and d (the Pfeffer "most likely projection"), in both cases it is .8m. The heavy black line on both c and d represents Rohling's "probability maximum (peak of probability distribution) which comes out at .4m for 2100.
I acknowledge that this is simply one "peer-reviewed" paper. Your criticism before was that I never made reference to "peer-reviewed" literature and should therefore be banned from this website.
As for the Hansen paper, I have not read it but I will do so. My understanding of the Hansen paper is that Hansen's 17 foot figure is not a "projection" as you say but merely a "possibility" based upon assumptions for which Hansen himself acknowledges in the paper that he has no evidence. This last comment was pulled from my recollection of a direct quote from Hansen's paper from some other blogger. I will see if I can find the quote and if I cannot I will also acknowledge same.
Interesting that the US Climate Report, although clearly relying on the De Conto and Pollard 2016 paper on WAIS does not seem to put much reliance on this Hansen paper. My understanding is that Hansen has had a number of projections which have not come to pass along with a few that have. I understand that his figure of 17 feet relies on an exponential (not quadratic) curve. What I do agree with Hansen is his promotion of nuclear power (I have even contributed to his charity because of this).
I have not suggested that sea level will slow down but if you want an answer to your question as to what physical mechanism could there be for a decrease in the sea level rise rate (not actual decrease), the simple answer is a flattening of the temperature rise. We saw this happen with sea level rise during the "hiatus" and we could see it if temperatures were to level off for the next 10 years.
I certainly see that the impact of the WAIS is critical to all of this discussion of sea level. If anyone could suggest some further reading on what is actually happening to the grounding lines on the WAIS and whether this is creating the seaward flux suggested I would be very keen to read it. My understanding is that the theory of MISI and his added MICI are still in the "theory" category, not supported by observational evidence. And it is for that reason that the chances of material change in sea levels by 2100 are rated below 1% for anything more than 2m in the US Climate Report.
[DB] Sloganeering and off-topic snipped
NorrisM, I admit I also thought d was a blow up of c, however take a step back.
I think the important point is the last IPCC report estimated 0.8 - 1.0 M is the most likely number for sea level rise by 2100, by calculation, based on business as usual emissions.
Rohling's research finds 0.8M the most likely number for sea level rise by 2100, by projecting historical data forwards.
So both are not too far apart, and both rule out 0.4M as low end and unlikely.
The question is the probability of something like 1.5M or 2M. Neither the Rohling historical research or recent sea level rise modelling rule this out. Rohling explictly states theres evidence of short periods of rapid sea level rise in the past. It may all be less likely, but we just don't know for sure.
We are loading the dice towards that 2M direction with rapid emissions growth and rates of warming, and evidence that antarctic ice sheets are destabilising, and research recently points towards 2M as a distinct possibility (eg Hanson or Pfeffer). It's like sceptics are taking a gamble that it wouldn't happen, but the results would be truly catastrophic if we are unlucky.
"Future sea level rise" on wikipedia is a little bit old, but worth a read particularly the key research papers discussed.
Norrism@28:
Somewhere (I cannot find your old posts because you are posting on sea level rise on mutiple threads) you estimated sea level rise to 2100 would be 10 inches. You used the long term linear rate from 1900 to 2010 of about 1.7 mm/yr. The 30 year rate is currently about 3.4 mm/yr or double the rate you used. The 5 year rate is about 5 mm/year or triple the rate you used.
For your projection of 10 inches to realize the rate of sea level rise must immediately decrease by a factor of three and then stay low for 80 years. If you will not back your estimates you should not make them. I imagine you got this estimate from some denier like Curry. Tamino has characterized this method of estimating sea level rise as "complete bullshit". What web site did you get this estimate from? Why do you waste your time reading there?
As for the graph, the point is that 0.4 meters is not the "midpoint" of Rohlings estimates as you claimed. 0.4 meters is the very bottom of the 90% range and is far below the 68% range. I find graph C easier to read. Obviously you could not read graph D correctly since you claimed it supported your claim of 0.4 meters as the midpoint. Examine the larger scale copy of the graph that I linked. The range of .2-.9m you claimed here is extraordinarily far below the actual range. The 95% range is actually 0.3-2.2 meters, the 68% range is 0.5-1.2 m. Arguing about which graph to read is just a distraction from the fact that your claim was false.
Hansen's point is that the danger of extreme sea level rise is made to counter the low balling by the IPCC on sea level rise. As time has passed the IPCC has had to substantially raise their estimates while Hansen has remained the same.
Hansen's estimates are no longer extreme outliers as they were. Note his many coauthors and their great experience. Many scientists who study the great ice sheets talk of meters of sea level rise now. 10 years ago they thought the great ice sheets were stable for thousands of years. Hansen is very well respected by other scientists (this should be obvious by the number of his coauthors). You are listening to deniers talking about him.
2 meters for world sea level rise is a pretty common estimate for the high end (not the extreme possibility) of sea level rise. Recent data showing the unexpected slowing of the thermohaline circulation in the North Atlantic mean that sea level rise on the East Coast of the USA will be substantially higher than the global rise. That could be an additional 1.5 feet on top of the 8 feet that the US Climate Change report could not rule out. Even a meter of sea level rise would be trillions of dollars of damage in the US alone.
You may feel comfortable with no insurance but I think we should take action to prevent such a disasterous possibility. Since action to control climate change will result in tens of thousands of less pollution deaths/yr and save over $50 billion/yr in hospital costs in the US alone, it would be worth it even if sea level rise is "only" a meter.
Norrism:
Re-reading the Rohling graph it appears to me that you are using Rohlings numbers from AD 2000 to compare to your numbers from 1700. Use the scale on the left hand side of the graph and not the right hand side to compare to your 0.4 estimate.
NorrisM:
You seem to be wanting to continue sea level discussions here, rather than on the Sea level rise predictions are exaggerated thread, where you have not responded to this comment from me.
The moderators have been snipping from your recent post in this thread. One of the snipped phases was:
...in apparent justification for you claiming that a flattening of sea level rise could be caused by a flattening of temperature rise.
Leaving aside the argument that the "hiatus" in surface temperature rise represented a slowing of global warming (not seen in the ocean temperatures, which are the ones that affect sea level), you are simply wrong that any temporary slowdowns of sea level rise were the result of temperature changes. The primary driver of short-term fluctuations in sea level over the past decade or two is El Nino/La Nina - it shifts water between oceans and land, due to precipitation changes.
Read this post to see the explanation. Here is the first graph from that post:
You are making the wrong conclusions becuase you are looking at the wrong physical mechanisms. Without an understanding of the physical principles that affect sea level, you are doomed to continue these fundamental misunderstandings. I have tried to point this out to you on the other thread, but you are persisting in drawing your own conclusions from a position of ignorance.
The GRACE measurements of mass change over the 2010-11 period show very clearly why sea level dropped.
Article here. keithpickering reported on the sums from the GRACE grids and confirmed most of the change in sealevel accounted for by change in hydrological storage.
Bob Loblaw @32,
Of course, the graph you show (linked from another SkS post) is a bit out-of-date now and even the source for the image (which has been provided data to mid-Feb 2018) doesn't use the re-calibrated TOPEX data as in the CU graph below. That graph demonstrates visually an acceleration in global SLR. (And simplistically, if you put a linear regression through the first half of the 25 years of the calibrated SLR data and the second half fo the data, the difference is 3.8-2.8=1mm/yr SLR, this obtained on two halves of the record. These halves being 12½ years apart, it suggests a global SLR acceleration of 0.08mm/yr/yr, or alternatively 2½%/year. Sustained until 2100, 2½%/year would equate to about one metre SLR for the century, a little above the 0.8m 'black dot' on the Rohling graphic @24.)
Norrism:
I have posted a new reply to you here where it is on topic. You should post all your posts on sea level rise on that thread becasue anything here will be permanently lost. It is site policy to always post on a relevant thread, I am surprised the moderators have not started deleting your off topic posts.
You should read the comments thread to keep up on all threads like everyone else does. The comments button is at the top of every page in the middle of the blue line.
I suggest that everyone try to post sea level rise debate on the relevant thread that Bob Loblaw originally linked and is linked again above. Both Bob Loblaw's and MA Rodger's posts above are interesting and will be impossible to find in two weeks.
Thanks, gentlemen, for the images of GRACE data and an updated sea level graph. I knew of the GRACE data and analysis, but Rob Painting's older post was the one I first found with a quick search.
In terms of updated sea level data, Daniel Bailey had already posted another more-up-to-date graph in this comment on the "Sea Level Rise Predictions Are Exaggerated" thread that michael sweet has responded on. Daniel's comment is only two spots above NorrisM's long comment with his unsupportable argument for linear extrapolation. This is an example of why comments should be placed on the correct threads.