Patrick Michaels Continues to Distort Hansen 1988, Part 2
Posted on 25 January 2012 by dana1981
In Part 1 of this post, we examined Patrick Michaels' self-defense for deleting two of Hansen and colleagues' 1988 global warming projections in his 1998 testimony before Congress. As we saw, Michaels' excuse relied on a comment by Hansen that Scenario A was "business as usual." However, given that we did not follow a business-as-usual path from 1988 to 1998, and Scenario C was the most accurate representation of actual greenhouse gas (GHG) emissions, Michaels' presentation to Congress remains a distortion of Hansen's actual results.
Here in Part 2, we examine what Michaels' presentation to Congress should have looked like, had it been accurate, and what this tells us about the accuracy of Hansen's climate model and real-world climate sensitivity.
Recreating Michaels' Congressional Testimony Graphic
As noted in Part 1, if we're going to only show one emissions scenario, it should be the one closest to reality. In Michaels' case in his 1998 Congressional testimony, that should have been Scenario C. Currently, Scenario B is closest to the actual forcing, according to Skeie et al., but running about 16% too high (since 1988). Figure 1 reproduces Hansen's Scenario B with a 16% reduction in the warming trend, to crudely correct for the discrepancy between it and the actual radiative forcing. This might be what Michaels' graphic would look like if he were to give an accurate version of his presentation today:
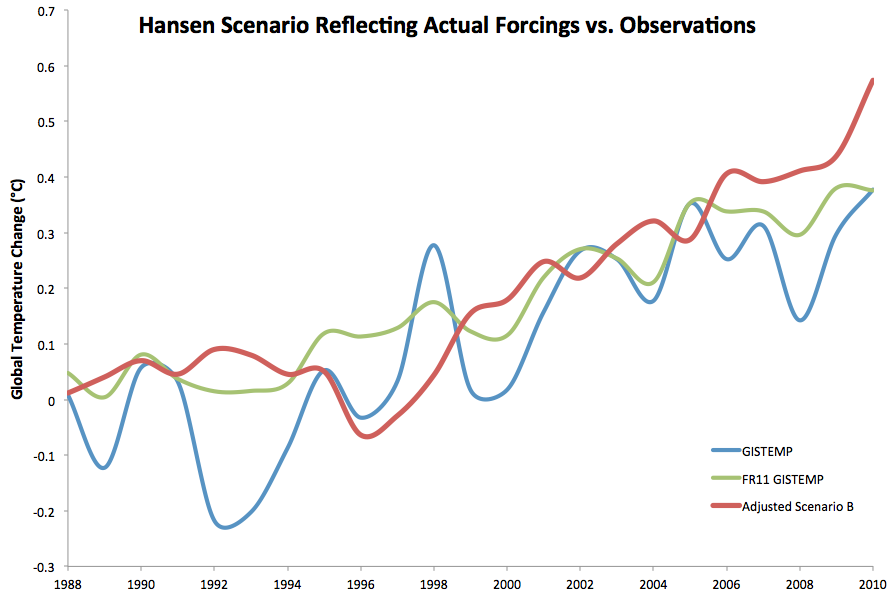
Figure 1: Observed temperature change (GISTEMP, blue) and with solar, volcanic and El Niño Southern Oscillation effects removed by Foster and Rahmstorf (green) vs. Hansen Scenario B trend adjusted downward 16% to reflect the observed changes in radiative forcings since 1988, using a 1986 to 1990 baseline.
In Figure 1 we've included both GISTEMP data, and GISTEMP with solar, volcanic, and El Niño Southern Oscillation influences removed by Foster and Rahmstorf (2011). The 1988 to 2010 trends are similar, 0.20°C per decade with the natural effects, 0.18°C per decade without. Scenario B has a 0.23°C per decade trend, but when removing a simulated volcanic eruption in 1996, the trend decreases to about 0.22°C per decade.
As the figure above shows, Hansen's 1988 model overpredicted the ensuing global warming. However, it only overpredicted the warming by approximately 15 to 25%, which is a far cry from the 300% overprediction claimed by Michaels in his 1998 congressional testimony.
If we weren't true skeptics, we might stop here and simply conclude that Hansen was wrong and his model was too sensitive, as some fake skeptics have in the past. However, we know that Skeptical Science readers expect more from our site, and one major question remains unanswered.
Climate Sensitivity
As we saw in our previous post regarding Patrick Michaels' serial data deletions, he has a tendency to specifically delete data which would suggest that climate sensitivity is not low (and he also ignores all research which does not suggest low sensitivity). This is because Michaels' main argument against taking action to address global warming is that the climate is not very sensitive to greenhouse gas changes, and thus there is no urgency or need to reduce those emissions.
However, Hansen's results add to the long list of evidence that climate sensitivity is not low. While it's true that Hansen's 1988 model was too sensitive, this is not news. The sensitivity of his model was 4.2°C for a doubling of atmospheric CO2 (see Section 6.1 on page 4398 of his paper), which is towards the high end of the IPCC likely climate sensitivity range.
However, as noted above, Hansen's model overpredicted the ensuing global warming thus far by approximately 15 to 25%. Thus if we estimate that the sensitivity of his model was 25% too high (which is an oversimplification, but will give us a conservative estimate), this suggests the actual climate sensitivity is approximately 3.4°C for doubled CO2, which is close to the IPCC best estimate of 3°C.
Michaels' Distortions vs. True Skepticism
Michaels made a number of major errors in response to the Skeptical Science post criticizing his repeated deletions of inconvenient data. He claimed that it was appropriate to only present Hansen's Scenario A to Congress because we had followed "business as usual" emissions, when in fact the Montreal Protocol and other major events had resulted in substantially reduced GHG emissions. Moreover, Michaels claimed that Scenario A was Hansen's model prediction, when in fact it was just one of three projections; of those three, as of 1998 Scenario C was the most representative of the actual radiative forcing, and Scenario A the least representative.
Thus Michaels grossly misled Congress by claiming that Hansen's prediction was wrong by 300%. In reality it overpredicted the subsequent global warming by closer to 20%, which also suggests that climate sensitivity is not low. Michaels' assumption that Scenario A was the appropriate comparision based on one comment Hansen had made, rather than actually examining the data to determine which scenario was most representative of actual emissions, reveals a gross lack of scientific rigor. This lack of scientific competency was particularly problematic given that the distorted results were presented to our policymakers as they attempted to decide whether to ratify the Kyoto Protocol and commit to GHG emissions reductions (which they subsequently did not). This is not the type of behavior we should expect from someone presenting himself to U.S. Congress as a climate expert.
Michaels made a number of other errors in his response post, including claiming that we at Skeptical Science "try to obliterate evidence which paints a less than alarming picture of our climate future." This is both false and classic psychological projection - in our presentations of Hansen 1988, Schmittner 2011, and Gillet 2012, we provided a thorough analysis of all aspects of each paper, without "obliterating" any evidence, contrary to Michaels, who deleted inconvenient data from each in order to present a very distorted picture of the results of each research paper, and ignored the key caveats and limitations noted by the papers' authors.
In fact, the fundamental purpose of Skeptical Science is to accurately represent what the peer-reviewed scientific literature says. Michaels began his response by stating:
"When the battle is being lost, there is a tendency to try to raise a level of distraction to shift the attention away from the desperate situation at hand."
This is a rather damning admission, since it is Michaels who tries to shift the attention from the full body of research by deleting the inconvenient data, and who has tried to shift the attention from his scientific distortions by accusing Skeptical Science of committing his own misdeeds.
Rather than wasting his efforts coming up with faulty excuses to defend his indefensible behavior and lashing out at those who have called him on it, and in the process making ever more fallacious and easily-debunked claims, Michaels should simply admit his errors and put an end to his serial deletions of inconvenient data. Until he does, websites which purport to exhibit climate skepticism but which continue to publish Michaels' serial scientific distortions greatly diminish their own credibility.
Note: This post has been used to update the Advanced rebuttal to "Hansen's 1988 prediction was wrong"
Michaels' entire presentation and continued defense of his distortions are based on a wrong assumption which is very easily checked simply by looking up the GHG data. So the two options are (1) Michaels didn't bother to take the simplest step to confirm the accuracy of his claims, or (2) he did check their accuracy, discovered they were wrong, but continued to make them anyway.
Neither possibility reflects very well on Michaels, to put it kindly.
It's an easy mistake to make and a lot of people (including me!) have made it.
However, if I were testifying to Congress I would certainly check the background to the data I was using, in this case by reading and understanding the Hansen paper. I wouldn't just use a rhetorical flourish ('business as usual! He said busines as usual!') to delete the data that didn't agree with my opinion.
Perhaps Michaels didn't know about this, and should be very embarrassed about this massive blunder. It would certainly make me suspicious about calling him up as an 'expert witness' until he could accept the clear errors and guarantee he was working to prevent them happening again.
Doesn't that kind of thing sometimes cause editor resignations when it happens in the peer-reviewed journals?
I agree that making the mistake in 1998 is somewhat understandable, although a really bad mistake for a supposed climate science expert. Not a mistake one should make in testimony to Congress, but as you say, a relatively easy mistake to make, if one were being lazy and careless.
But to continue to defend the error to this day rather than admitting the massive blunder (and to attack anyone who points out the blunder) is absolutely inexcusable. It's the opposite of how a skeptic and scientist should behave.
-------------------------------
The climate model we employ has a global mean surface air equilibrium sensitivity of 4.2 C for doubled CO2. Other recent GCMs yield equilibrium sensitivities of 2.5-5.5 C.....
Forecast temperature trends for time scales of a few decades or less are not very sensitive to the model's equilibrium climate sensitivity (reference provided). Therefore climate sensitivity would have to be much smaller than 4.2 C, say 1.5 to 2 C, in order for us to modify our conclusions significantly.
-------------------------------
1. should not these expert witnesses giving presentations at congress give a practice presentation, where other scientists can warn them what is wrong. That way they can fix the science questions .. and not present mistaken notions to congress? Or are these hearings set up to be like a law court, with adversarial parties, none really trying to find a 'truth', but rather trying to advocate a certain view?
2. What was the reaction at the time, at this presentation? How can this still be a living meme?
3. It looks like the world has followed a scenario near to the 'best' C, but without the extreme kink at 2000, where all greenhouse gas emissions would have had to have stopped completely. Does this mean that the world has not done quite as bad as one might have feared, in 1988?
Dana answers your #2 above.
Your #3 is best asked in the part 1 of this post - in some ways you are right, there is a lower quantity of radiatively active gases in the atmosphere. However, this is not through conscious removal of the gases for their radiative properties. An accident of the Montreal Protocol was to greatly lower the CFC's radiative contribution, and accidents of world politics reduced Russia's GHG contribution in the 1990s. CO2 emissions are rising >linear, so we're now a bit of a way from 'C' on that score, with little action in the pipeline to combat that. You also need to account for the difference between Hansen's sensitivity and the modern best estimate - all of which places us closer to 'B'.
You can see the charts at: Climate Opinions .
"that is to give a favoural impression of the projection. "
That is conjecture...and a red herring. We are discussing the removal of the scenarios B and C and then making the claim that Scenario A was Hansen et al's prediction.
I agree though that the observations should have been included though 2010 (too early for 2011).
But this excuse that "Well they allegedly did it!", is quite juvenile and is getting tiresome.
So Ron, please state for everyone here whether or not you support Michaels doctoring a graphic generated by scientists to misrepresent their position and thereby misleading Congress and the people of the US.
It appears to me that Mann has simply not updated his slides recently. Perhaps he rarely gives this talk. As your reference points out this makes the data look "slightly different". Who cares? Hardly comparable to Michaels claiming the opposite of what the data show.
In 1997 (the last full year of data at the time of Michael's testimony), Hansen's projected CO2 concentrations where 365.34 ppmv for scenario A, 365.13 ppmv for scenario B, and 363.31 for scenario C. For the same year, Mauna Loa shows 363.76 ppmv. So by the simplest, and easily available test, reality was running closer to Scenario C in 1997 than to Scenario B, let alone Scenario A. As you have shown, when all forcings are taken into account, 1997 was actually running below Scenario C:
It follows that his testimony represents either gross negligence (at best) or deliberate falsehood (far more probably). These standards are not obscure points, and the relevant facts have not been hidden from Michaels. So certainly his continued defense of the presentation represents deliberate falsehood, and makes the possibility of simple negligence as an explanation in 1998 extremely remote.
Further, the standard (quoted above) is not applicable to science. In science, it is understood that nobody has perfect knowledge. That does not preclude anybody from criticizing errors, nor absolve anybody from listening to those criticisms. The suggestion that no criticism be made in science except by perfect sources is just a demand that science cease. I am sure that is not the authors intentions, but it is certainly the consequence of applying that standard in science.
Turning to Mann's graph, it shows two defects. First, it shows the land station only data from GISS; and second, it truncates that data in 2005. Neither are acceptable practise. The Hansen predictions where for global temperatures, so global, ie, land/ocean temperatures should have been shown. What is more, old graphs in current use for presentations should be updated on an annual basis at minimum. Therefore, the criticisms of Michael Mann in that post are entirely justified.
What is not justified is the suggestion that the misrepresentation by Mann (whether accidental or not) is as bad as that by Michaels. It is not. In this case, a decidedly black pot is being used as an excuse for not noting that the kettle is full of three week old porridge, and has become a rat's nest.
Good points Tom.
Tom @14 - I agree with one exception. There's some question as to whether land-only or land-ocean data is more appropriate for comparison with Hansen's 1988 projections. In a 2006 paper, I believe Hansen argued that the average of the two might be the most appropriate. See my Hansen 1988 myth rebuttal linked at the end of the OP for additional details.
In this case it is particularly unfortunate that somebody who is subject to so much illegitimate criticism by fake skeptics should give them a genuine reason to criticize him.
http://www.meteo.psu.edu/~mann/Mann/lectures/index.php
There's no error in those graphs, as is, within the context of his usage. Mann even references model holding up to a decades test. It isn't deceptive or erroneous, and Ron Manley's chum-statement that the data was truncated is in the same league as "hide the decline".
1) Mann identifies scenario B as the scenario we have followed most closely ("... it turns out we have more or less followed that medium scenario ..." 2:18);
2) He claims Hansen's prediction was accurate ("... the warming predicted by the model is pretty much spot on ..." 2:26 ); and
3) He claims the prediction is a two decade prediction (so that's a very successful two decade in advance prediction." 2:32)
But, rather than showing two decades of data (1988-2008) he only shows 17 years (1988-2005). He does not mention the absent data, and given that the talk occurred in 2011, there is no good reason for the absent data.
Further, as discussed above, he did not show the most relevant temperature series, and he does not mention that he is not using the most appropriate temperature data. He does indicate that the observed data is "Observed weather station data" on the graph, but that would be by no means clear to the audience, and he certainly does not explain to the audience the difference between the land station only data, which he shows, and the land/ocean data which he should have shown.
In other words, he does not in anyway provide the necessary context which would justify the choices made in presenting that graph. Readers are certainly welcome to review the talk (which is otherwise very good).
I should note that:
a) Mann does terminate other graphs early, but so far as I know that is of no consequence as the other early terminations do not distort the data. It is, however, an indication of sloppiness in presentation.
b) Dana has shown that properly presented, Hansen's 2008 projections are remarkably accurate, suffering only from the fact that the climate sensitivity of his model is too high. That means the model does show that anthropogenic forcings are the dominant influence on global temperature change (excluding over very short term periods); and that with a corrected climate sensitivity, it means we are in very serious trouble if we do not curtail emissions.
But none of these points mean that Mann did not make a mistake in the graph he used in the presentation. He should acknowledge the mistake, and correct it before using that slide again in future.
1. Both presentations were to a lay audience; congress in the one case, the audience at a wide ranging event with a diversity of speakers in the other. Since it would be easy to ‘pull the wool over the eyes’ of such people, an ethical approach to climate science would require a high standard of transparency even at some risk of diluting the message.
2. In the long run it is important to demand the same rigour of those you agree with as of those you disagree with, a point which many of the comments above accept.
[dana1981] See my comment #16 in part 1. Short answer, it depends on what you're evaluating. If you want to know about the model accuracy, then you should look at the net forcing, because the model is simulating the climate response to the net forcing. It just so happens that Hansen only input GHG forcings (and a couple volcanic eruptions) into his model.
"Oddly, he often uses your submitted email to reply to any complaint, rather than in the comments.."
He is not permitted to do that. Your email on that site is meant to be confidential.
If if he has emailed you or someone else in the last week or so), please let me know.