


 Arguments


Scientific models saved lives from Harvey and Irma. They can from climate change too
Posted on 18 September 2017 by dana1981
The impacts of hurricanes Harvey and Irma were blunted because we saw them coming. Weather models accurately predicted the hurricane paths and anticipated their extreme intensities days in advance. This allowed millions of Floridians to evacuate the state, sparing countless lives.
Some contrarians have tried to downplay the rising costs of landfalling hurricanesby claiming they’re only more expensive because there are now more people living along the coasts with more expensive stuff vulnerable to hurricane damages. However, those arguments fail to account for our ability to predict hurricane tracks earlier and more accurately by using better and better scientific models. We’re able to prepare for hurricanes much better today than in the past because we have more warning.
Time to start listening to climate models
Although they focus on much different timescales and resolutions, climate and weather models are based on the same core physics. Scientists have a solid understanding of the Earth’s oceans and atmosphere, and that understanding is improving all the time.
Millions of people watched the evolution of the model forecasts for hurricanes Harvey and Irma, and made important decisions based on those forecasts. People trusted the models, and their trust proved to be well placed, as the model predictions were accurate.
And climate models have an even better track record.
40 years of remarkably accurate climate models
As I documented in my book Climatology versus Pseudoscience, since their inception in the 1970s, climate models have been remarkably accurate at predicting global warming. In a 1975 paper in Science, renowned climate scientist Wallace Broecker was one of the first to use early simple climate models to predict future global warming. Based on scientists’ understanding of the climate at the time, Broecker was only able to include the effects of human carbon emissions and ‘natural cycles’ (whose effects he overestimated) in his model, but the prediction was nevertheless remarkably accurate:
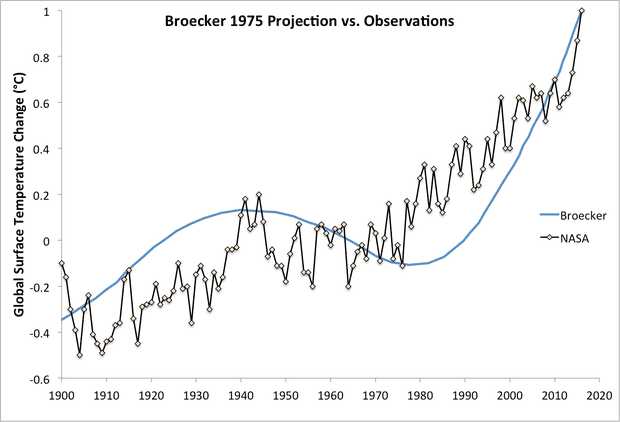
Wallace Broecker’s 1975 global warming prediction (blue) compared to observational data from Nasa (black). Illustration: Dana Nuccitelli
Renowned Nasa climate scientist James Hansen made even better global warming predictions in 1981 and 1988, and the IPCC improved further yet in 1990, 1995, 2001, and 2007. On the other hand, the few climate contrarians that have had the courage to make their own predictions (without using climate models) have fared remarkably poorly.
Meanwhile recent research has shown that climate models have been even more accurate than we thought, when we compare apples-to-apples.
And of course what those climate models tell us is extremely alarming. If we stay on our current path, we’re headed for 3–4°C global warming by 2100, which research indicates would lead to severe consequences like 40–70% of global species being at risk of extinction, millions more people being hit by coastal flooding, increased mortality from intensified heat waves, droughts, and floods, and so on.
This raises an obvious question – if people trust weather models, and climate models with their even stronger track record predict we’re on such a dangerous path, why aren’t people loudly demanding climate action?
Deniers have lied about climate models for two decades
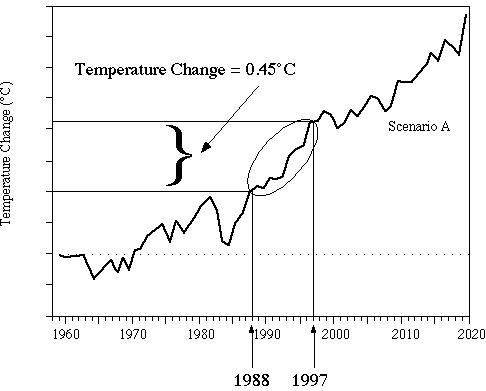
In 1998, leading up to the critically important Kyoto Protocol international climate negotiations, Patrick Michaels from the fossil fuel-funded Cato Institute ‘think tank’ testified before Congress. Not surprisingly, considering his heavy reliance on fossil fuel funding, Michaels made the case that the US should not sign on to the Kyoto agreement (and succeeded - although the Clinton administration signed the treaty along with 150 countries, the US Senate refused to ratify it).
In his testimony, Michaels essentially committed perjury in a reprehensibly dishonest effort to discredit Hansen’s 1988 global warming predictions. Hansen’s study had projected temperature changes under three different possible scenarios, which he called A, B, and C. In his testimony, Michaels deleted all but Scenario A with the highest greenhouse gas emissions, which was also the scenario that was least representative of real-world conditions. Worst of all, Michaels didn’t mention that he had deleted Hansen’s other scenarios, simply claiming (falsely):
[Hansen’s] model predicted that global temperature between 1988 and 1997 would rise by 0.45°C (Figure 1). Figure 2 compares this to the observed temperature changes from three independent sources. Ground-based temperatures from the IPCC show a rise of 0.11°C, or more than four times less than Hansen predicted.
You can see Michaels’ figure here – it even labeled Scenario A, but at no point did Michaels mention Hansen’s other scenarios. His claim that Hansen’s model predicted 0.45°C warming between 1988 and 1997 was flatly false – that was the model estimate under a scenario of much higher greenhouse gas emissions. Hansen subsequently asked, “Is this treading close to scientific fraud?” (yes, and to perjury).
That was the start of a now nearly 20-year effort by climate deniers to discredit climate models.


My personal view is P Michaels has no scientific integrity at all. It's lies by omission, with huge implications. Its just not something that can be brushed off lightly.
The guy has very little actual climate expertise. His degree is in biology. Quite why politicians listen to a biologist on predicting climate trends is beyond me, as its a question of atmospheric physics, climate history and processes, and computer modelling.
From Michaels wikipedia page:
"Climate scientist Tom Wigley,[33] a lead author of parts of the report of the Intergovernmental Panel on Climate Change, has stated that "Michaels' statements on the subject of computer models are a catalog of misrepresentation and misinterpretation … Many of the supposedly factual statements made in Michaels' testimony are either inaccurate or are seriously misleading."[34]"
"Michaels acknowledged on CNN that 40 per cent of his funding came from the oil industry.[39]"
[PS] Time to have another look at the comments policy.
Moderator, ok I should not have implied dishonesty. My bad.
But your own article above said and I quote "In his testimony, Michaels essentially committed perjury in a reprehensibly dishonest effort to discredit Hansen’s 1988 global warming predictions."
So you see how I was tripped up? You have a problem with consistency somewhere here. Its very confusing the mixed signals.
I stand by all the rest of what I said. I cant see how any of it infringes comments policy and you don't say. I quoted his wikipedia profile all of which include original source material referenced in a bibliography. I dont have all day to do more. And I wont be doing more.
I agree that it is inappropriate to only compare Hansen's A scenario against actual observed temps.
Hansen had three basic scenarios A: increase in CO 2 emissions by 1.5% per year, B: constant increase in CO 2 emissions after 2000, C: No increase in CO 2 emissions after 2000.
Through 2013, the observed global temps were slightly under the C scenario while the emissions were running slightly ahead of the projected A scenario. Then in 2015& 2016, with El Nino, the observed temps are running slightly under the Scenario B projected temps. So far in 2017 (after the 2015/2016 El Nino), the temps appear to be reverting back to the rate of warming observed since the 1998 El nino. (it is premature to reach a conclusion as to whether the slower rate of warming will hold since we only have 8 month of data.)
geoethic.com/2015/11/27/james-hansens-climate-models-versus-observations-1958-%C2%AD2015/
[PS] Discussion of Hansen 1988 goes here.
Tom13 @3 : quite so — though you are bold to predict a flattening of the rate of warming (for 2017 onwards). Do you have any reason for suggesting that? After all, there has been no reduction of the rate of heat energy accumulation (i.e. no reduction of the rate of nett energy inflow at Top Of Atmosphere).
The "geoethic" reference you supplied, is a link to a determinedly foolish denial of the physical processes that are causing the ongoing global warming (as evidenced by recent years' observations of surface temperature and ocean heat content). It's a case of denialism both stubborn and foolish.
Eclectic -
My basis - Historical trends - always a good place to start. The rate of warming since the end of the 2015/2016 El Nino has been very similar to the rate of warming post 1998 El Nino.
Tom 13 @5: Per the Met Ofice...
A Pacific flip triggers the end of the recent slowdown, News Release, Met Office, Sep 18, 2017
Thats what normally happens after an el nino. though eclectic was the one who questioned the reversion back to a similar warming trend that was in play after the 1998 el nino.
Tom13,
Just to be clear, are you referring to the temperature trend that can be seen to have been happening around 1998 if the extremely aberrant 1998 temperatures are ignored? Looking at any of the surface temperature data histories 1998 sticks up/out like a sore thumb.
Tom13 @5
"My basis - Historical trends - always a good place to start."
Then follow your own advice. Look at the overall global temperature trend for the last 150 years, a clear historical trend. Theres no sign of a slowdown here.
One planet - not sure what you asking -
1998 was a big el nino year and subsequent to the 1998 el nino, the rate of warming slowed considerably until the 2015/2016 el nino. My comment was only that the rate of warming after the 2015/2016 el nino has reverted back to a similar rate of warming that was observed after the end of the 1998 el nino. That slower rate of warming is likely to continue at least in the short term (3-5 years).
Nigelj #9
read my post at 10
Tom 13 @5
"The rate of warming since the end of the 2015/2016 El Nino has been very similar to the rate of warming post 1998 El Nino."
Why would you even focus on changes of less than even one year? Its at least partly natural variability, so doesn't indicate anything much about agw. It may continue at a slower rate for a few years as you say, for what its worth but so what?
We are more interested in long term trends. We have an obvious global warming trend over particularly the last 50 years that stands out clearly compared to data over the last 2000 years as in link below. No real sign of last 50 years slowing.
Theres no sign of things fundamentally slowing from 1998 - 2017 either. There was a slowdown from about 2002 - 2010 in the trend line as in the link below from NASA, but it was within realms of natural variability.
I mention all this because you claim to be interested in "historical trends".
www.ipcc.ch/publications_and_data/ar4/wg1/en/ch6s6-6.html
data.giss.nasa.gov/gistemp/graphs/
Tom13,
I am not sure what you are talking aboutregarding trends around 1998.
When I review any of the temperature data sets using a rolling 30 year average (what you would look at to see a 'trend') I do not see any marked change of the slope/trend at 1998. (The exercise I refer to is simple using the SkS Temperature Trend Calculator, just set the moving average to 360)
In the surface temperature data sets there is a flattening in the 50s and 60s. But since then the trend line has just been up. Other than that clear trend change, all I see is a momentary blip in the data line that may disappear if 1998 is igonored as an aberrant value (such a large departure from the other data it is to be excluded from the evaluation).
The satellite data sets are not really the surface temperature, are manipulations of satellite data that are still being adjusted in attempts to get reasonable results, and have too short of a time frame to meaningfully see the trend. But if you set the duration to 25 years (300 months) there is still no sign of a change of trend around the time of 1998 in any of the satellite data sets.
So to be clearer, please explain what you mean when you refer to trends around 1998. Providing mark-ups of the charts of temperature data history that can be generated using the SkS Temperature Trend Calculator would be helpful from my perspective.
Even 2015 - 2016 would not normally prove anything or indicate fundamental change. It's too short and mixed in with some natural variation, and some agw.
2015 - 2016 is significant mainly because it clearly ended the pause, and this is indeed significant as it shows models are not "broken" and never were.
Tom 13 @10:
If you read the Met Ofice news release, A Pacific flip triggers the end of the recent slowdown, and watch the two short videos embeded in it, you will learn that PDO and ENSO are two different cycles.
Two key paragraphs from the news release...
Tom13,
I have used the SkS Temperature Trend Calculator with the 15 year rolling average (180 months) the Met Office used. The 15 year average would show some of the variability of global averages that does not appear in longer roling averages.
I do indeed see a levelling off of the trend line in the teperature data sets when looking at that 'shorter-term trend line'. The leveling-off occurs in the early 2000's not at 1998. And the level period is quite short with a clear return to the rate of rise that was occurring before the brief leveling off.
It is harder to see the change of short term trend in the satellite data sets. But the satellite data are not surface temperature so the less noticeable change of trend in those data sets are not really a relevant issue.
Note that using a shorter term rolling average would show an even 'noisier' trend line. Using a 60 month average makes it very difficult to see the actual trend in any of the data sets (lots of ups and downs). And using a 13 month rolling average is almost useless for appreciating what is actually going on in terms of the long-term.
[PS] This is straying offtopic. If want to talk more about models reliability, then the "Models are unreliable" thread is more appropriate. And Tom13, note models have no skill at decadal level prediction and dont have claim to have any so no sloganeering around that please.
Getting back to the article, picking just one of Hansen’s predictive scenarios was far too “selective” (choosing my words carefully) but I would go further and say its rather selective to focus just on Hansen. It would have been more representative to pick an average of all projections made at the time for "business as usual"
I say this with huge respect for Hansen who is quite possibly some kind of genius, but the world doesn’t revolve entirely around him and Al Gore. A lot of people have concluded we are warming climate going right back to Arrhenius a century ago.
[PS] You said it. Hansen had his sensitivity too high in 1988 for reasons that are actually interesting. You dont see pseudo-skeptics giving much attention to the oldest quantitative estimate for global warming - Broecker's paper of 35 year ago.
Thanks for that, OnePOF @16 .
It is worth re-emphasizing the bigger picture [as touched on, in post #4]
That is — until such time as a real pause can occur in nett radiational energy inflow at the planetary level [at Top Of Atmosphere], it remains impossible for any actual physical pause in global warming to occur. Essentially, a real pause or warming-trend slowdown can only occur after the atmospheric CO2 level has stopped rising. And there is no sign of that happening within the next 3 decades.
Sure, there will always be brief fluctuations in "trend", from minor natural variations in ocean currents and/or volcanic eruptions — but no pause is possible in real terms. To suggest otherwise is to commit obfuscation [to put it politely!] .
Moderator Response:
[PS] Discussion of Hansen 1988 goes here.
Hansen's 1988 prediction is covered in four (4) paragraphs of this article - should be appropriate to respond in this thread
[PS] Skeptic talking points about Hansen however are best discussed on the indicated thread where more context is available. I am concerned to ensure any wide ranging discussion of Hansen is in a more appropriate place as it is not the main point of this topic.
Recommended supplemental reading:
Next-generation models revealing climate change effect on hurricanes by Richard Gray, Horizon, Sep 22, 2017