Climate Science Glossary

Term Lookup

Enter a term in the search box to find its definition.

Settings

Use the controls in the far right panel to increase or decrease the number of terms automatically displayed (or to completely turn that feature off).

Term Lookup

Settings


All IPCC definitions taken from Climate Change 2007: The Physical Science Basis. Working Group I Contribution to the Fourth Assessment Report of the Intergovernmental Panel on Climate Change, Annex I, Glossary, pp. 941-954. Cambridge University Press.

Home Arguments Software Resources Comments The Consensus Project Translations About Support

Bluesky Facebook LinkedIn Mastodon MeWe

Twitter YouTube RSS Posts RSS Comments Email Subscribe


Climate's changed before
It's the sun
It's not bad
There is no consensus
It's cooling
Models are unreliable
Temp record is unreliable
Animals and plants can adapt
It hasn't warmed since 1998
Antarctica is gaining ice
View All Arguments...


Username
Password
New? Register here
Forgot your password?

Latest Posts

Archives

The Year After McLean - A Review of 2011 Global Temperatures

Posted on 11 February 2012 by dana1981

In The Day After McLean we examined a prediction by data analyst and member of the Australian Climate Science Coalition John McLean regarding the 2011 global average surface temperature:

"it is likely that 2011 will be the coolest year since 1956 or even earlier"

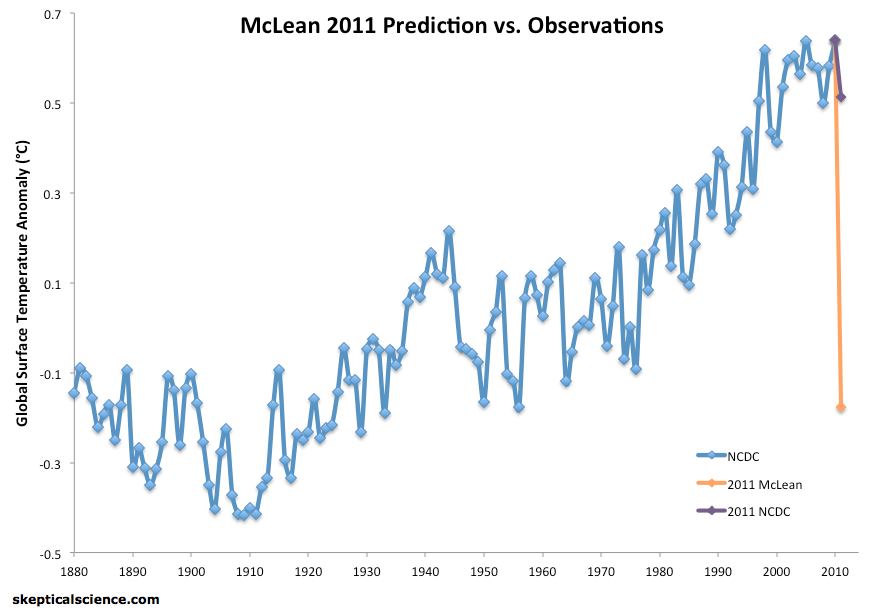
The title of the post was a reference to the film The Day After Tomorrow (which depicts extremely rapid global cooling) because of the rapid cooling which would have to occur for McLean's prediction to come to fruition, as illustrated in Figure 1.

McLean failure

Figure 1: NCDC global average surface temperature from 1880 through 2010 (blue), McLean's 2011 prediction (orange), and the actual 2011 NCDC temperature (purple).

Even without knowing the actual 2011 temperature, the sheer magnitude of the temperature drop predicted by McLean, unrivaled in modern history, makes one wonder: what was he thinking?

La Niña

The basis of McLean's prediction was a paper we have previously examined, McLean et. al (2009).  In their paper, McLean et al. found that the El Niño Southern Oscillation (ENSO) has a large influence on global temperature variability (i.e. short-term changes), but they also slipped a conclusion into their paper which was not supported by their research:

"Overall the results suggest that the Southern Oscillation exercises a consistently dominant influence on mean global temperature"

This claim is simply incorrect, and could not be supported by their research, because the first step in the McLean et al. analysis removed any long-term trends from the original temperature data.  Thus their analysis was incapable of determining the dominant influences on long-term temperature changes.

However, 2011 was indeed influenced by a strong La Niña event.  According to Foster and Rahmstorf (2011), there is a 2 to 4 month lag before changes in the Multivariate ENSO Index (MEI) are reflected in global surface temperatures.  According to the MEI data, when applying a 3-month lag, 2011 was impacted by the 5th-largest La Niña influence of any given year since 1950, and the largest since 1974. 

Thus McLean was correct to predict that La Niña would have a significant cooling effect, but he overestimated the strength of that cooling effect by an order of magnitude. 

Short-Term Natural Temperature Influences

Using the results of the Foster and Rahmstorf (2011) multiple linear regression approach, ENSO had a cooling effect of approximately 0.08°C on the 2011 global surface temperature.  However, the difference between the 2010 and 1956 temperatures (McLean's 2011 cooling prediction) was 0.8°C - McLean predicted that La Niña would have a cooling effect approximately 10 times larger than it actually did.  Moreover, ENSO has not caused more than a 0.2°C year-to-year temperature swing since 1950, and the largest single year-to-year temperature swing in the NCDC record is 0.26°C (1963 to 1964, which was influenced by the Mt. Agung volcanic eruption).

Tamino has provided an update to Foster and Rahmstorf to include the 2011 data.  When the effects of ENSO and solar and volcanic activity are removed from the temperature data, 2011 is either the 2nd- or 5th-hottest year on record, depending on which data set we choose (Figure 2).

2011 FR11

Figure 2: Annual averages of the adjusted data from Foster and Rahmstorf (2011) with the effects of ENSO and solar and volcanic activity removed.

Refusing to Admit Mistakes

McLean has followed the example of fellow fake skeptic Patrick Michaels, who we recently saw has been unwilling to admit his obvious and indisputable errors in distorting the research of James Hansen and colleagues.  In this case, there is no question that McLean's prediction was an exceptionally poor one.  Any reasonably intelligent person would come to the same conclusion simply through a cursory examination of Figure 1 above.

And yet in 9 Months After McLean, we saw that McLean continued to stand behind his initial prediction halfway through 2011:

"Last time I looked 2011 wasn't over yet. It's a bit premature of you to be crowing about an annual average when the year isn't complete."

I have recently been in contact with McLean, who has promised to write a post about his prediction and results, which he claimed might somehow surprise me, but as of yet he has not produced the promised blog post

Although Foster et. al (2010) showed that McLean et al. (2009) could not draw any conclusions about long-term temperature changes or influences, and although the invalid conclusion of the paper has clearly caused McLean to make a very wrong temperature prediction, he still refuses to admit his errors.

2011 - Another Hot Year

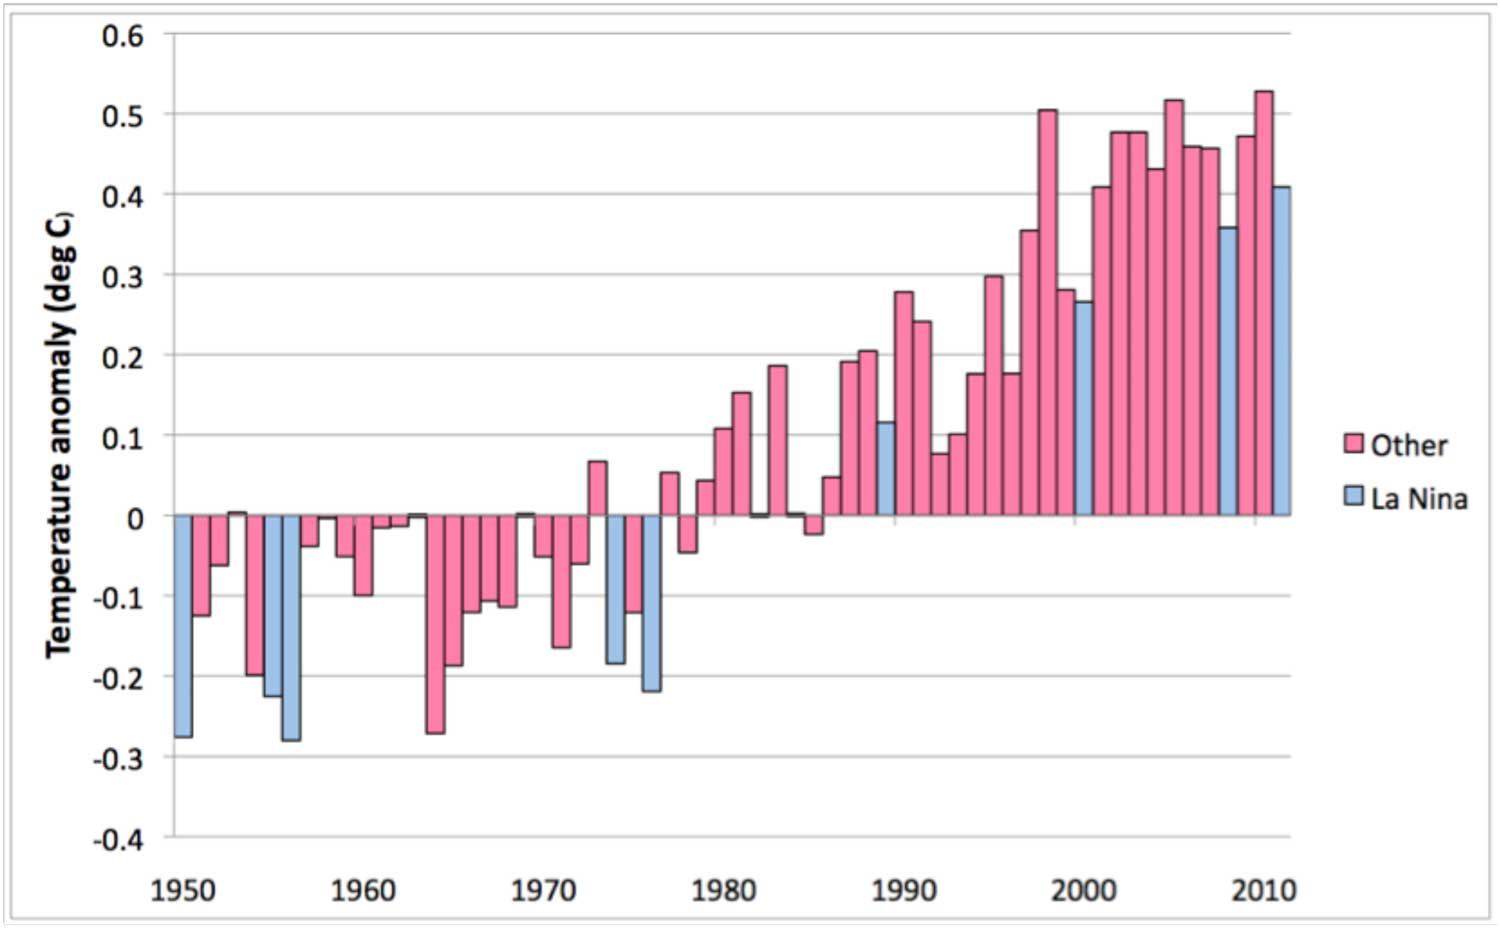
Regardless, 2011 predictably turned out to be another hot year.  Taking the average of the NOAA NCDC, NASA GISS, and HadCRUT3 surface temperature records, 2011 was the 10th-hottest year on record.  When the effects of ENSO and solar and volcanic activity are removed, Foster and Rahmstorf find it to be in the top 5 hottest years on record.  Moreover, as the World Meteorological Association found, 2011 was the hottest La Niña year on record despite having the 5th-strongest La Niña influence since 1950, and the strongest since 1974 (Figure 3).  This is a clear indication that human-caused global warming continues its inexorable rise underneath the short-term effects of natural variability.

temps

Figure 3: Average of NOAA, GISS, and HadCRUT3 annual global surface temperature anomalies.  Blue bars indicate years influenced by La Niña events.  2011 is the warmest La Niña-influenced year on record (Source: WMO)

0 0

Printable Version  |  Link to this page

Comments

Prev  1  2  

Comments 51 to 76 out of 76:

  1. "Your last paragraph is also in error, and is a point that has been made repeatedly. Surface temperatures are a small component of where the energy budget imbalance shows up. It is perfectly consistent to have an increasing warming imbalance and a stasis in surface temperatures if ocean circulation has been redistributing sufficient heat. Read the paper by Easterling and Wehner (2009) on this subject." Since AGW started around 1975 we have been seeing a steady rise in surface temperatures and a claimed increasing warming imbalance due to the almost linear effect of CO2GHG from human releases. We now have a stasis in surface temperatures, despite the same claims of ongoing increasing warming imbalance due to the same almost linear effect of CO2GHG from human releases. To explain the stasis in surface temperatures - the warming imbalance has directed itself almost completely into absorption by the oceans. Which begs the question - why was surface temperature rising for the first 25-30 years of AGW - and this heat not being fully sequestered in the oceans by the same mechanism which has been operating in the past 7-10 years? The likely answer could be an unknown ocean cycle, or it could be that the warming imbalance has in fact decreased, but it seems unlikely that the warming balance has steadily increased by CO2GHG forcing and all of it has gone into the oceans.
    0 0
  2. Ken wrote: "Aerosol cooling is not a small Item. From memory, Hansen was claiming about -1.5W/sq.m as the Aerosol cooling forcing." Actually, -1.6 +/- 0.3... net for all impacts of human made aerosols. Which the same paper pegs as about half the recent GHG forcing. It shows a much smaller aerosol forcing, in line with other estimates, prior to ~1990. That is a fairly large short term impact. However, it remains quite minor as a long term factor because the only way that the aerosol forcing can increase is for the rate of aerosol release into the atmosphere to increase... whereas GHG forcing increases with the accumulation of GHGs. To put that in practical terms; Let's say renewable energy adoption resulted in a 10% decrease in coal plants worldwide. That would result in a decrease in aerosol forcing from coal plants of 10% within just a few years... but the GHG forcing from coal plants would not decrease. In fact, it would continue increasing... just at a 10% slower rate. If Hansen is correct then the recent massive build-up of coal plants in Asia has caused significant short term aerosol cooling. However, this is a minor factor compared to the GHG warming observed over the 20th century and/or projected over the 21st. It is also not able to continue growing indefinitely because aerosols do not remain in the atmosphere for long. As to semantic questions about 'deep'... there is uncertainty even around the 0-700m ocean heat readings, considerably more for values down to 2000m, and very little information for values below 2000m. However, as with aerosol impacts, the uncertainty range here is small compared to long term GHG forcing, long term solar forcing, and short term volcanic forcing... which can be measured closely enough to 'separate out'. The answer to your original question thus continues to be that these aerosol effects are not "taken out" because they cannot be quantified precisely enough to do so. The fact that you keep running off on further and further disconnected tangents rather than acknowledging this (frankly obvious) conclusion and moving on makes this 'discussion' seem rather pointless. You just keep finding new semantic irrelevancies to argue with no actual 'point' that I can identify.
    0 0
  3. Ken Lambert There is no need to invoke some unknown ocean circulation as ENSO already does a good job, as shown by the multitude of posts here onthe subject that show the result of excluding the effects of volcanic activity and ENSO etc. via regression techniques. This leaves you with a steady rising trend. See Figure 2! Occam's razor suggests that you shouldn't needlessly introduce new entities unless the observations really can't be explained by what is already contained in the current explanation..
    0 0
  4. DM & CBD DM "There is no need to invoke some unknown ocean circulation as ENSO already does a good job" According to Fig 3 there have been 6 La Ninas and many 'other' ENSO cycles since 1975. The effect is supposed to be neutral on the overall warming imbalance. So ENSO is not the explanation for the last decade stasis in surface temperatures. CBD "The answer to your original question thus continues to be that these aerosol effects are not "taken out" because they cannot be quantified precisely enough to do so." It seems that when a tough question is posed - the resort is to "we can't accurately measure this". If that is the case then confident predictions of the magnitude of the warming imbalance can't be made either.
    0 0
  5. "So ENSO is not the explanation for the last decade stasis in surface temperatures" Foster and Rahmsdorff however show quantitatively that combination of ENSO, Solar and aerosol are sufficient to explain the observations. You dont like the method but so far I dont see are sensible critique of thus other than you dont like their results.
    0 0
  6. And with reference to last decade - La Nino's have dominated since 2005. Now what climate science expects is that when natural factors go positive then global temperatures will steadily rise again. If they dont, then climate science needs fixing. On the other hand, if they do will that be enough to change your mind?
    0 0
  7. There has been several ups and downs of the sea level in the last few days which average to zero. So the lowering of the sea level in the last couple of hours must have a different cause. Or not?
    0 0
  8. scaddenp #56 Do you mean El Nino or La Nina have dominated since 2005?
    0 0
  9. scaddenup #55 "Foster and Rahmsdorff however show quantitatively that combination of ENSO, Solar and aerosol are sufficient to explain the observations." Well that is 3 reasons not just ENSO.
    0 0
  10. Ken Lambert: "So ENSO is not the explanation for the last decade stasis in surface temperatures." This is rather silly pedandtry, ENSO is AN explanation for the "stasis", not necessarily THE explanation. I note you have performed the same pedantry in a response to scaddenup. Such behaviour does you no credit whatsoever, and I suggest you avoid it in future. Foster and Rahmsdorff's model uses ENSO, solar and aerosol forcings to explain the variations. If you want to show that ENSO is not responsible, you need to show that changes in solar and aerosol forcings that can explan the "stasis" of the last decade, whilst still being consistent with the observations since the start of the analysis? If you can demonstrate that, then your assertion might have some value, the ball is in your court. However, the major movement in the goalposts is that you said that "likely answer could be an unknown ocean cycle". I pointed out that this would be in contravention of Ocamm's razon becase ENSO already does a good job (as it happens in conjunction with solar and aerosol forcing if you want to be pedantic). Nothing you have written contradicts that.
    0 0
  11. La Nina, and no its not "just ENSO" but look at the relative weighting. So are you agreeing that to change your mind if future climate does indeed conform to predictions?
    0 0
  12. Minor quibble:
    "Overall the results suggest that the Southern Oscillation exercises a consistently dominant influence on mean global temperature"
    In the context of the (intro) paragraph, that sentence refers to variance. Also, the same language ('dominant influence') is reflected in the first paragraph of the conclusions, which again is about variance. There are less ambiguous quotes connecting ENSO to long-term trends just prior to and within the conclusions of the paper.
    "The strength of the time lagged relationship between ENSO and GTTA, as demonstrated here, suggests that variation in the poorly modeled ENSO may account for the deficit and may be the cause of a large part of the observed warming since the midtwentieth century."
    and
    "Finally, this study has shown that natural climate forcing associated with ENSO is a major contributor to variability and perhaps recent trends in global temperature,..."
    http://www.auscsc.org.au/images/PDF/influenceofenso.pdf
    0 0
  13. DM, Barry, scaddenp If the facts change - so do my opinions - what do you do sir? (J M Keynes I think) DM ENSO is supposed to be neutral by current opinion (eg. Trenberth) - an internal heat redistribution cycle - not an external forcing. Solar is supposed to be small +/-0.13W/sq.m on the 11 year cycle. Not a big player in a reported 0.9W/sq.m imbalance. Aerosols are a big unknown. Hansen thinks they are a much bigger cooling forcing than Trenberth. All of the above could be wrong - but we are talking liklihoods with current state of scientific knowledge. ENSO could be an external forcing running on a longer cycle (a mysterious ocean cycle) - I have suspected that its ability to exchange heat with space is not entirely symmetrical which would be the case if it were neutral. Interestingly Barry #62 seems to suggest this. However you can't pin ENSO for the recent (up to 14 year)stasis in surface temperatures where there are several cycles of La Nina and El Nino in that period - unless there is a longer cycle of asymmetry of heat loss verses heat gain involved - ie. it becomes an external forcing.
    0 0
  14. Ken Lambert ENSO is approximately neutral when looked at on a suficiently long timescale. That does not mean it is exactly neutral over 30 years, and it definitely doesn't mean that it will be neutral over say the last decade. A combination of aersols, solar and ENSO have been shown to be able to explain the variability in climate over the last 30 years or so. This means invoking some additional ocean forcing is unnecessary and contravenes Ockams razor, and you have provided exactly zero evidence to suggest it even exists. So I repeat the challenge (in even plainer terms). Demonstrate that the observed climate over the last 30 years cannot be dequately explained by (i) a long term linear trend (ii) ENSO (iii) solar forcing and (iv) aerosol forcing. If you cannot do this, they you have no good reason to invent some mysterious ocean circulation. The ball is in your court. BTW, fact do change my opinion, but your problem is that you present no facts or even evidence to suggest the existence of the mysterious ocean circulation.
    0 0
  15. For all of 14 years, it has been hot. For trend, El Ninos dominance in first half and La Nina in second half has an influence. However, all of this is quantified in F&R and no amount of hand-waving by you can change that. The numbers speak for themselves.
    0 0
  16. Ken Lambert, my point was semantical. In no way do I endorse the suggestion that ENSO flux is an external forcing, any more than I think the seasons are responsible for the global warming of the last century.
    0 0
  17. DM "If you cannot do this, they you have no good reason to invent some mysterious ocean circulation. The ball is in your court." An unsymmetrical ENSO over 10 years implies a larger cycle of ENSO. You say 30 years is not exactly neutral either. That implies a longer ENSO cycle (return to neutral) than 30 years. It is not mysterious just deductive. William of Ockham would no doubt agree.
    0 0
  18. Ken Lambert wrote "An unsymmetrical ENSO over 10 years implies a larger cycle of ENSO." Nonsense, ENSO is not perfectly periodic, so an assymetry over ten years does not require a "larger cycle of ENSO". If you doubt this, then download one of the ENSO indices and compute the decadal trends, go on, I dare you. William of Ockam most certainly would not have agreed with any deduction that led to a more complicated model that did not explain the observations any better than a more simple model. That is the whole point of his razor. ENSO + solar + aerosol + trend does a very good job of explaining the observations, so there is no evidence that supports the deduction of some greater cycle. If you think there is, then the onus is on you to demonstrate that this is the case, rather than just making unsupported assertions.
    0 0
  19. Oscillation does not mean cycle. I once tried to find references on ENSO periodicity. Within 15 min of googling I had found a variey of papers trying to defend periodicities between 8 and 60 years. It remains to be shown that ENSO has any periodicity at all; it is quite possible that it is purely stochastic. In fact I do not know of solid evidence to the contrary at this point. If there is some, pointers are welcome.
    0 0
  20. Ken Lambert Even for a perfect sinusoid it only has a zero trend if you pick the start and end points to give a cosine, rather than (say) a sine, so your assertion that a larger cycle were necessary is clearly incorrect. BTW, the "go on, I dare you" was intended as tongue in cheek, basically pointing out that you need to go and test the validity of your understanding of the maths and the data, as you don't appear to be willing to accept this fact when it is just explained to you. I'm sorry that this came across as being agressive; it was meant as a challenge, but not in bad temper. Please download one of the ENSO indices. You ought to be able to see just from the graph that it will not cancel out to a zero trend on a decadal basis. If that doesn't convince you, then go and actually compute the decadal trends. The beginning of true skepticism is self-skepticism - please go and test your understanding of trends in quasi-periodic signals, it is clearly faulty at present.
    0 0
    Moderator Response:

    [DB] Please note that Ken Lambert is engaged in pointless trolling, for which his last comment (since deleted) makes clear.

    [Dikran Marsupial] Thanks DB, I have moderated my post in response to make sure it is still fair to Ken following the deletion of his post.
  21. DM "The beginning of true skepticism is self-skepticism - please go and test your understanding of trends in quasi-periodic signals, it is clearly faulty at present." (-Snip-) ENSO has not been accurately measured for much more that 50 years if that. It requires accurate spatial measurement of ocean temperatures. Earlier ENSO cycles are estimated or inferred and the neutrality of their energy balances similarly little known.
    0 0
    Response:

    [DB] Inflammatory snipped.

  22. Ken Lambert Just go and perform the analysis and demonstrate that your inference of a longer cycle is actually warranted. Either you can demonstrate that ENSO cancels out to a zero trend over a decadal period, or you can show that ENSO+solar+aerosols don't adequately explain climatic changes. Either way, the onus is on you do demonstrate the valdity of your assertions. Like it or not, that is the way science works.
    0 0
  23. Claims of Mysterious Unknown Cycles (MUC's, for the purpose of this post) are one of the more frequently invoked claims made in objection to current consensus theories on greenhouse gases and climate change. But without evidence for MUC's, Occams razor indicates that GHG theories that are supported by the evidence are far more likely to be the case. To quote Christopher Hitchens: "Forgotten were the elementary rules of logic, that extraordinary claims require extraordinary evidence and that what can be asserted without evidence can also be dismissed without evidence." Ken Lambert - You have now clearly stated that there is no evidence, there is insufficent data, to support MUC's for the ENSO. I believe such claims can now be dismissed.
    0 0
  24. An addendum to my previous post: Those claiming that the ENSO (or PDO, or ...) has long term cyclic (or acyclic, for that matter) imbalance have never been able to answer an additional very important question: If such variability exists, why have we not seen such warming before? Even beyond the energetic impossibilities of the observed energy coming from nowhere (if it's not from GHG entrapment), why are there no indications of such excursions in the past? Some have claimed that the resolution of paleo data is insufficient to show such spikes in the past (I would disagree) - never speaking to the point that if such occurred an equally strong immediate downspike would be required in order to reset the climate state so that it (potentially) didn't show in the records. That's a great many "what-ifs", with zero supporting data. Again, assertions without evidence can be dismissed without evidence...
    0 0
  25. Ken Lambert wrote "However you can't pin ENSO for the recent (up to 14 year)stasis in surface temperatures where there are several cycles of La Nina and El Nino in that period - unless there is a longer cycle of asymmetry of heat loss verses heat gain involved - ie. it becomes an external forcing." So his claim was clearly about the recent behaviour of ENSO and its possible effects on recent climate. Hence his claim that "ENSO has not been accurately measured for much more that 50 years if that. It requires accurate spatial measurement of ocean temperatures." is clearly an attempt to move the goal-posts as it is entirely irrelevant to the question of whether ENSO averages out to a zero trend on decadal timescale or whether ENSO can explain the observed recent "stasis".
    0 0
  26. "I have recently been in contact with McLean, who has promised to write a post about his prediction and results, which he claimed might somehow surprise me..." I just looked at the link but couldn't see anything, is it on the front page or have we heard anything?
    0 0

Prev  1  2  

You need to be logged in to post a comment. Login via the left margin or if you're new, register here.


The Consensus Project Website

THE ESCALATOR

(free to republish)


© Copyright 2024 John Cook
Home | Translations | About Us | Privacy | Contact Us