Climate Science Glossary

Term Lookup

Enter a term in the search box to find its definition.

Settings

Use the controls in the far right panel to increase or decrease the number of terms automatically displayed (or to completely turn that feature off).

Term Lookup

Settings


All IPCC definitions taken from Climate Change 2007: The Physical Science Basis. Working Group I Contribution to the Fourth Assessment Report of the Intergovernmental Panel on Climate Change, Annex I, Glossary, pp. 941-954. Cambridge University Press.

Home Arguments Software Resources Comments The Consensus Project Translations About Support

Bluesky Facebook LinkedIn Mastodon MeWe

Twitter YouTube RSS Posts RSS Comments Email Subscribe


Climate's changed before
It's the sun
It's not bad
There is no consensus
It's cooling
Models are unreliable
Temp record is unreliable
Animals and plants can adapt
It hasn't warmed since 1998
Antarctica is gaining ice
View All Arguments...


Username
Password
New? Register here
Forgot your password?

Latest Posts

Archives

Fritz Vahrenholt - Duped on Climate Change

Posted on 15 February 2012 by dana1981

German electric utility executive Fritz Vahrenholt is co-author (along with geologist Sebastian Lüning) of a book expressing "skepticism" regarding the human contribution to global warming, which predictably has been trumpeted by the usual climate denial enablers.  Why should we particularly care what Vahrenholt thinks about climate science?  That is something of a mystery - he has a PhD in chemistry and has worked in the energy sector for Shell Oil and wind turbine maker RePower.  Vahrenholt and Lüning both currently work for RWE Innogy, Germany's second-largest energy company (Vahrenholt as a manager, Lüning as a scientist in its oil and gas division).

Vahrenholt admits he has no expertise in climate science, but apparently his status as "Germany’s Top Environmentalist" (a title which Vahrenholt appears to have been awarded just recently by anti-climate think tanks and denialists) and his climate "skepticism" are sufficient for some people to take his climate claims seriously.

In an interview with Der Spiegel, Vahrenholt discusses why he chose to write a book rather than attempting to conduct and publish scientific research.

SPIEGEL: You make concrete statements on how much human activity contributes to climatic events and how much of a role natural factors play. Why don't you publish your prognoses in a professional journal?

Vahrenholt: Because I don't engage in my own climate research. Besides, I don't have a supercomputer in my basement.  For the most part, my co-author, geologist Sebastian Lüning, and I merely summarize what scientists have published in professional journals -- just as the IPCC does.

However, as we will soon see, the difference between Vahrenholt and the IPCC is that the latter accurately summarizes the body scientific literature, while the former misrepresents his sources and only listens to a few select "skeptic" scientists.

Misrepresenting the IPCC

In the interview, Vahrenholt makes a statement about the IPCC which reveals that he simply has not done his research.

"The long version of the IPCC report does mention natural causes of climate change, like the sun and oscillating ocean currents. But they no longer appear in the summary for politicians. They were simply edited out."

Vahrenholt refers to the IPCC Fourth Assessment Report Summary for Policymakers (SPM).  The following quotes are taken directly from the SPM, which Vahrenholt claims has edited out all mention of natural causes of climate change.  The first quote is the first sentence in the SPM.

* "The Working Group I contribution to the IPCC Fourth Assessment Report describes progress in understanding of the human and natural drivers of climate change, observed climate change, climate processes and attribution, and estimates of projected future climate change."

* "Human and Natural Drivers of Climate Change

Changes in the atmospheric abundance of greenhouse gases and aerosols, in solar radiation and in land surface properties alter the energy balance of the climate system.  These changes are expressed in terms of radiative forcing, which is used to compare how a range of human and natural factors drive warming or cooling influences on global climate."

* "Changes in solar irradiance since 1750 are estimated to cause a radiative forcing of +0.12 [+0.06 to +0.30] W m–2, which is less than half the estimate given in the TAR."

* "It is very unlikely that climate changes of at least the seven centuries prior to 1950 were due to variability generated within the climate system alone. A significant fraction of the reconstructed Northern Hemisphere inter-decadal temperature variability over those centuries is very likely attributable to volcanic eruptions and changes in solar irradiance, and it is likely that anthropogenic forcing contributed to the early 20th century warming evident in these records."

* "The observed widespread warming of the atmosphere and ocean, together with ice mass loss, support the conclusion that it is extremely unlikely that global climate change of the past 50 years can be explained without external forcing, and very likely that it is not due to known natural causes alone."

There are more such examples.  Then there's Figures SPM.2 and SPM.4:
spm.2

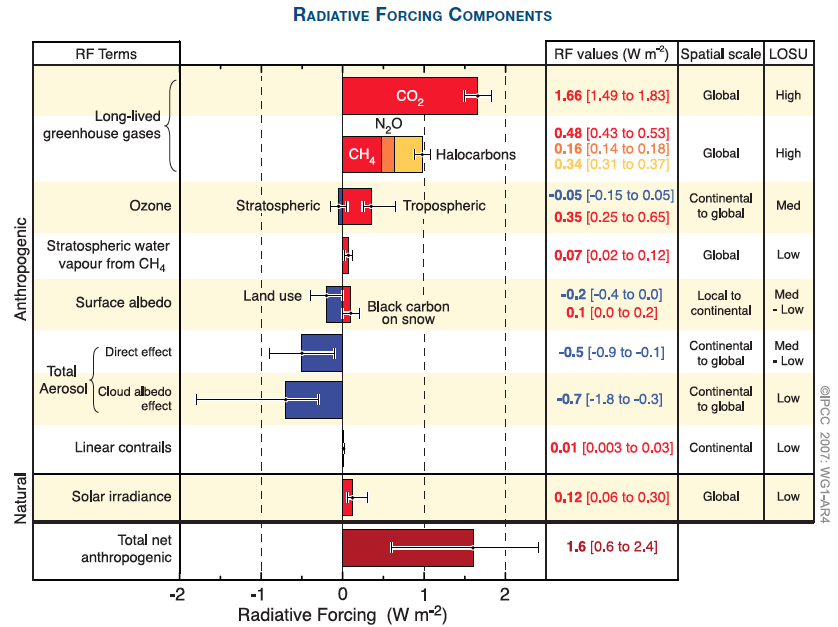
Figure SPM.2: Global average radiative forcing (RF) estimates and ranges in 2005 for anthropogenic carbon dioxide (CO2), methane (CH4), nitrous oxide (N2O) and other important agents and mechanisms, together with the typical geographical extent (spatial scale) of the forcing and the assessed level of scientific understanding (LOSU). The net anthropogenic radiative forcing and its range are also shown. These require summing asymmetric uncertainty estimates from the component terms, and cannot be obtained by simple addition.  Additional forcing factors not included here are considered to have a very low LOSU. Volcanic aerosols contribute an additional natural forcing but are not included in this figure due to their episodic nature. The range for linear contrails does not include other possible effects of aviation on cloudiness.

spm.4

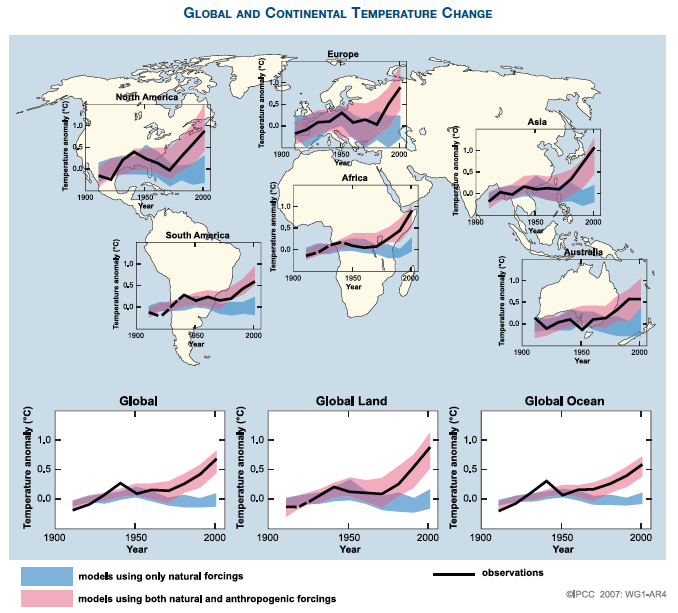
Figure SPM.4 - Comparison of observed continental- and global-scale changes in surface temperature with results simulated by climate models using natural and anthropogenic forcings. Decadal averages of observations are shown for the period 1906 to 2005 (black line) plotted against the centre of the decade and relative to the corresponding average for 1901–1950. Lines are dashed where spatial coverage is less than 50%. Blue shaded bands show the 5–95% range for 19 simulations from five climate models using only the natural forcings due to solar activity and volcanoes. Red shaded bands show the 5–95% range for 58 simulations from 14 climate models using both natural and anthropogenic forcings.

Clearly the SPM explicitly discusses natural contributions to global warming, and explains that according to the body of scientific evidence, their contribution to the observed warming is small.  Frankly if Vahrenholt can't even accurately read the 18-page SPM, it's exceptionally difficult to take him seriously.  His subsequent comments in the interview reveal that he has been very selective about what scientific research he chooses to accept.

Misrepresenting Global Warming

Early in the interview, Vahrenholt repeats a myth which has become increasingly popular amongst climate contrarians.

"It hasn't gotten any warmer on this planet in almost 14 years, despite continued increases in CO2 emissions. Established climate science has to come up with an answer to that."

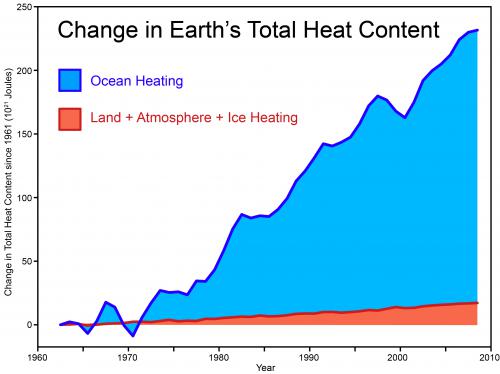
Of course our first answer must point out that Vahrenholt's assertion is false.  Over the past 14 years, the average global surface temperature has warmed approximately 0.13°C, according to data from the NASA Goddard Institute for Space Studies.  And of course surface air warming only represents a very small percentage of global warming, which has continued uninterrupted:

global heat content

Figure 1: Global heat content, data from Church et al 2011.

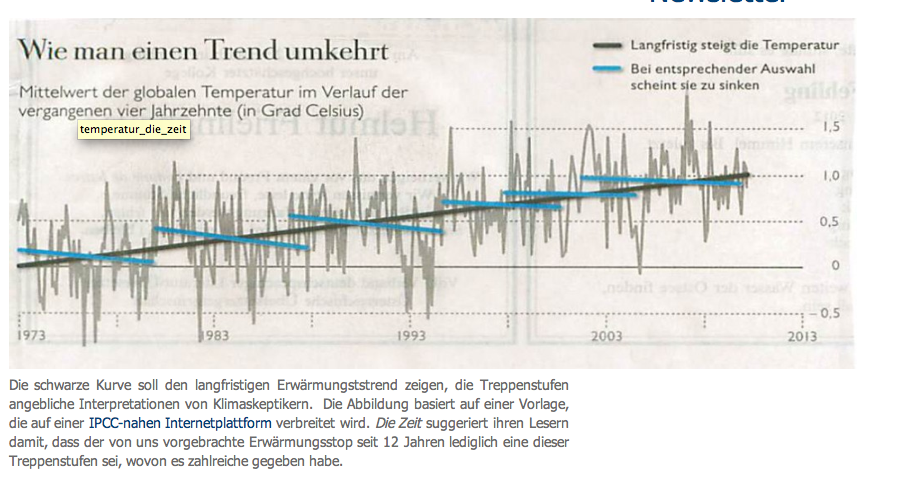
And of course there's the fact that the odd timeframe choice of 14 years conveniently begins at the peak of the strongest El Niño in a century (a.k.a. cherrypicking of short-term data).  This cherrypicking is illustrated by The Escalator, which was used by German newspaper Die Zeit to debunk this myth from Vahrenholt's book (Figure 2).

german newspaper escalator

Figure 2: Die Zeit use of The Escalator

We should note that while we are flattered that Die Zeit has described Skeptical Science as "an internet platform close to the IPCC" in their figure caption, we are in no way affiliated with the IPCC.

The second answer to Vahrenholt's concern about the dampened surface warming over the past decade or so involves the fact that virtually every non-greenhouse gas effect acted in the cooling direction over that period.  Human aerosol emissions increased, blocking more sunlight.  Heat accumulated in the deep oceans.  The solar cycle went into an extended minimum.  There were a number of strong La Niña events.  Foster and Rahmstorf (2011) showed that when we filter out the latter two effects and that of volcanic activity, the warming of surface temperatures has not even slowed (Figure 2).
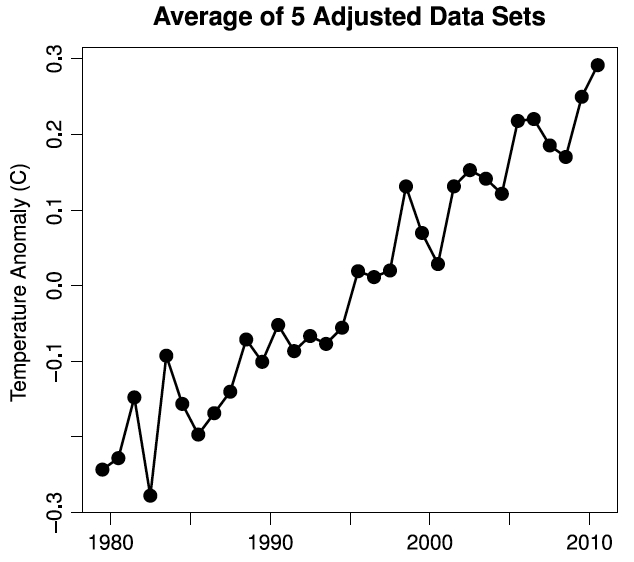
Figure 2: Average temperature changes recorded by 5 teams of scientists: 2 working on satellites (University of Alabama, Huntsville and Remote Sensing Systems) and 3 working with thermometers and ship/buoy measurements (UK Hadley Centre & Climate Research Unit, NASA Goddard Institute for Space Studies and the US National Climatic Data Centre. Foster and Rahmstorf (2011) statistical methods have been used to 'take out' the effects of volcanic eruptions, Pacific Ocean cycles and the Sun.

Blaming the Sun

Like David Archibald, Vahrenholt exaggerates the solar influence on global temperature.

"In the second half of the 20th century, the sun was more active than it had been in more than 2,000 years. This "large solar maximum," as astronomers call it, has contributed at least as much to global warming as the greenhouse gas CO2."

In the second half of the 20th century, solar activity was also flat.  Vahrenholt does not seem to understand that the climate responds to increasing solar activity, not flat solar activity, even if at a relatively high level.  It's true that solar activity increased leading up to the mid-20th century, which contributed to the warming observed from about 1910 to 1940.  However, total solar irradiance (TSI) increased by less than 2 Watts per square meter (W/m2) leading up to 1940 (i.e. see Vieira 2011 and Jones 2012, with more recent reconstructions showing a smaller TSI increase of generally less than 1 W/m2 during this period).

We can estimate the equilibrium temperature response to this TSI increase by multiplying the radiative forcing by the climate sensitivity parameter (λ).

The solar radiative forcing for a 2 W/m2 increase in TSI is just 0.35 W/m2, compared to the ~1.6 W/m2 radiative forcing from increased CO2.  These radiative forcings will cause an equilibrium surface warming of approximately 0.3°C and 1.3°C, respectively.  So no, the increase in solar activity has not contributed nearly as much to global warming as the CO2 increase.

Blaming Ocean Cycles and Galactic Cosmic Rays

When confronted with the flat TSI trend over the past ~60 years by the Der Spiegel interviewer (who did a nice job challenging Vahrenholt's many myths throughout the interview), Vahrenholt invoked ocean cycles and galactic cosmic rays (GCRs) to explain the observed global warming.

"There are two effects: the declining solar activity, as well as the fluctuations in ocean currents, such as the 60-year Pacific oscillation, which was in a positive warm phase from 1977 to 2000 and, since 2000, has led to cooling as a result of its decline. Their contribution to the change in temperature has also been wrongly attributed to CO2. Most of all, however, the last sunspot cycle was weaker than the one before it. This is why the sun's magnetic field has continued to weaken since 2000. As a result, this magnetic field doesn't shield us against cosmic radiation quite as well, which in turn leads to stronger cloud formation and, therefore, cooling. What else has to happen before the IPCC at least mentions these relationships in its reports?"

Once again Vahrenholt has misrepresented the IPCC report, which does discuss GCRs (i.e. here and here) and the Pacific Decadal Oscillation (i.e. here and here).  The IPCC report correctly notes that the body of scientific research has shown that GCRs have little if any effect on cloud cover and thus global temperature, and even if they did, like TSI, solar magnetic field strength has remained steady over the past ~60 years (as has GCR flux on Earth).  Oceanic oscillations are just that - oscillations switching between positive and negative states, moving heat around between the oceans and atmosphere.  Since both oceans and atmosphere are warming, it must be due to an external forcing, not an internal oscillation.

Vahrenholt Misrepresents Kirkby and CERN

The following exchange between Vahrenholt and the Der Spiegel interviewer is very representative of the interview as a whole.

Vahrenholt: It's more than that. The Cloud Experiment, headed by physicist Jasper Kirkby, has been underway at the CERN particle research center near Geneva since 2006. The initial results of tests conducted in a chamber in which the earth's atmosphere was simulated showed that cosmic particles do indeed lead to the formation of aerosol particles for clouds.

SPIEGEL: But the aerosols demonstrated in the Cloud Experiment are much too small. They would have to grow before they could actually serve as condensation germs for clouds. Whether this happens in nature is still an open question. You present this as a fact.

Vahrenholt: You will find many correlations between cloud cover and cosmic radiation in the book. I'd like to know why the IPCC doesn't thoroughly examine this mechanism. My guess is that the answer to this question would jeopardize the entire foundation of the IPCC predictions.

Vahrenholt misrepresents the scientific evidence, in this case Kirkby and CERN's results, which Kirkby himself states "says nothing about a possible cosmic-ray effect on clouds and climate, but it’s a very important first step."  The interviewer catches Vahrenholt in this misrepresentation, and Vahrenholt responds by claiming some research exists which supports his myth, and that the IPCC is ignoring it.  In reality, the IPCC has discussed the issue in great detail, as demonstrated above.

Vahrenholt is Indeed Duped

In short, we end the way we began, wondering why anybody takes Vahrenholt's comments on the climate seriously.  Not only does he lack expertise in the subject, but he clearly has not done his research, and misrepresents most of the sources he references.  Toward the end of the interview, Vahrenholt provides a comment which Der Spiegel used in the title of the article:

"...I feel duped."

Indeed Vahrenholt has been duped, by his own shoddy research, and has also duped many of his readers in the process.

Note: Vahrenholt and Lüning have published a response to some of the criticism of their work.  However, their response doesn't really contain any new information, and doesn't seriously address any of the criticms leveled in this post (in addition to completely missing the point of The Escalator, as other "skeptics" have).

0 0

Printable Version  |  Link to this page

Comments

1  2  Next

Comments 1 to 50 out of 56:

  1. A couple days ago I had Vahrenholt's interview shoved at me with the implication being that here was further proof that the Global Warming conspiracy was finally being exposed. Reading it I was shocked at his transparent misrepresentations of IPCC and climatology in general. And disappointed that any thinking person would actually take his crazy-making seriously. Thank you for this thorough documentation of Vahrensholt's many misrepresentations. I look forward to sharing it ~ sadly though we can lead a denialist to information but, but . . . well we can always hope.
    0 0
  2. citizenschallenge: thinking people take this sort of crazy-talk seriously because most of them really have no idea what this climate change thing is all about. The few who pay more than cursory attention rarely ever look up & read the actual scientific reports (such as the IPCC's AR4). As is common in so many fields, they rely on media commentators to tell them what they should think about an issue. Sadly, in this case, the vast majority of those commentators are misrepresenting the science (whether deliberately, by omission, or by seeking a false 'balance', the outcome is the same).
    0 0
  3. Delingpole called him Germany's George Monbiot*! And 'a well-known green activist'. I suppose we must allow that, even with the delightful James' claiming it, there is still an outside possiblity that there might be some truth in it? Any of our Deutsche freunde know more of Vahrenholt's pedigree? *given the opinions he's expressed of Monbiot this is rather an odd compliment...
    0 0
  4. The ever-sensible Germans have taken to calling Fritz Vahrenholt 'feuer-fritz'. If I have it right, that's the nickname for a fireman or stoker: one who shovels coal. Whatever he's shoveling, it sure isn't science.
    0 0
  5. »We should note that while we are flattered that Die Zeit has described Skeptical Science as "an internet platform close to the IPCC" in their figure caption, we are in no way affiliated with the IPCC.« the caption is not from Die Zeit, but from the KalteSonne website, probably from Lüning. They label everybody that does not subscribe to their fringe views as "IPCC", trying to discredit it this way.
    0 0
  6. Readers may remember that in another recent section of this website there were extracts from articles in the Wall Street Journal. Having dared to ask the question of how the two sets of scientists views could be reconciled I was pointed to a website that gave a searcheable database of temperature. When I looked for this I could find little or no evidence of warming for the period 2001 to 2011 and it seems to have been generally if grudgingly accepted by posters to the blog that this was the case, at least as far as surface temperatures were concerned. Elsewhere this site has reprduced a graph that it call the escalator which also describes a flat temperature period from 2002 to 2010. Interestingly the final graph of this particular section shows no such pause in the increasing temperature. This section also has a graph of temperatures in North America which, needless to say, has the most recent years as the highest. Yet elsewhere on this site it is conceded that the 1930s had the hottest years there. What explains these inconsistencies?
    0 0
    Moderator Response: [Sph] The text around the final graph clearly explains the answers to your questions about it, and also directs you in two places to the post on Foster and Rahmstorf (2011) where that figure (and others) first appeared.
  7. btw, i have a website for collaborative debunking of the book online: http://de.kaltesonne.wikia.com/wiki/KalteSonneCheck all that is needed now are German-speaking experts that own the book and have free time at hand ;) Vahrenholt indeed was quite an important environmentalist, writing the influential "Seveso ist überall" (Seveso is everywhere) in 1978, which was quite good i hear. my best guess is that he's been dining with the wrong people for too long, buying into the "they want to impose on our lifestyles" meme. i think he's honest, but that does not make him less wrong or dangerous. the interesting thing is that while he's employed at RWE, one of the biggest coal polluters of Europe, he's working at the renewable energy section. nevertheless he pleads against the "demonisation" of coal. lie down with dogs, get up with fleas. p.
    0 0
  8. I like this picture illustrating the solar influence. They got the "Sun big, me small" argument quite litterally... And they even have the nerve to call climate science weak!
    0 0
  9. elsa at 21:15 PM on 14 February, 2012 You have to compare apples to apples. Figure 2 is a graph showing global temps where "statistical methods have been used to 'take out' the effects of volcanic eruptions, Pacific Ocean cycles and the Sun", as the subtitle says. Not a raw global mean temp graph like the escalator. And 1934 was the hottest year on record in the US. The graph in Figure SPM.4 you mention refers to the entire North America.
    0 0
  10. Actually, 1934 is no longer the hottest year in the US anyway - it has been overtaken by 1998 and 2006. The relevant page on Skeptical Science (here) possibly needs updating, but the information is shown via a comment there from NewYorkJ.
    0 0
  11. elsa#6: Whether 'the hottest year' was 1934 or 1998 is irrelevant. What is important and you still seem to be missing is the overall positive trend in temperature and in global heat content. That is what the 'escalator' graphic illustrates.
    0 0
  12. No, elsa, you were given those links as an experiment (sorry, no IRB approval). The first hypothesis was that you would pick a decadal series that showed as much cooling as possible, ignore the series that showed warming, and then come here and make a big deal out of it. It would then be pointed out to you that ten years of simple temp record tell us very little about the climate--unless of course we take into account the likely sources of short-term noise (see Foster and Rahmstorf (2011)). The second hypothesis was that you would ignore this point and continue to harp about a carefully-selected ten-year period of one of the temp records. These two hypotheses have been established. What has not been established, and what you have been careful not to discuss, is what your carefully-selected decade means re climate. If you do not wish to discuss the implications of that decade, or discuss a reading of that decade within the context of both other temp records and solar forcing, aerosols, etc., then one can only conclude that you are fishing for "SkS admits that globe has cooled!" Since there is no physical evidence for such a claim (even taking ocean heating out of the equation), I doubt if you're going to have much luck. So what's it going to be, elsa? Are you willing to defend what appears to be your implicit theory, that global warming has stopped?
    0 0
  13. Good to finally see a journalist being truly skeptical about the "skeptic" claims. What a refreshing change from the unquestioned denier drivel that is allowed into the newspapers and magazines every single day.
    0 0
  14. I wonder if this is what he meant... "This is why the sun's magnetic field has continued to weaken since 2000. As a result, this magnetic field doesn't shield us against cosmic radiation quite as well, which in turn leads to stronger cloud formation and, therefore, cooling." I think he means the Earth's magnetic field, right? (which has decreased in the past few years). How would the Sun's magnetic field protect us?
    0 0
  15. RE - the sun's magnetic field deflects cosmic rays, which hypothetically seed clouds. See the cosmic rays rebuttal.
    0 0
  16. Ok, thanks Dana.
    0 0
  17. Just watched video of Dr. Jasper Kirkby (of recent CERN fame) giving a presentation at Simon Fraser University in 2011, where he set out his position that GCR levels/Solar levels were very closely correlated with temperature records for the past 9,000 years. He notes that correlation does not equal causation, and that his experiments at CERN are designed to test his hypothesis re causation. (i.e. CLOUD) He concludes his presentation with a summary slide, a portion of which states; 1.Solar contributions for 20th Century climate change are poorly understood, 2. Climate models may have the wrong sign for solar irradiance forcing and 3.there is possible unaccounted solar indirect forcing. This seems contrary to most of what I understand from this site, but it is probably due to my limited science background.
    0 0
  18. Many, many thanks Dana for this dissection of Dr Vahrenholt's deceptive drivel, I've been having a very robust debate with a pack of redneck deniers on a LinkedIn "HVAC Professionals" topic ("Is R410a WORSE for the environment than R22?") now approaching 650 comments, quite a record I understand! A couple of them have got excited that Vahrenholt is some kind of conclusive proof that they are right, and the "climaterrorists" and "ecoscammers" have finally been proved wrong, so it's been great to serve this back at them in response. I'm sure it won't change the minds of the chief protagonists, but many looking on will hopefully find it persuasive. Just wanted to express my thanks for all the work that goes into SkS and let you know how useful it is, all power to your efforts.
    0 0
  19. jimb - "Climate models may have the wrong sign for solar irradiance forcing" What??? Do you have a link to the video?
    0 0
  20. I suspect the Jasper Kirkby talk was this one. N.B. If he is right, it makes the "its the sun" argument rather interesting if more solar irradiance makes surface temperatures fall!
    0 0
  21. DSL, the decade I picked was simply the most recent one (and the reason for this was that it was the one under debate in the other blog). My point in mentioning it here is that the temperature record for that decade, which seems flat, does not fit with the one shown here which shows an increase. I have not spent much time looking at the various data but I suspect the temperature record was flat for the period because the group defending the AGW position in the other blog worded their comment very carefully so as not to be specific about what had actually happened in the decade. It would have been easy enough for them to say that "the" temperature increased in the period as well as the obvious thing to say, but they did not do so, probably because they would have been incorrect if they had. So the question remains as to how the graph here shows an increase in the last ten years which, at least as far as the surface temperature is concerned, did not take place. The explanation offered here seems to be that the data on this blog has been "adjusted" that is to say it is not the actual mean global temperature as recorded but a graph of what the global temperature might have been if certain volcanic and other events had not happened. Now that may well be an interesting series to look at and the events may well provide an explanation for the lack of warming at a time when the basic AGW view suggests that the world should have been warming at an accelerating rate. But the fact that it is an adjusted series perhaps should be emphasised and perhaps the unadjusted figures should be there too so that disinterested observers could form a balanced view.
    0 0
  22. elsa wrote: "While they can be criticised for picking flat periods to suit themselves the escalator itself picks a rather suitable start from its own point of view and conveniently leaves out the years from say 1940 to 1970." This is, obviously, nonsense. The point of the escalator graphic is to show that various 'no warming for the past years' claims are statistical chicanery. Extending the graphic back before the start of significant GHG warming (as you suggest) would in no way change that fact. Indeed, additional 'flat' or 'cooling' periods of ~10 years could be added and the trend line of the total period would still be upwards. Ditto if we went back to 1900 and included the early 20th century (mostly) solar warming. Those two 'pre significant GHG warming' periods do not change the statistical facts being demonstrated by the escalator. Put another way... there is not any year in the thermometer temperature records which shows a statistically significant 'flat' or 'cooling' trend up to present. The only way you can get such a claim of 'warming has stopped' is by using a period too short to reach 95% statistical significance.
    0 0
  23. Elsa, climatology is chiefly interested in the response of the climate to changes in the forcings, and is less interested in the unforced response of the climate (i.e. weather) as the former is useful for making projections and the latter is not (as it averages out in the long term - e.g. 30 years or so). The levelling off from the 40s to early 70s is highly likely to be due to an identifiable change in the forcings (in this case suphate aerosols) so it is not comparable with the current decade, where there is no good evidence that there has been a change in forcings that could be responsible. Instead the explanation is likely to be the same unforced climate variability that allows an escalator to be drawn. Now as it happens there isn't even statistically significant evidence that the underlying trend has actually fallen. This suggests it is likely to be merely an artifact of the noise. So, if you want to argue that the most recent decadal trend is meaningful you need to do two things: (i) demonstrate that there has been a statistically significant change in the trend (remember your null hypothesis always should be what you want to disprove) and (ii) that it is the result of a change in the focings and hence likely to persist or (iii) show that there is a physical mechanism by which some long term cycle is not merely correlated, but can also explain the strength of effect. The bottom line is that decadal trends tell you very very little about how the climate is behaving and are essentially meaningless sorry about the shouting
    0 0
  24. CBDunkerson: The "denialists" described here use a selected period (or several) to "prove" that warming has stopped or gone into reverse. The escalator starting at a convenient point in time from its own perspective does likewise to "prove" that there is an irreversible rising trend. Nothing you say above contradicts this view, and I note that you do not question my statement that the trend has been flat over the last decade although the graph with this post shows an increase (this was really my question/criticism in this blog and potentially a good example of the statistical chicanery to which you refer, having been "adjusted" in an unspecified way to produce the desired result and without displaying the unadjusted graph that might cause the outsider to question the validity of the adjusted one.)
    0 0
  25. Listened to Jasper Kirkby's talk (given 9 months ago). Very interesting, that bit about the effects of the sun's UV light. I find it rather frustrating that my limited understanding of climate science does not allow me to comment in a meaningful way, i.e. "He is right because ... or he is wrong because ...". Perhaps the climate experts at skepticalscience can help me out and post a comment or something? Cheers, Martin
    0 0
  26. elsa wrote: "The escalator starting at a convenient point in time" Again, this is nonsense. Pick any starting point in the thermometer temperature record that you like... it changes nothing. 1940? Guess what, the total trend is upwards. 1910? Upward trend there too. 1880? Same thing. The only way you can get a 'non warming' trend up to the present is to pick a starting point so recent that the result is statistically meaningless. Every statistically significant trend up to present shows warming. All of them. What could possibly possess you to keep making such a patently ridiculous claim?
    0 0
  27. Dikran: as I hope I make clear above my main point here was that there is an inconsistency between the graph presented above and many of the temperature measures for the last decade (as you yourself have accepted on the other blog as far as surface temperature is concerned). I would not argue the last decade is particularly significant, although it is difficult to square it with the view that the world faces accelerating warming. Equally I would not see any great significance in the temperature trends of the last century or so. The world is a bit warmer but whether that is a lasting feature is not something you or I can know with any certainty, still less whether it has been caused by humans and CO2. You state that your hypothesis should always be what you want to disprove. I think we would agree therefore that to have a truly scientific hypothesis there should exist circumstances which would be capable of proving the theory wrong. But in the case of the AGW theory this is not the case. The world cooled in the period 1940 to 1970 or so (a 30 year period which you seem to regard as a significant timespan) while CO2 concentrations rose. But this is not taken as repudiating the theory, which is rescued by "a highly likely ...identifiable change in the forcing". Now you could well be right that this is the explanation but once you have added the extra variables you have a theory that will be right whatever happens and thus loses its claim to be properly scientific.
    0 0
  28. Sorry elsa, there is no inconsistency, but instead an aspects of climate and climate modelling that you are unaware of. Please read the paper by Easterling and Wehner (2009) which show that similar periods of little or no warming ocurr now and then in both the observational data and in model output. If you understand the difference between forced and unforced climate you will understand that the observation of a decade or to with little or no warming is completely consistent with prolonged warming (the acceleration will not be very evident on a decadal basis due to the noise involved). The idea that AGW theory is not falsifiable is obviously incorrect. For instance if the climate were to cool for the next fifty years, in the absence of changes in the forcings, that is something that is impossible according to the models and the theory and hence would falsify both. AGW theory hasn't been falsified yet, but that doesn't mean that it cannot be falsified. "Now you could well be right [sulphate aerosols being responsible for 1940-70 trend] that this is the explanation but once you have added the extra variables you have a theory that will be right whatever happens and thus loses its claim to be properly scientific." This is simply nonsense. The way science works is by (i) formulating an theory (ii) perform experiment/observations (iii) compare results with prediction from theory (iv) refine or abandon theory according to comparison (v) repeat steps (ii)-(v) There has been much work done on understanding the physics of atmospheric aerosols, they weren't added to the models as a post-hoc fix without justification. There is a good reason that the 1940-1970 trend is not taken as a repudiation of the theory, which is because it is compatible with the theory. If you want an example of a claim being not properly scientific, then just look at claims that climate change is due to climate cycles. How many of them have made a falsifiable prediction based on a physical (rather then phenomonological) model. I think you will find the answer is approximately zero.
    0 0
  29. re my post @17, I'm with Martin @25in hoping that someone here can add some analysis that I am not capable of doing. I would also note that in the presentation Dr. Kirkby said that there was a paper in the works and that there was further discussion of the implications coming. So far I have found no reference here to that paper-I expect it may be still going through the peer review process.
    0 0
  30. Martin & jimb, I haven't watched the video but the descriptions sound like things which have been covered here many times before. Use the search box at the upper left to find articles on 'Kirkby', 'Cosmic Rays', 'CERN', and/or 'sun upside down' to find discussions of these issues.
    0 0
  31. Martin#25: "he is wrong because ..." If the past is a guide, whatever Dr. Kirkby publishes will be immediately embraced by the 'anything but CO2' crowd. The cosmic ray threads here and here are excellent rebuttals to the entire idea of a cosmic ray-climate connection, but I'm sure we'll need to go through that all over again. If you don't like any of our threads, here's another excellent summary. The single largest hole in the connection is the Laschamp geomagnetic minimum, a time of high cosmic ray flux at the surface with no change in climate. Other reasons he is wrong are in RC's discussion of the difficulties inherent in the cloud nucleation model.
    0 0
  32. CLOUD is also a good rebuttal of the argument that skeptics can't get funding for their research. It is a *big* project by anybody's standard. CLOUD obviously made a good scientific case for their project, however if all projects ended up confirming their experimental hypothesis it would be an indication that there is something very wrong with the funding mechansim. I'd be very surprised if CLOUD provides a genuinely useful basis for climate skepticism, rather than "just" a useful incremental advance in our understanding of cloud nucleation, but it would be a surprise I would definitely welcome!
    0 0
  33. @31 and 32- thanks- the article by Jeffrey Pierce at Real Climate was particularly helpful-a balanced response that was still supportive of the research being done with CLOUD at CERN.
    0 0
  34. muoncounter#31 I think you should have a look at Kirkby's presentation on youtube. Kirkby doesn't claim that cosmic rays lead to increases in cloud cover. He is quite candid that the current research on the correlation between the two is inconclusive. Although, he does believe that it is quite possible that CRs might possibly affect certain types of clouds in certain parts of the atmosphere. He states quite clearly that he hasn't yet shown how cloud condensation nuclei are created. That is next on his list of todos. He does claim that because UV is neglected as an input in climate models, the sign for solar irradiance forcing is wrong. If you would like to think of Kirkby as a sceptic it might be more because of what he thinks is poorly understood - how aerosols influence cloud formation - and that he thinks this might have a large effect (comparable to CO2) on the global temperature. He is careful not to make any unsubstantiated claims. He does point out to quite a bit of research which he believes has the potential of significantly changing our assessment of the effect the sun has on climate. In short Kirkby does not believe that the "science is settled" and he hopes to be able to make a significant contribution in the near future. I haven't found anything concerning the UV light and an inversion of the sign for solar irradiance forcing on this site.
    0 0
  35. CBDunkerson#30 Sorry, I didn't find the post on 'Sun upside down' the first time a looked because I included the quotation marks. Silly me.
    0 0
  36. Dikran. You say the way science works is: (i) formulating an theory (ii) perform experiment/observations (iii) compare results with prediction from theory (iv) refine or abandon theory according to comparison (v) repeat steps (ii)-(v) But we cannot take step (i) in your process. We have no starting point for the relationship between eg CO2 and temperature other than the ones we derive from step (iv)and those are completely mixed up with the other factors that influence temperature. All we can do is use (iv) as a starting point, which really amounts to assuming that the theory is correct and adjusting the other factors to make it work where it doesn't. Using such a technique does not make the AGW theory wrong, but it does render it untestable in any meaningful way.
    0 0
  37. elsa wrote: "But we cannot take step (i) in your process." Well, this explains why 'skeptics' don't have any alternative explanation fitting the observed facts... they are actually incapable of formulating new theories. Who knew? Martin, you're forgiven. :]
    0 0
  38. CBDunkerson: while I can understand a relationship between two variables might be statistically significant I do not see how you could make the statement that the trend in temperature is so. Your view seems to me much more like what Karl Popper called historicism, an apparent ability to forecast certain "inevitable" trends. As he put it for historicists "the way is not only long, but winding, leading up and down, right and left." As a result pretty much every set of circumstances will fit with the theory. A prolonged period without warming, or even some decline, must be just part of the "noise" or the road leading up and down, a deviation from an inevitably warmer destiny.
    0 0
  39. That's silly elsa - you're playing semantic games. AGW is inherently testable since it's straightforward to compare observations/measurements with theory. We can take a vast amount of information on all of the contributions to the earth's energy balance (solar, volcanic, aerosolic, black carbon, greenhouse gas from CO2, methane, nitrous oxides, tropospheric ozone and so on) and define attributions to (say) 20th century and contemporary warming. Either the observations are consistent with the (theoretical) attributions or they aren't. It turns out that observations are entirely consisitent with a dominant contribution from anthropogenic greenhouse forcing. Without this contribution, there should have been no significant warming during the 20th century. Actually, I would modify Dikran's description of how science "works" (perhaps because I'm fundamentally an experimentalist!). I'd say it's: (i) perform experiments/observations (ii) formulate a theory (iii) devise and perform experiments/observations to test the theory (iv) compare results with predictions... (v) refine or abandon theory... (vi) repeat steps (iii-(vi) (i.e. I'm not sure how one conjures theories out of thin air in the absence of observations - 'though that may be due to my deficiencies as an experimentalist!).
    0 0
  40. ah..you posted as I was posting elsa. My post is in response to your #36 (New Cross to Queens Park)
    0 0
  41. CBDunkerson: Perhaps you can explain then how you would take step (i) without using (iv). From where would you derive a relationship between eg CO2 and temperature without actually carrying out (iv)?
    0 0
  42. elsa - "But we cannot take step (i) [formulating an theory] in your process. We have no starting point for the relationship between eg CO2 and temperature other than the ones we derive from step (iv) [refine or abandon theory according to comparison]" That would be, to put it mildly, incorrect. I would refer you to Fourier 1824, Tyndall 1861, and Arrhenius 1896, who derived greenhouse gas heating (and the potential for climate change) straight from spectroscopy and atmospheric composition. The Discovery of Global Warming, which I believe you have been directed to before, is a good resource to learn more about the basic science. Arrhenius is quite accessible, and in particular gave projections: stating that: "...to get a new increase of this order of magnitude (3-4C), it will be necessary to alter the quantity of carbonic acid till it reaches a value nearly midway between 2 and 2.5.... ...temperature of the Arctic regions would rise about 8 degrees or 9 degrees Celsius, if the carbonic acid increased 2.5 to 3 times its present value. In order to get the temperature of the ice age between the 40th and 50th parallels, the carbonic acid in the air should sink to 0.62 to 0.55 of present value (lowering the temperature 4 degrees to 5 degrees Celsius)." This includes estimates of climate sensitivity and polar amplification, both derived and discussed on theoretic grounds back in (as noted) 1896. And understand that this was prior to any discernable anthropogenic climate change (given instrumentation and data available) having occurred... Your statements here are incredibly uninformed and incorrect assertions - I strongly suggest you do some reading.
    0 0
  43. chris and CBD sorry about the timing of posts which is to do with the need to log out if one's view of the blog is to be updated.
    0 0
  44. A followup on my previous post: Arhenius 1896 is fascinating reading, including predictions (pg. 265) of polar amplification, higher warming for land than ocean, higher warming for Northern Hemisphere than Southern (due to land/water ratios), reduction in diurnal (night/day) temperature differences, and secondary feedback from ice/snow retreat and albedo differences. I suspect the only reason he did not discuss cooling of the stratosphere was that nobody had discovered it (the stratosphere) yet. Arrhenius, who as I recall built on Fourier and Tyndall's work, was a very intelligent man.
    0 0
  45. Elsa wrote "But we cannot take step (i) in your process. We have no starting point for the relationship between eg CO2 and temperature other than the ones we derive from step (iv)" I'm sorry, but that is complete nonsense. The basic ideas go back at least as far as Fourier's paper of 1824, which is rather before anything much in the way of observational data were available, and influenced by the experimental work of de Saussure (1740-99). The basic quantative details were worked out in the 1950s by Gilbert Plass. If you think AGW is a new theory then you are very much mistaken. I suggest you fill some gaps in your background knowledge, before you issue criticisms. For the history, I would recommend Spencer Wearts excellent The Discovery of Global Warming, and/or the book "The Warming Papers" by Archer and Pierrehumbert, which colllects together some of the foundational papers (including Fouriers). This will give you an idea of how the theory has developed over the last couple of centuries, and hopefully puts your concerns to rest at least somewhat.
    0 0
  46. Chris, sorry but I don't think I am playing semantic games. The point goes to the very heart of the "scientific" method adopted by too many people, be they AGW supporters or economists. And yes KR I have read a little about Arrhenius. But what you describe is a relationship that is not stage (i) in Dikran's scheme, but rather the predictions from stage (i) not stage (i) itself. These were developed from a theory of the ice ages that is now generally accepted as having been wrong. It also (as with most climate predictions) does not come up with a straightforward relationship between CO2 and temperature but a relationship between the change in CO2 and the change in temperature. Quite why that is I am never sure.
    0 0
  47. @chris, I am also essentially an experimentalist, and your set of steps is also appropriate. There are some that seem to come up with theories first by finding out something about A and then realising that this will have a consequence about B. I suppose it is a bit like the difference between a while loop and a do-while loop in programming; there is a loop there, but there is more than one way of expressing it! ;o)
    0 0
  48. elsa, do you now understand the difference between the Foster and Rahmstorf graph and the elevator graph?
    0 0
  49. elsa@46 As I said, try Fourier. Fourier knew that gasses could absorb what we would no call IR radiation. From this he inferred that these gasses in the atmosphere would cause the world to be warmer than it would otherwise be. That theory was not made on the basis of obervations of the Earths temperature, and IIRC not confirmed until the work of Arrhenius. "It also (as with most climate predictions) does not come up with a straightforward relationship between CO2 and temperature but a relationship between the change in CO2 and the change in temperature." Again your lack of understanding of climate physics is showing. The relationship between CO2 concentrations and radiative forcing is given. However the relationship between forcing and temperature (climate sensitivity) depends on a variety of other other factors, so it would be naive to expect a simple relationship between temperature and CO2 alone. If you are not intending to play semantic games, I suggest you revise your posting style as it is very much the impression you are giving.
    0 0
  50. elsa wrote "It also (as with most climate predictions) does not come up with a straightforward relationship between CO2 and temperature but a relationship between the change in CO2 and the change in temperature. Quite why that is I am never sure." If there are things that you don't understand, then just ask. There are plenty of knowledgable posters here would would be happy to explain. However if you repeatedly critise a theory based on your misunderstanding of the physics, and respond to the rebuttal of the criticism with another criticism it comes across as playing games or trolling.
    0 0

1  2  Next

You need to be logged in to post a comment. Login via the left margin or if you're new, register here.


The Consensus Project Website

THE ESCALATOR

(free to republish)


© Copyright 2024 John Cook
Home | Translations | About Us | Privacy | Contact Us