


 Arguments


4 Hiroshima bombs worth of heat per second
Posted on 1 July 2013 by John Cook, dana1981
UPDATE 27 Mar 2014: I just discovered that my talk at the Climate Action Summit was posted on YouTube:
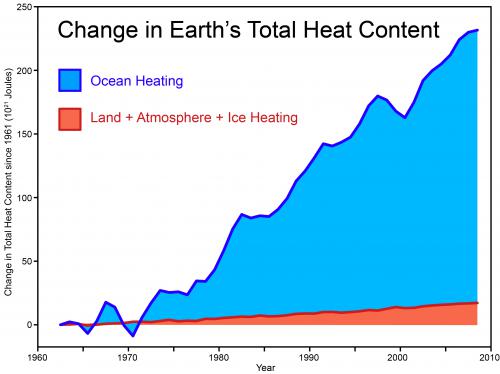
Last weekend, I gave a talk at the Climate Action Summit on the latest climate science. During the talk, I showed the following graph of the Earth's total heat content, demonstrating that even over the last decade when surface temperature warming has slowed somewhat, the planet continues to build up heat at a rate of 4 Hiroshima bomb detonations worth of heat every second. This data comes from a paper lead authored by Australian climate scientist John Church that tallies up the heat accumulating in the oceans, warming the land and atmosphere and melting the ice:
The next day, I was (pleasantly) surprised to see an AAP journalist had written an article about my talk (and also included some of the science on extreme weather presented by the distinguished scientist Lesley Hughes who spoke after me). The headline, "Climate change like atom bomb", focused on the Hiroshima metaphor (which I believe was first used several years ago by James Hansen). The article was picked up by a number of outlets across the world with a curious concentration of coverage in India. Subsequently, a number of people have commented on this metaphor or emailed me questions. So I thought I would address in this post, with some help from Dana Nuccitelli, why we use this metaphor and how the "4 Hiroshima bombs worth of heat per second" was calculated.
Why use the 4 Hiroshimas Per Second metaphor?
A book I recommend to all communicators, particularly those working with a complex, abstract concept like climate, is Made to Stick by Chip & Dan Heath. The book explores what makes a message "sticky" - how do you communicate a message that attracts attention and sticks in the memory. They identify six traits, some of which appear in all sticky ideas:
- Simple
- Unexpected
- Concrete
- Credible
- Emotional
- Story
The difficulty of climate communication is we often have to explain statistical concepts that are complex, abstract, dry and opaque - everything opposite to a sticky idea. So the challenge is communicating what's happening to our climate in simple, concrete, unexpected ways.
This is even more important when debunking misinformation. Not only do we need to show how the myth is wrong, we also have to replace the myth with a credible, more compelling alternative narrative. The Heath brothers summate this process with characteristic stickiness:
"Fight sticky ideas with stickier ideas"
For example, one sticky idea is the myth that global warming stopped in 1998. The typical response to this myth is to point out that it's misleading to cherrypick short periods in a long-term warming trend. A sticky way of communicating this in a visual manner is the Escalator graph. The power of a sticky visual is demonstrated by the fact that the Escalator has been featured in a PBS documentary and by Senator Whitehouse on the senate floor.
Another sticky way of expressing this same idea is to examine the physical reason why there is a long-term warming trend - because the planet is building up heat. This is vividly demonstrated in the following graph which shows surface temperature jumping up and down from year to year while the Earth's total heat content shows a steady, near-monotonic increase.
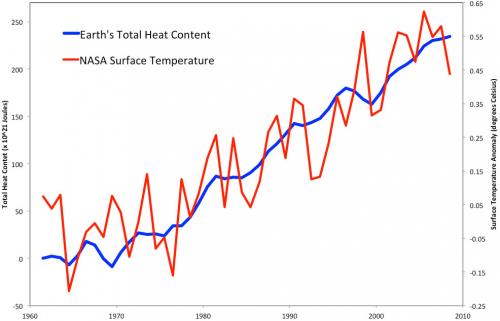
The blue line in this graph is not a statistical long-term trend or a 5-year average - it's actual yearly data of total heat content. The long-term warming trend is grounded in physical reality - the planetary energy imbalance. So I suggest a sticky way to communicate global warming is to express it in units of Hiroshima bombs worth of heat. This ticks all the sticky boxes:
- It's simple - nothing communicates a lot of heat like an A-bomb.
- It's unexpected - whenever I explain this to audiences, their eyes turn into saucers. Almost noone realises just how much heat our climate system is accumulating.
- It's concrete - nobody has trouble conceptualising an A-bomb. Well, much of the younger generation don't know about Hiroshima - when I test-drived this metaphor on my teenage daughter, she asked "what's Hiroshima?". But it's easily recommunicated as an atomic bomb.
- It's credible - the data comes from peer-reviewed research (Church et al. 2011) and has also been confirmed by more recent research (i.e. Balmaseda et al. 2013).
- It tells a story - the idea that second after second, day after day, the greenhouse effect continues to blaze away and our planet continues to build up heat.
- The only downside of this metaphor is it is emotional - the Hiroshima bomb does come with a lot of baggage. However, this metaphor isn't used because it's scary - it's simply about communicating the sheer amount of heat that our climate is accumulating. I've yet to encounter a stickier way of communicating the scale of the planet's energy imbalance.
The fact that out of a conference full of talks, rousing speeches and fascinating workshops, an AAP journalist chose that specific metaphor as the headline in an article picked up by media across the globe testifies to the stickiness of the Hiroshima metaphor. However, I'm happy to throw down the gauntlet - if someone can come up with a stickier metaphor to express our climate's energy imbalance, I would happily switch to it.
How 4 Hiroshimas Per Second was calculated
In 2012, several Skeptical Science contributors teamed up with John Church to publish a paper (Nuccitelli et al. 2012) in response to a flawed publication by Douglass & Knox (2012). In our paper, we analyzed global heat data, created by combining pentadal (5-year average) ocean heat content data to a depth of 2,000 meters from Levitus et al. (2012), and land, atmosphere, and ice heating data from Church et al. (2011).
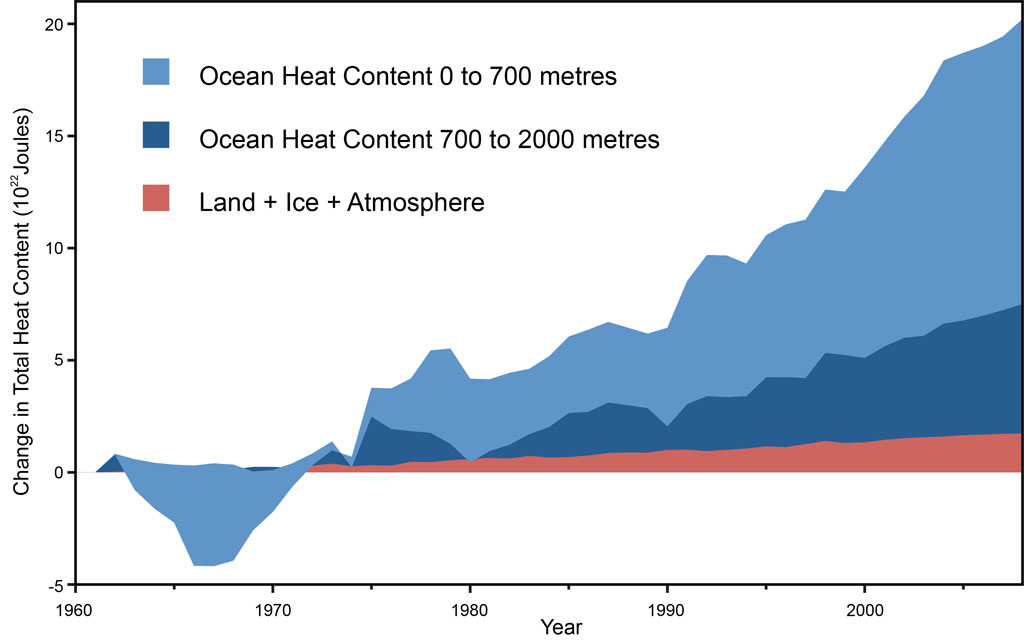
As this figure shows, there has been no significant slowing in global heat accumulation, contrary to the mythical 'global warming pause'. So, how do we come up with 4 Hiroshima atomic bomb detonation equivalents per second from this data?
The slope of the global heat accumulation graph tells us how rapidly the Earth's climate is building up heat. Over the past decade, the rate is 8 x 10²¹ Joules per year, or 2.5 x 10¹⁴ Joules per second. The yield of the Hiroshima atomic bomb was 6.3 x 10¹³ Joules, hence the rate of global heat accumulation is equivalent to about 4 Hiroshima bomb detonations per second. That's nearly 2 billion atomic bomb detonations worth of heat accumulating in the Earth's climate system since 1998, when we're told global warming supposedly 'paused'. That has to be the worst pause ever.
The data used in Nuccitelli et al. (2012) are now available for download so you can check it out for yourself.


The earth being half-lit only applies to solar radiation. The 1.12 W/m2 net radiation value is global average (night and day), and already accounts for the periods of daylight and darkness.
The difference between Philalethes (comment 48) and Eclectic (comment 49) is simple units: 63GJ vs. 63TJ. In the original post, we see the Hiroshima bomb was 6.3 x 10¹³ Joules. That is 63 x 1012 J, 63 x 109 kj, 63 x 106 MJ, 63 x 103 GJ, or 63 TJ.
Philalethes simply mixed up TJ and GJ to end up off by 1000.
Bob Loblaw @51,
Thank you for the correction and clarification.
What is the reason for the difference of 9 bombs per second as calcualed @48 and the 4 bombs per second rate?
OPOF @ 52:
The difference? At a guess, time. The OP is a dozen years old. Currently, the planetary energy imbalance is probably that much higher now.
If someone has current numbers, please post.
One Planet Only Forever @52,
The difference (4 bombs & 9 bombs) is indeed due to a different EEI numbers which are increasing with time. The OP uses 8Zj/y. The 1.12Wm^-2 quoted by philalethes @48 is 18Zj/y. But even that could be now out-of-date.
The actual EEI wobbles a lot and through 2019 12-month average CERES number is 1.30Wm^-2.
The quoted 'EEI (from 2019) = 1.12 W/m²' value presumably comes from Loeb et al (2021) 'Satellite and Ocean Data Reveal Marked Increase in Earth’s Heating Rate' which puts it as "1.12 ± 0.48 W m−2 in mid-2019," this based on a linear (OLS) fit through CERES data, a linear rise 2000-19 backed by the OHC data for the same period. The CERES linear fit gave a +0.05Wm^−2/year increase in EEI, the OHC +0.04Wm^−2/year, both with big error bars (making the results barely statistically significant at 2sd).
While we now have had a few more years of looking at EEI, the 2000-to-date OLS thro' the CERES data is still yielding the same basic result suggesting today a value of 1.37Wm^-2/y. But the point of such an analysis (which as a strict linear value would point to AGW starting only in 1995) is to work towards an attribution of the increasing EEI.
(The EEI numbers presented by the ClimateChangeTracker EEI page stretches back to 1985 when estimates of EEI were cooling due to volcanic eruptions (El Chichón 1982 & Pinatuba 1991). Within the wobbles, the latest 12-month average (to June 2024) is +0.95Wm^-2.)
Reconciling CERES numbers with longer in-situ OHC data isn't entirely achieved with such OHC data significantly lower, although OHC calculated from sea level (geodetic) data gives a good match to CERES. The graphic below is from Cheng et al (2024). Note numbers in the insert in graph suggests 2020-23 OHC rising at 17.7Zj/y.
MA Roger @54,
Thank you for the detailed explanation. I now appreciate that the ‘reason’ or attribution for the EEI rate appearing to have increased from 4 bombs to 9 bombs (or higher) is still not fully understood.
The annual CO2 level increase now appears to be about 40% higher than the average from 1980 to 2010 (see below). That does not appear to reasonably explain the more than doubling of the EEI in a way that is reasonably consistent with the expectation that no significant warming will occur after human impacts on GHG levels are effectively ‘net-zero’.
Could it be that the magnitude of annual GHG increase is significantly exceeding the rate of annual EEI to achieve the new balanced state? That would mean that there is a growing amount of ‘yet to be realized’ global warming. However, if the wind-down of GHG impacts is able to be slow enough, the reduction happens sooner and a more significant reduction happens earlier, then that excess warming could be realized by the time that human impacts become effectively net-zero. That would be seen by the EEI not declining at the time that the rate of CO2 increase begins to significantly decline.
Based on NOAA (see here) the approximate 10 year average annual increases of CO2 levels were as follows:
0.8 ppm - in the 60s (1960 to 1970)
1.3 ppm - 70s
1.6 ppm - 80s
1.5 ppm - 90s
1.9 ppm – 2000s
2.4 ppm - 2010s
Average annual increase from 1980 to 2010 = 1.7 ppm
Average of 2010 to 2020 = 2.4 (with 2018 at 2.4 and 2019 at 2.5), an increase of about 40% compared to the period used to calculate the 4 bomb per second rate.
I forgot a link in my message @55,
Based on NOAA (see here) ...
One Planet Only Forever @55,
The CO2 level in the atmosphere has been accelerating through the decades and indeed the resulting climate forcing has also been accelerating. The total GHG forcing is less 'acceleraty' due to the cuts in CFC emissions back in the 1990s. The table below shows the average annual increase in CO2 forcing and total GHG forcing (WM^-2) from the NOAA AGGI.
1980s ... ... 0.026 ... ... 0.047
1990s ... ... 0.023 ... ... 0.033
2000s ... ... 0.028 ... ... 0.033
2010s ... ... 0.034 ... ... 0.040
2020s ... ... 0.032 ... ... 0.040
The big omission is the negative forcings from aerosols and a lot of ink has been spilt addressing that particular omission. (For instance, the marine regs of 2020 have often been mentioned as a possible cause of the "bananas" temperatures seen from the back half of 2023.) While it is a big omission, I'm not of the view that it will not prove an essential ingredient in understanding the EEI and 'bomb increase' measured both by CERES and in OHC.
There are plenty of rabbit-holes to jump down when tring to explain the CERES data. (I note recently a couple of the 'usual suspects' Nikolov & Zeller
trying to argue that it is the 'bomb increase' that has been forcing the whole of AGW.)
The 'bomb increase' is a net result from (1) a warming world which is thus leaking more IR into space and thus lowering EEI and (2), a less reflective world due to a reducing albedo increasing EEI. These both present reasonably good correlations with global temperature (1) -1.53Wm^-2/ºC and (2) +2.81Wm^-2/ºC with thus a net increase in EEI running +1.2Wm^-2/ºC.
What makes me sceptical about any very significant role of aerosol-reduction in the albedo numbers is both that there is the significant correlation with temperature wobbles (which suggests the reduced albedo results from climate feedbacks) and that the peiod where that albedo-temperature correlation looks less than convincing (2007-14 which are those dreaded hiatus years) doesn't coincide with any explained event (like the marine emissions regs) where we would expect something to be seen. [I posted a pink graphic of these correlations 5th December 2023, which you can scroll down-to here]
There remains the thorny question of whhat lies behind these correlations.
Back-of-envelope calculations appear to suggest something must be at work beyond simple AGW. The AGGI numbers above suggest the 2000-20 additional forcing totals +0.73WM^-2 which is roughly equal to the EEI increase through the period. But with SAT also rising +0.6ºC through the period, increases in AGGI and in EEI should not at all be equal.
If they are actual correlations with global temperature, what was happening pre-2000?
Do they otherwise include some wobble or some aerosol-effect?
Another rabbit hole is that while the rate of change in temperature (acceleration) over short periods fits with the wobbles in EEI, the increasing EEI does not fit at all well with the longer term temperature accelerations.
So there is a lot of rabbit holes and to-date no sensible-sounding explanation.
MA Roger @57,
Thanks for the additional information and thoughts.
There is lots of evidence. All that is missing is a robust explanation that is consistent with all of it.
However, in spite of that detailed explanation not yet being developed, there is little doubt that things will continue to be made worse by continued harmful unsustainable human activities and their impacts (sort of like the harm of smoking not being in doubt even though the exact mechanism of the harm done was not certain).
One Planet Only Forever @58,
I'm of the view that "a robust explanation that is consistent with all of it" is probably asking too much given the "all of it" contains a lot of very intriguing stuff. It thus continues to attract at least my attention. Why, for instance, does the CERES data show the planet reflects short wave in wobbles that are coincidental with wobbles in global temperature (as are the measured of cloud amount wobbles) but the wobbles in long wave IR emissions are apparently five months late? And the big issue - why is the longer-term rate of change of global temperature not responding to the longer-term rise in EEI? That is, why does the CERES EEI data show EEI trebling when the long-term rate of global warming increased just 50%.
I did think to plot out a graph showing the CERES EEI data measured in Hiroshima/Second and the graphic I adapted has a plot of the accelerations-decelerations of GisTemp L-OTI 1950-to date. This is posted here 20th October 2024.
I also note the link to the recent rambling but amusing Nikolov & Zeller paper @57 is misdirecting. The paper is HERE.
MA Roger @59,
Thanks for the additional thoughts and information.
I agree that there could be a lot of aspects to the explanation of 'all of it'. I probably should have said something like 'All that is missing is a robust set of explanations that collectively address all of it without being contradictory'.
I will continue to follow the development of the understanding aware that changes of current understanding may be required. But, contrary to the desired beliefs of the likes of Nikolov & Zeller, those changes of understanding are very unlikely to reduce the need for humans to rapidly end their collective harmful impacts on many of this amazing planet's environmental systems, not just the climate system.