Climate Science Glossary

Term Lookup

Enter a term in the search box to find its definition.

Settings

Use the controls in the far right panel to increase or decrease the number of terms automatically displayed (or to completely turn that feature off).

Term Lookup

Settings


All IPCC definitions taken from Climate Change 2007: The Physical Science Basis. Working Group I Contribution to the Fourth Assessment Report of the Intergovernmental Panel on Climate Change, Annex I, Glossary, pp. 941-954. Cambridge University Press.

Home Arguments Software Resources Comments The Consensus Project Translations About Support

Bluesky Facebook LinkedIn Mastodon MeWe

Twitter YouTube RSS Posts RSS Comments Email Subscribe


Climate's changed before
It's the sun
It's not bad
There is no consensus
It's cooling
Models are unreliable
Temp record is unreliable
Animals and plants can adapt
It hasn't warmed since 1998
Antarctica is gaining ice
View All Arguments...


Username
Password
New? Register here
Forgot your password?

Latest Posts

Archives

Frauenfeld, Knappenberger, and Michaels 2011: Obsolescence by Design?

Posted on 2 May 2011 by Daniel Bailey

We know the planet is warming from surface temperature stations and satellites measuring the temperature of the Earth's surface and lower atmosphere. We also have various tools which have measured the warming of the Earth's oceans. Satellites have measured an energy imbalance at the top of the Earth's atmosphere. Glaciers, sea ice, and ice sheets are all receding. Sea levels are rising. Spring is arriving sooner each year. There's simply no doubt - the planet is warming.

And yes, the warming is continuing. The 2000s were hotter than the 1990s, which were hotter than the 1980s, which were hotter than the 1970s. In fact, the 12-month running average global temperature broke the record 3 times in 2010; according to NASA GISS data (2010 is tied with 2005 for the hottest year on record for GISS and tied with 1998 using HadCRUT).  Sea levels are still rising, ice is still receding, spring is still coming earlier, there's still a planetary energy imbalance, etc. etc. Contrary to what some would like us to believe, the planet has not magically stopped warming.

Humans are causing this warming

There is overwhelming evidence that humans are the dominant cause of this warming, mainly due to our greenhouse gas emissions. Based on fundamental physics and math, we can quantify the amount of warming human activity is causing, and verify that we're responsible for essentially all of the global warming over the past 3 decades.  In fact we expect human greenhouse gas emissions to cause more warming than we've thus far seen, due to the thermal inertia of the oceans (the time it takes to heat them).  Human aerosol emissions are also offsetting a significant amount of the warming by causing global dimming.

The Original Frozen Tundra

In October of 2010, The National Oceanic and Atmospheric Administration (NOAA) released the Arctic Report Card. The report contains a wealth of information about the state of climate in the Arctic Circle (mostly disturbing).  Especially noteworthy is the news that in 2010, Greenland temperatures were the hottest on record. It also experienced record setting ice loss by melting. This ice loss is reflected in the latest data from the GRACE satellites which measure the change in gravity around the Greenland ice sheet (H/T to Tenney Naumer from Climate Change: The Next Generation and Dr John Wahr for granting permission to repost the latest data). 


Figure 1: Greenland ice mass anomaly - deviation from the average ice mass over the 2002 to 2010 period. Note: this doesn't mean the ice sheet was gaining ice before 2006 but that ice mass was above the 2002 to 2010 average.

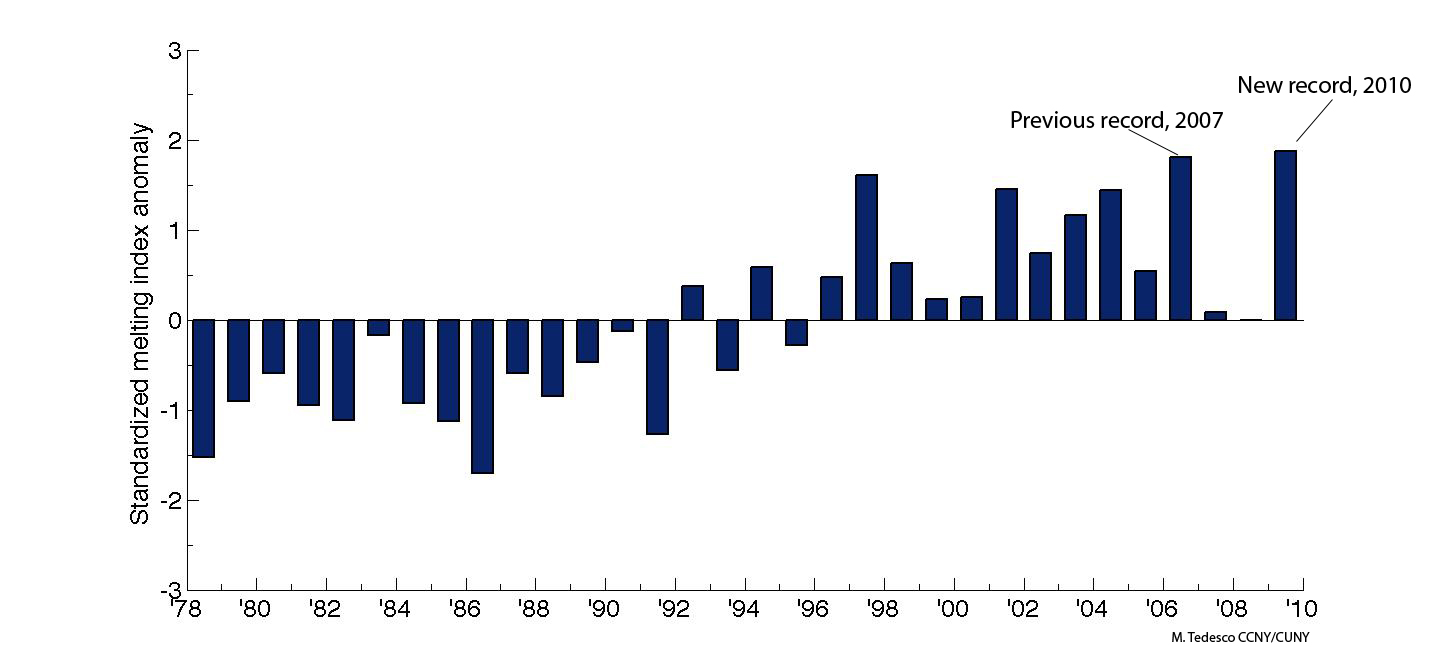
Additionally, Tedesco and Fettweiss (2011) show that the mass-loss experienced in southern Greenland in 2010 was the greatest in the past 20 years (Figure 2 below).

Tedesco

Figure 2: Greenland melting index anomaly (Tedesco and Fettweiss (2011))

The figure above shows the standardized melting index anomaly for the period 1979 – 2010. In simple words, each bar tells us by how many standard deviations melting in a particular year was above the average. For example, a value of ~ 2 for 2010 means that melting was above the average by two times the ‘variability’ of the melting signal along the period of observation. Previous record was set in 2007 and a new one was set in 2010. Negative values mean that melting was below the average. Note that highest anomaly values (high melting) occurred over the last 12 years, with the 8 highest values within the period 1998 – 2010. The increasing melting trend over Greenland can be observed from the figure. Over the past 30 years, the area subject to melting in Greenland has been increasing at a rate of ~ 17,000 Km2/year.

This is equivalent to adding a melt-region the size of Washington State every ten years. Or, in alternative, this means that an area of the size of France melted in 2010 which was not melting in 1979.

Selective Science = Pseudo-Science

Into this established landscape comes a new paper which presents a selective Greenland melt reconstruction. During the review process the papers’ authors were urged to, yet chose not to, include record-setting warm year 2010 temperatures. Had the authors considered all available data, their conclusion that ‘Greenland climate has not changed significantly’ would have been simply insupportable.

They write:  

“We find that the recent period of high-melt extent is similar in magnitude but, thus far, shorter in duration, than a period of high melt lasting from the early 1920s through the early 1960s. The greatest melt extent over the last 2 1/4 centuries occurred in 2007; however, this value is not statistically significantly different from the reconstructed melt extent during 20 other melt seasons, primarily during 1923–1961.”

Designed Obsolescence?

Their selective ‘findings’ were obsolete at the time the paper was submitted for publication in December of 2010. In the review process, the authors and journal editors were made aware that important new data were available that would change the conclusions of the study. Unfortunately, the paper represents not only a failure of the review process, but an intentional exclusion of data that would, if included, undermine the paper’s thesis.

Dr. Jason Box has chosen to share for the record a timeline of important events associated with this article’s publication:

  • 26 August, 2010, I was invited by Dr. Guosheng Liu – Associate Editor – Journal of Geophysical Research (JGR) – Atmospheres to review the article. Sara Pryor was the JGR chief editor ultimately responsible for this paper’s review.
  • 27 August, 2010, I accepted the review assignment.
  • 22 September, 2010, I submitted my review, in which I wrote: “The paper may already be obsolete without considering the extreme melting in 2010. I would therefore not recommend accepting the paper without a revision that included 2010.” I post my review posted verbatim here. At this time, I indicated to the editors that I did not wish to re-review the paper if the authors chose not to include 2010 temperatures. It was clear by this date, from the readily-available instrumental temperature records from the Danish Meteorological Institute and other sources such as US National Climate Data Center and NASA GISS that the previous melt season months were exceptionally warm.
  • 16 October, 2010, a NOAA press release publicized record setting Greenland temperatures. The press release was linked to this Greenland climate of 2010 article, live beginning 21, October 2010.
  • 27 December, 2010, I was invited to re-review the paper. I again stated that I did not wish to re-review the paper if the authors chose not to include 2010 temperatures. By this date, it was more clear that 2010 temperatures were exceptionally warm.

Another very important point: the excuse that the data was not available just is not reasonable given that both the Tedesco and Fettweiss 2011 and Mernild et al 2011 papers each managed to reference this 2010 data in publications that came out prior to that of Frauenfeld, Knappenberger, and Michaels.

Dr. Box:  

"The Editor’s decision whether or not to accept the paper would have been made sometime in early 2011. This paper should not have been accepted for publication without taking into account important new data."

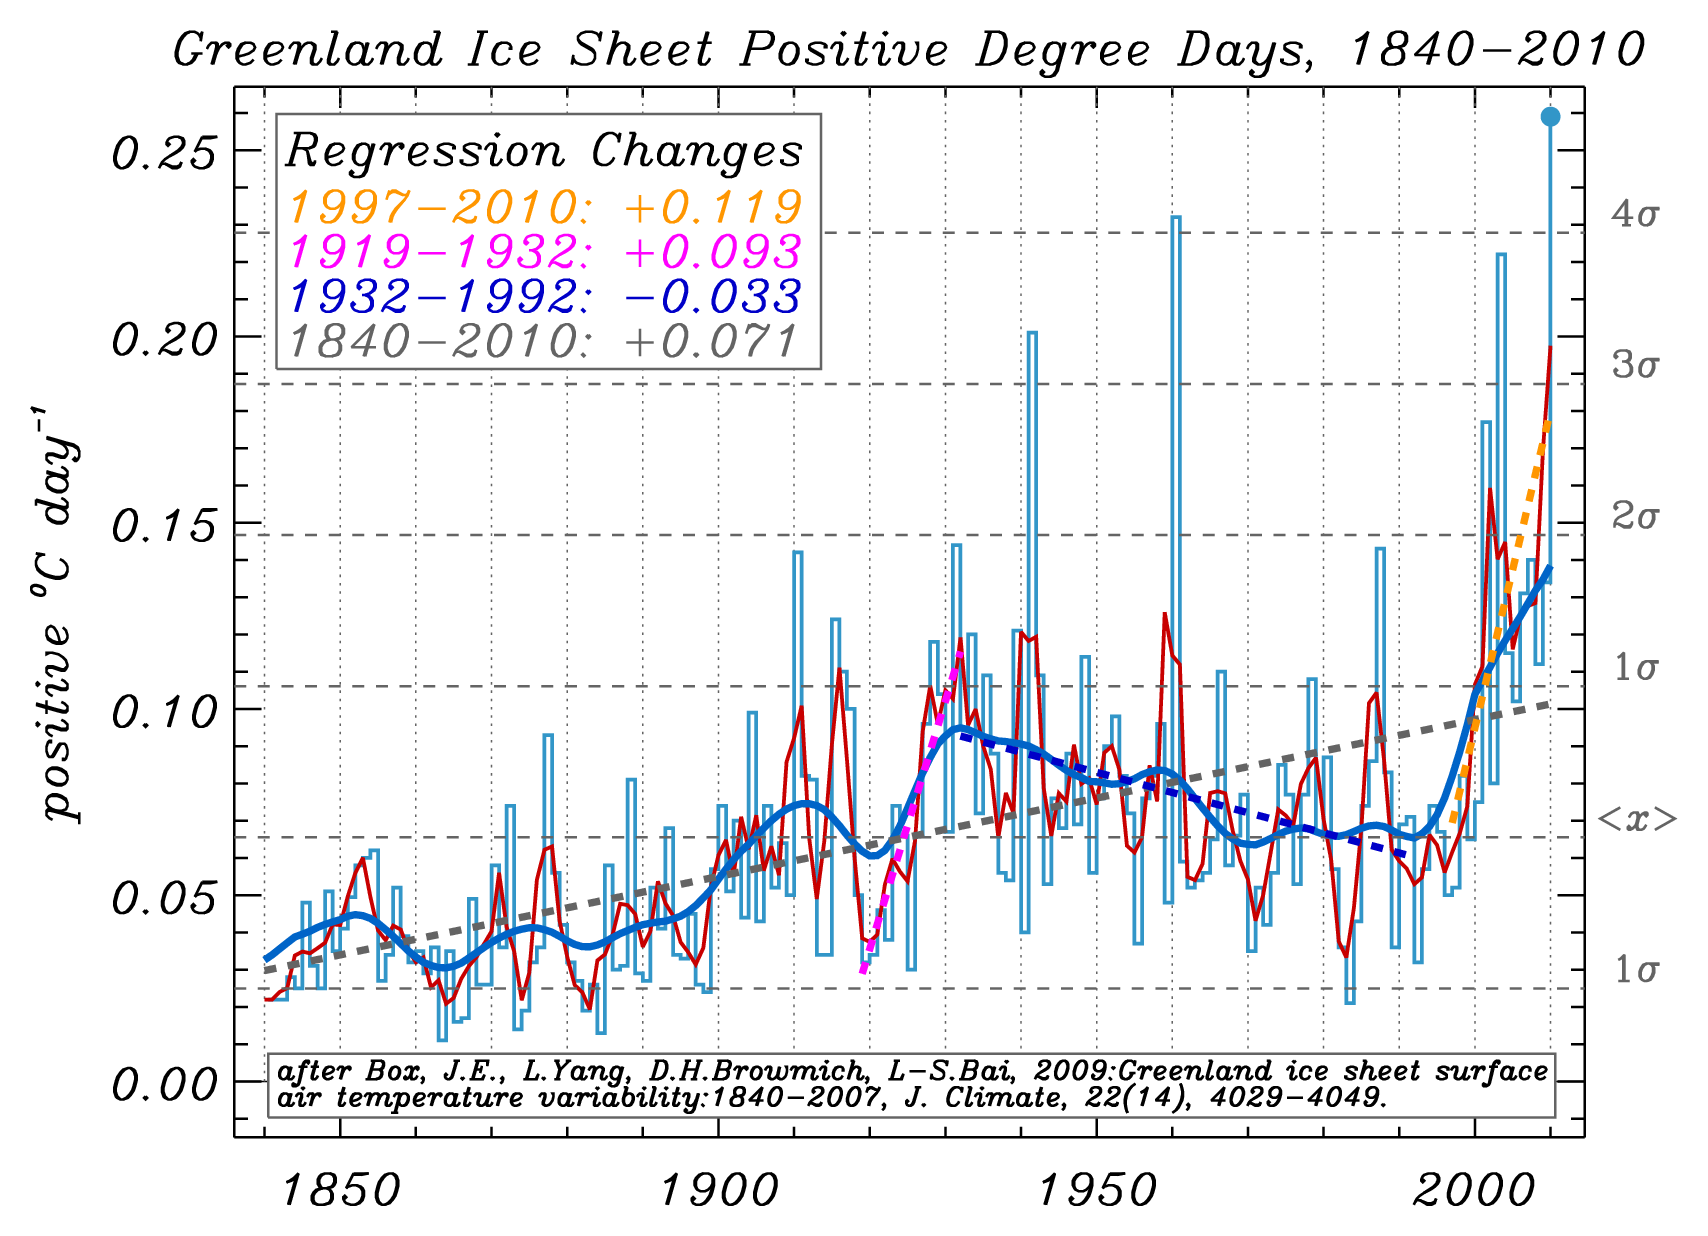
Figure 3:  Positive Degree Day reconstruction for the Greenland ice sheet after Box et al. (2009). The "regression changes" presented here are equal to the linear fit (dashed lines in the graphic) value at the end of the period minus the beginning of the period, for example, the 14-year change is the 2010 value minus the 1997 value. The blue Gaussian smoothing line is for a 29 year interval. The dark red smoothing line is for a 3 year interval.  PDDs are the sum of positive temperatures. A PDD sum of 10 has twice the melt potential as a PDD sum of 5. Note that not only is the recent melting convincingly distinguishable from that of the 20th Century, but that summer and annual average temperatures in recent years are increasingly above values in the 1920s-1930s. (Courtesy Dr. Jason Box)

Greenland’s past temperatures

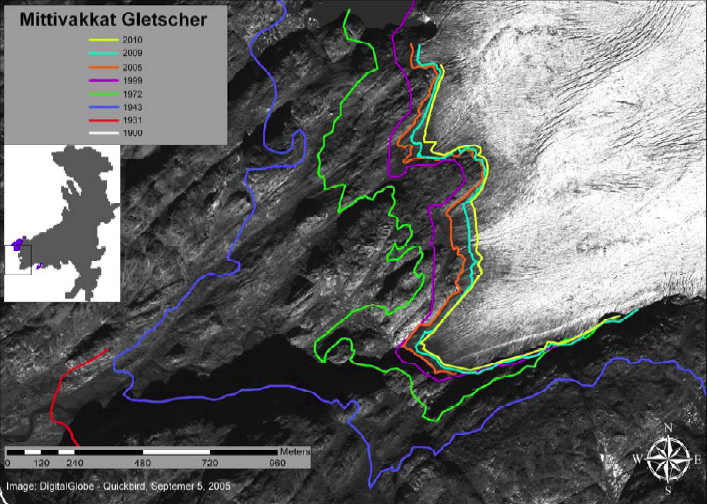
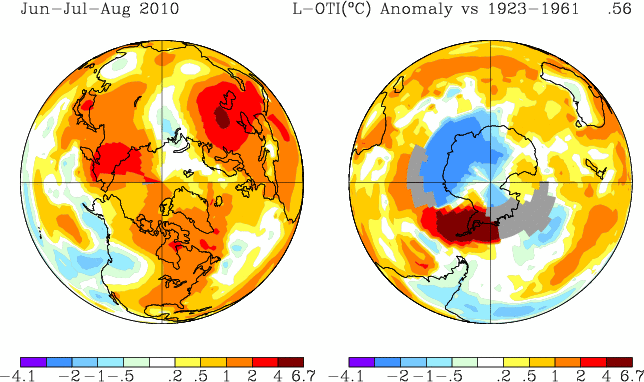
Including year 2010 data reveals (as seen in Figure 5 at bottom), in contrast to the message of the Frauenfeld, Knappenberger, and Michaels paper, that recent Greenland temperatures are warmer than at any time during the 20th Century for the summer, autumn, and annual periods. The 1925-1935 spring season was warmer in 1930 than 2010, but not warm enough to make the corresponding annual average exceed that of the recent times.  Important for a melt reconstruction, what Frauenfeld, Knappenberger, and Michaels neglected to include, was that recent summer temperatures exceed those of any time during the past century.  As a result glaciers in southern Greenland have retreated far behind their meltlines from the early 20th Century.  Evidence of this can be seen in Mittivakkat Glacier (Figure 4 below):
Mittivakkat Glacier

Figure 4: Mittivakkat Glacier in Southern Greenland.  Note the red line indicating the 1931 extent of the glacier relative to the yellow line depicting its position in 2010 (Mernild et al, 2011)

One thing to remember is that the regional warming that Greenland experienced in the early 20th Century came at a time when the world overall was colder than it is today.  And that the warming then was a result of multiple forcings (in which GHG warming played a role) and is thus fundamentally different than the anthropogenic global warming of the most recent 30 years (in which GHG warming plays by far the predominant role).  Additionally, the global cryosphere (the parts of the world covered in ice) has experienced much greater warming (in terms of volume and global extent) in this the most recent period than in the time of supposedly similar warming (the early 20th Century).

Given the thermal lags of oceans and ice, it is clear that Greenland has yet to fully respond to the warming forced upon it, so a reasonable approximation of another 1-2° C is yet in its pipeline.  This will translate into yet greater mass losses to come, which evidence indicates may be experienced in non-linear fashion.
2010Anomalyvs1923-1961

Figure 5: Where 2010 ranks relative to the warm period observed from 1923-1961 by Frauenfeld, Knappenberger and Michaels (Source)

Two lingering questions remain:

  1. Why did Frauenfeld, Knappenberger, and Michaels not include year 2010 data when they were asked to and when the data were readily available, yet the other papers containing the 2010 data published before theirs did?
  2. Why did the journal publish this paper without the requested revisions?

Climate Warming is Real

Dr. Box:  

"Multiple lines of evidence indicate climate warming for which there is no credible dispute. No scientific body of national or international standing has maintained a dissenting opinion. I personally have found no credible science that disproves that human activity significantly influences climate.

An enormous and overwhelming body of science leads rational thinkers to the conclusion that humans influence climate in important ways. For decades, the science has indicated that human activity has become the single most influential climate forcing agent."

National and international science academies and scientific societies have assessed the current scientific opinion, in particular on recent global warming. These assessments have largely followed or endorsed the Intergovernmental Panel on Climate Change (IPCC) position of January 2001 which states:

An increasing body of observations gives a collective picture of a warming world and other changes in the climate system… There is new and stronger evidence that most of the warming observed over the last 50 years is attributable to human activities.

Acknowledgements

  • Dr. Jason Box, Assoc. Prof., Department of Geography, Byrd Polar Research Center, The Ohio State University, Columbus, Ohio, USA for his invaluable assistance, advice, knowledge and patience
  • Dr. Mauri Pelto, Professor of Environmental Science, Science Program Chair; Director, North Cascade Glacier Climate Project, Nichols College, Dudley, MA, USA for his timely insights and suggestions

Without the expertise of these two fine climate scientists this article could not have come to pass.

0 0

Printable Version  |  Link to this page

Comments

Prev  1  2  3  4  5  Next

Comments 101 to 150 out of 203:

  1. Professor Knappenberger, For the record I don't mean to be rude... and I'm a laymen so don't pretend to speak to scientific particulars. Instead, I'm looking at all of this from the bottom up* and seeing and hearing the silliness being fed to people which totally misrepresent our knowledge. And then I read that dripping contempt that's displayed throughout Pat Michael's essay and it is genuinely heart breaking and aggravating. {*four decades worth} ~ ~ ~ ~ ~ ~ ~ That above soundbite being: relax there is nothing to be concerned about and nothing should be done to change the business a usual plan. Instead we the people are forced to continue being distracted by this debate game, or as Pat Michael so elegantly put it over at his CATO blog "Current Wisdom": Please Sell Me Your Beach House: ~ ~ ~ ~ ~ ~ ~ "In a world of unbiased models and data, they should roughly be in balance." ~ ~ ~ ~ ~ ~ ~ Shouldn't the models and data be biased to the actually dynamics they are recording rather than a "balanced" media PR presentation?
    0 0
  2. Professor Knappenberger, I apology if that came across a bit strong ~ insulting wasn't my intention. I had just finished reading Pat Michaels’ take: "Sell Me Your Beach House, Please!" and was feeling a bit feisty. Also, I did not mean to imply I thought your study had no value. But it seems a small piece. Perhaps destined to become a historic benchmark as the trends blast free of the background noise. ... it just seems wrong to present a study such as KFM as though it were in a vacuum, as Michaels and others are clearly doing.
    0 0
  3. citizenschallenge, While I appreciate the courtesy, I am not a professor, so there is no need to address me as such, "Chip" works just fine! It should be clear from Pat's recent Cato piece that he is not particularly concerned that a sustained rapid acceleration in the rate of sea level rise is imminent. In that piece, and in several others in his 'Current Wisdom' series (some of which we link to here), he explains why, citing recent papers from the scientific literature. You are quite free to reach a different conclusion! -Chip
    0 0
  4. Chip Knappenberger - Thanks for coming by!
    0 0
  5. Chip "It should be clear from Pat's recent Cato piece that he is not particularly concerned that a sustained rapid acceleration in the rate of sea level rise is imminent." The ambiguity in that statement might allow a propagandist to write with some truth that Michaels, aware that a sustained rapid acceleration in the rate of sea level rise is imminent, is not concerned. Since I am not a propagandist, I will merely observe that in my opinion he should be concerned! Perhaps you did not see my comment #70? Can you respond please?
    0 0
  6. logicman, Despite your handle, I am have trouble following you :^) Pat authored his own article at Cato, do you think I am serving as propagandist to spin it other than in a way he meant it? Perhaps I am not understanding your question. And, back to your comment #70, question 1. Comments have never been activated at World Climate Report, the latest piece is no exception. However, we’d be happy to entertain funding offers to hire someone to oversee that feature! And as to your second question, I am not sure I fully understand it. Wasn’t that topic covered in subsequent discussions in comments with Dikran, skywatcher, et al.? Sorry to be so dense. -Chip
    0 0
  7. Dikran Marsupial at 23:07 PM on 3 May, 2011 apols again Dikran - I seem to have failed in conveying I was being tongue in cheek! You said my response was a little pedantic in an early post and I was using the theme of pedantry in my conversation with you. Absolutely no offence intended. These issues can become over-serious, and it helps (me anyway) occasionally to relax by being a little light-hearted in these discussions however serious some of the dimensions are. In my opinion the sentence: ”The greatest melt extent over the last 2 1/4 centuries occurred in 2007; however, this value is not statistically significantly different from the reconstructed melt extent during 20 other melt seasons, primarily during 1923–1961.” shouldn't have been included in the abstract, since first it's factually erroneous, and second because it gives a spurious impression of a precision. The meaning of statistical significance in this case needs to be qualified, since it refers not to the question of whether Greenland melts now are different from melt rates then, but to whether Greenland melt rates now are different from a reconstructed model of melt rates then. So it’s got little meaning without consideration of the accuracy of the model of historical rates and the variance in the data in the reconstruction. These aren't well specified with respect to reality even if they are specified within the model. If this was a study in a medical journal (say) in which there are clear conventions in the description of statistical significance, then a single sentence statement in an abstract is appropriate. Maybe I haven't read enough papers but I've never seen a paleoreconstruction assess statistical signficance between contemporary empirical data and paleproxy data. I would insist that this sentence be either removed or made to better represent the findings; e.g.: “”The greatest melt extent over the last 2 1/4 centuries within our study period occurred in 2007, although the very recent 2010 melt exceeds that of 2007; these value are not statistically significantly different from the reconstructed melt extent during 20 other melt seasons, primarily during 1923–1961. However we emphasize that this analysis relates to a comparison of contemporary melt with a historical reconstruction having considerable uncertainty” But if there are good reasons not to assess statistical significance in differences between contemporary empirical data and historical reconstructions, then I don't see that FKM should be the groundbreakers here. But that's for an appropriate expert to assess...
    0 0
  8. Chris@107, If I may join your conversation… I am not following your assertion that we are somehow unique in comparing an observed data value with reconstructed data values, and assessing whether or not they differ from one another by examining the error range that we determined about the reconstructed values. As a prominent example, I direct you to page 2 and 3 of the IPCC Third Assessment Report, particularly Figure 1b (I hope I am not falling for some sort of bait here). It shows a 1,000 year reconstruction of northern hemisphere temperatures along with the observed temperatures since 1861 and includes, among other statements, “The 95% confidence range in the annual data is represented by the grey region. These uncertainties increase in more distant times and are always much larger than in the instrumental record due to the use of relatively sparse proxy data. Nevertheless the rate and duration of the warming of the 20th century has been much greater than in any of the previous nine centuries. Similarly, it is likely that the 1990s have been the warmest decade and 1998 the warmest year of the millennium.” This figure, procedure and conclusion are similar in nature to ours. And as to our offending sentence in the abstract, I don’t think any portion of it has been firmly established to be factually in error. -Chip
    0 0
  9. Chip Knappenberger at 05:39 AM, fear not being seen as dense. Far from it, your contributions have provided an unusual degree of clarity and logic.
    0 0
  10. So far as I can see though Chip, your calculation of error is a purely statistical construct from the modelled timeseries values (the RMSE of the series), rather than a physically-based estimation of the uncertainty, which might be generated in this case, say by comparing observed melt values with modelled melt values where the series overlap? I'm not saying it's necessarily an incorrect way of estimating uncertainty, but it is not similar to the IPCC example you refer to - as seen by the fact that your uncertainties appear constant, while in the example, they change (increase with age in that case). Please correct me if I am wrong! Your conclusion fundamentally depends on the uncertainties being large enough to encompass the recent values in 2007 (and of course should have included 2010). Your factual error, surely, is of course that 2010 is the greatest melt season, not 2007, which also means that the two largest melts occurred in the past four years. Any further thoughts on my comments regarding melt values in comparison to mass loss (calving, recently accelerated flow rates)? I feel your paper inadequately deals with that and this largely leads to the erroneous statements on sea level. And why would sea level rise have had to have jumped to 3mm p.a. in the 1960s to confirm an accelerated contribution from Greenland alone? You never talk of all the relative contributions to sea level (thermal expansion etc) so this statement is made without context and is seriously in error.
    0 0
  11. Chip Knappenberger, I am having difficulty coming to grips with your paper, in large part because I am unable to access the original (given my limited means). I would appreciate it if you would answer some questions for me. With regard to the Ice Melt Extent Index in your paper, does the zero value represent total ice melt equaling total snow accumulation such that for negative values, the GIS gains mass if we ignore glacial calving, and positive values a mass loss? If not, what value does represent an equality of mass gain and loss (ignoring calving)? Further, although your paper does not deal with glacial calving, do you think it is reasonable to treat the Ice Melt Index as a proxy for total mass loss from the GIS as Michaels is doing, and as you appear to to do here. Finally, your Ice Melt Index shows similar values in the periods 1840-1920 and 1960-1990 even though Greenland temperatures where apparently half a degree colder in the former period. Is there any particular reason for this?
    0 0
  12. skywatcher@110, Thanks for the good questions. Let me try to answer them. You are correct that our uncertainty bounds represent statistical uncertainty in our model (which has some contribution from measurement error in that the model was built from likely non-perfect observations). So, the better the model performs, the tighter the error bounds. Or another way, if you prefer, the worse our model is, the wider the error bars and voila, nothing is statistically different than anything else (I would imagine that this is a property shared by most statistical models). All I can say, is that we tried to produce the best model that we could and reported the statistics associated with it. I believe this is the same thing as was done in the study I referred to that the IPCC highlighted. We did not report the error bars associated with our observed melt index, nor did we consider them in our determination of whether 2007 was or was not statistically different from any of our reconstructed values (including error bars). If we had considered errors in our observed melt index, I imagine that the number of reconstructed values which were not found to be statistically different from 2007 would have increased. And, just as in the example I pointed out from the IPCC, our error bars do indeed increase as predictor variables drop out as we go back in time. This is clearly stated in our paper, where we stated “It should be noted that the confidence of the reconstruction, as indicated by the error bars in Figure 2, degrades in the period prior to 1840 as the amount of independent data is reduced.” As far as 2010 having a greater melt index value when processed through the methodology described in our paper, I have not done the calculation, so I don’t know. I have reasons to believe it is not as cut and dry a situation that many of you all tend to want to make it. Further, I don’t see it as a factual error. If the sentence that everyone has the most concerns about is placed back into its proper context of the abstract, it should be plainly clear that our period of record, and thus the sentence in question, only goes through 2009. Heck, the title of our paper is “A reconstruction of annual Greenland ice melt extent, 1784–2009.” So I don’t think that anyone who reads the title and/or the abstract thinks that we have secretly left out 2010. If you picked our paper up in the year 2025 and started reading it, I don’t think you would be under the impression that this sentence in the abstract “The greatest melt extent over the last 2 1/4 centuries occurred in 2007; however, this value is not statistically significantly different from the reconstructed melt extent during 20 other melt seasons, primarily during 1923–1961” was referring to the period 1800-2025. So there is not a factual error in that sentence as written in context, nor has it been established that 2010 has a greater melt index (using our methodology) than 2007. But, like we said in our paper, “…preliminary estimates place the ice melt of 2010 at their highest level since at least 1958” so the possibility exists that 2010 may exceed 2007 (but even so, it doesn’t effect the correctness of that sentence in our abstract in context). Regarding calving…our paper was about surface ice melt, so our comments on other dynamic changes were mere speculation under the assumption that surface melt and other dynamic processes were correlated. As we stated in the paper “The forces acting in concert with ice melt across Greenland to produce higher global sea levels currently, should also have been acting during the extended high‐melt conditions from the mid‐1920s to the early 1960s.” If this assumption is invalid, or is becoming invalid, then our suppositions following there from may need reassessment. I hope this helps explain where we were coming from. -Chip
    0 0
  13. Tom@111, Thanks for the questions. Our ice melt index is an average of the ice melt extent reported by three different research teams (using different methodologies) studying ice melt across Greenland. We didn’t feel that we were in a position to pass judgment on which of the methods was better, so we took the data provided us by the researchers, standardized it, and averaged the three standardized values together for each year. That is why we refer to our value as an ice melt extent “index” (it is unitless). So, the zero value of our index is really just close to the average of the index for the period 1979-2009. Regarding calving, see my comment @112, I think it will answer your question. And regarding the relationship between our reconstructed ice melt index and Greenland temperatures, remember that we also incorporate winter NAO along with summer temperatures into our reconstruction model. NAO doesn’t have a large effect, but it does has some effect, and its influence likely explains the situation that you describe. I hope this helps! -Chip
    0 0
  14. Hello Chip, Back at #61, I showed that you made a demonstrably false statement/claim in you post @58. I was wondering whether or not you have any thoughts on that matter? I also have some other comments/questions, but have to take care of some other matters right now.
    0 0
  15. Hi Albatross, I think I discussed the general topic you were interested in at #61 regarding the impact of 2010 (which remains unknown), in my comments posted above at #112. If not, maybe you can ask them again. Thanks, -Chip
    0 0
  16. Hi Chip, No, #112 does not address the issue, and your post @115 simply evaded the issue. Please read my comment @61 again-- I provided a link to that comment for your convenience in my post at @114 above. I was very specific in that post, concerning the claim that you made @ 58 and why is was demonstrably false. Thank you.
    0 0
  17. Albatross, My command of English must be slipping, because upon re-reading your comment 61 I see nothing that I haven't already addressed. Just because you, perhaps, didn't like my explanation doesn't mean that I haven't offered one. -Chip
    0 0
  18. Hello Chip, Regarding your claim that "My [Chip's] command of English must be slipping,". Perhaps it is. Let me help if I may. And for the record you never have provided an explanation or specific reply to my comment original comment @61, so it is not possible for me to not "like" your explanation. Below is my post at 61 repeated here for everyone's convenience. I spelled out the problem with your claim very clearly: "You claimed in your response that: "We would like to note that waiting for one more year of data is not going to materially affect our analysis or conclusions." We know that claim in demonstrably false, because the melt data for 2010 surpassed those for 2007, which renders the following from your abstract obsolete (i.e., including those 2010 would have very much have affected your conclusions): "The melt extent observed in 2007 in particular was the greatest on record according to several satellite-derived records of total Greenland melt extent." Including those 2010 data also renders the first part of this conclusion in your abstract obsolete, while also calling into question the validity of the second part of the following: "The greatest melt extent over the last 2 1/4 centuries occurred in 2007; however, this value is not statistically significantly different from the reconstructed melt extent during 20 other melt seasons, primarily during 1923–1961" So contrary to your claims made here and elsewhere, the 2010 do very much affect your conclusions and desired narrative. " To summarize (again), the greatest melt over the last 2 1/4 centuries was in fact in 2010, not 2007. You claim that excluding those 2010 data "is not going to materially affect our analysis or conclusions" is demonstrably false, unless you are trying to argue that the 2010 figure was not higher than that observed in 2007. Thank you.
    0 0
  19. Albetross, Since you think that repeating things seems to help clarify things, I'll go ahead and repeat what I wrote in comment 95 concerning the melt extent in 2007 and 2010...
    Granted, incorporating the melt extent for the summer of 2010 into the methodology as described in our paper may have required a few minor tweaks to some of the wording (and a few specific numbers). But, by and large, as I have said many times, I strongly believe (although I have not done the analysis) that the changes would not have altered the general nature of our conclusions (as we explained to the JGR editor).
    and in comment 112 concerning the same thing
    As far as 2010 having a greater melt index value when processed through the methodology described in our paper, I have not done the calculation, so I don’t know. I have reasons to believe it is not as cut and dry a situation that many of you all tend to want to make it.
    So I guess now that we've both repeated ourselves, the topic should be about as settled as it is ever going to get until (when/if) our analysis gets updated. Agreed? -Chip
    0 0
  20. Hello Chip, Thanks for your post @119. You did not refer me to #95 before, you referred me to #112. Regardless, I'm afraid that you insist on continuing to evade the point. Quite frankly your "strong belief" that including the 2010 data would not make a difference to your conclusions is irrelevant, and unscientific to boot. What it boils down to is this. The validity of your argument now rests on you demonstrating qualitatively to everyone that the melt stats for 2007 exceeded those for 2010. While what you believe may be correct (albeit unlikely, given other people's findings on 2010 melt versus other years), you have not demonstrated that despite having ample opportunity to do so. Rather, you admit that you are making a claim without having done the analysis and choose to cite "belief" instead. Not a compelling argument, so thank you for confirming that.
    0 0
  21. I find the paper of seriously limited interest. Since it does not consider calving, it does not address mass balance, which is the really important metric. The main focus appears to be on statistics, while ice sheet dynamics hold many areas of inquiry that are far more interesting than the mere descriptive numbers. It is not very useful for much of anything. As with most statistical approaches, the lack of the most recent data in the analysis makes it even less useful. I'm sure Pat Michaels can throw around a lot of sound bites from it that are technically true within the frame of the paper, and that satisfies him. After all, his main line of work seems to be PR. However, for those who really study ice, like Dr Box or Mauri Pelto, it offers next to nothing toward an improved understanding of the physical reality. Much ado about nothing, really.
    0 0
  22. Chip Knappenberger at 06:30 AM on 4 May, 2011 Since I live in Europe and go to bed 5 or more hours ahead of most of you, your post as been partly answered by others, and maybe we’ve all now learned as much as we need to about this! But concerning statistical analysis I was being a little more specific than is indicated in your point about the IPCC figure; i.e. addressing the assessment of statistical significance in differences between contemporary empirical data with historical data constructed with a model. Your IPCC paleoreconstruction example is a case in point. The 95% confidence range in the annual data in the reconstruction can obviously be defined. However the difference in the instrumental data (apples) with respect to the reconstruction (oranges) is a little misleading when assessed in terms of statistical significance. They don't do this in your example (as your excerpt shows, when addressing comparison of contemporary and paleo data they use a more qualitative, probabilistic statement: "it is likely that the 1990s have been the warmest...."). Obviously one needs to do some sort of analysis, but an apples/orange stats analysis should be accompanied by some careful thought about what’s actually being compared, and in my opinion isn’t suitable for a single bald statement in an abstract. In addition, understanding the relationship between contemporary empirical data and historical reconstruction is deficient without consideration in the context of attribution. With these thoughts in mind I’m mostly curious why the reviewer chose not to consider the stats (perhaps another reviewer did?)! You’ve indicated why you didn’t consider the 2010 melt data, which is quite instructive. It’s left a statement that is factually-incorrect without qualification in the abstract. Still it’s the job of the reviewer(s) to address these points and you seem to have been given a free pass on that!
    0 0
  23. Chip @ 119 (and before) "As far as 2010 having a greater melt index value when processed through the methodology described in our paper, I have not done the calculation, so I don’t know. I have reasons to believe it is not as cut and dry a situation that many of you all tend to want to make it." Surely the data are now available to do "the calculation" and demonstrate that it is "not as cut and dry a situation"? To me this is the obvious next step in order to prove that the 2010 melt season really "would not have altered the general nature" of the paper.
    0 0
  24. Chip has noted the point that makes their paper irrelevant “The forces acting in concert with ice melt across Greenland to produce higher global sea levels currently, should also have been acting during the extended high‐melt conditions from the mid‐1920s to the early 1960s.” If this assumption is invalid, or is becoming invalid, then our suppositions following there from may need reassessment. This assumption has already been demonstrated to be invalid. The Greenland glaciers did not have this period of rapid acceleration from the mid-1920's to mid 1960's comparable to the current acceleration. We can go back and look at the velocity data in that interval from Carbonnell and Bauer for example, for Jakobshavn as published in a 1989 paper of mine , note Table 1. Note also the associated retreat from 1929-1964 is less than that of 2001-2009 for Jakobshavn and in the case of these large marine terminating outlet glaciers it has been shown retreat is related to velocity.
    0 0
  25. Thankyou for responding, but sorry Chip, you've repeatedly avoided the questions regarding the very bold sea level statement made at the end of the conclusions of FKM 2011. I'll quote it here for those who do not have access to the full text: "However, there is no indication that the increased contribution from the Greenland melt in the early to mid 20th century, a roughly 40 year interval when average annual melt was more or less equivalent to the average of the most recent 10 years (2000–2009), resulted in a rate of total global sea level rise that exceeded ∼3 mm/yr. This suggests that Greenland’s contribution to global sea level rise, even during multidecadal conditions as warm as during the past several years, is relatively modest." Surface melt from Greenland is a small part of the global sea level rise budget. The emboldened part above is a demand that global sea level rise should have exceeded 3mm p.a. half a century ago (!!) in order to satisfy claims about Greenland's sea level contribution, and this is very disingenuous. You were asking the impossible of the data, without assessing the global sea level budget, in order to support an unsupportable conclusion. I did read the justifying statement suggesting that the dynamics in the past 'should' be the same as the dynamics of the present, but that doesn't really cut it for the mass balance of an ice sheet which has been monitored at least in part since the 1950s. Many ice outlets have been observed to have substantially accelerated since then, as you are I'm sure aware, yet you avoid that entirely in the paper as it would render your conclusions invalid. By not considering mass loss by other means (see Philippe's comment as well as my earlier questions), you are not in a position to make statements such as your conclusions on Greenland's mass balance, let alone its contribution to global sea level. Sadly, it really does appear that this paper was indeed out of date before going to press, and, while contributing an interesting historical analysis of surface melt (but not mass balance), contributes nothing about present or future climate change. The shills, regrettably evidentially already including co-author Pat Michaels will claim that it means Greenland melting is nothing to worry about, despite the fact that this conclusion is blatantly not supported by evidence presented in the paper.
    0 0
  26. Hi Chip Thanks for responding to my questions @81 I’m not sure if I am understanding how you did your stats. I had assumed you would have tested if 2007 was within the 95% error range of your model but your comment @112 shows this is not correct. Could you briefly explain how you tested 2007 vs previous years and how these 20 years were chosen? Second I am still curious as to why the abstract of your paper emphasised the duration of the current high melt period vs that from the 20s-60s. Why did you consider duration to be important? Lastly I don’t see the relevance of your point @83, that you (the authors) felt that comparing Greenland melt level in recent years to the 20s-60s was important because the prior melting rate didn’t change sea level rise much. We already know that the current level of Greenland melting is not (yet) a major contributor to sea level rise. Ie: checking the IPCC AR4, they estimate total contribution of Greenland to sea level 1993-2003 as ~0.25mm/year. Ie: A small contribution, but one that is clearly increasing (see the GRACE data). Therefore we never would have expected a similar level of melt to have a big impact on sea level rise from the 20s-60s. So what's the relevance? What confuses me a little is what you then say @83 “This lead us to conclude that if the current melt extent stayed somewhat equivalent to what it was back then, we wouldn’t expect a big jump in the rate of sea level rise as a result of cryospheric processes” What evidence do you have to suggest that the current melt rate will stay somewhat equivalent? Because if it doesn’t then your conclusion becomes somewhat meaningless. And unfortunately for your conclusion, observational data tell us that temperatures and mass loss from Greenland are increasing. So unless you would like to go on the record and predict no future increases in temperature or mass loss/ surface melt from Greenland? I don’t see how your conclusion fits the reality on the ice.
    0 0
  27. Whew, lots of questions this morning (my time)! First of all, thanks for all the interest in our paper. I think that I’ve already pretty much explained my side of things (most of the technical questions that are being raised are covered in the paper, so I would encourage folks to read it if they want specific answers to questions about the methodology). I think as we all can see, my answers/responses do not really satisfy anyone. So I think our useful time together is fast approaching an end. Instead on going through the questions one by one and rehashing everything that we’ve hashed through already, I’ll try this…. Our paper was designed to produce a longer temporal framework of the ups and downs of the extent of surface ice melt across Greenland. It was inspired by work published by Dr. Tom Mote in GRL back in 2007 in which Dr. Mote demonstrated a strong relationship between summer temperature from stations in southern Greenland and his determination of surface melt extent based on satellite emissivity observations (which began in 1979). We thought that perhaps such a relationship could be used to hindcast surface ice melt back as far as the temperature observations were available, which turned out to be back into the late 18th century. While researching the topic, we found that the winter NAO index also added useful information on surface ice melt the following summer, and we were able to make use of that information in our statistical model as well. Using a pretty straightforward technique of multiple linear regression, we produced a (near continuous) ‘reconstruction’ of an index of surface melt extent for Greenland from 1784 to 1978. That reconstruction was the guts of our paper. With that reconstruction in hand, we then went on to make some observations (based on a certain set of assumptions), that we thought were interesting about how the current observed period of high melt (and recent trends) fit into that framework. We then went on to speculate on what our results may tell us about the bigger picture, in this case, sea level rise—this speculation was based on a looser set of assumptions (that were also described in the paper). All of this is in the paper that was peer-reviewed and published by JGR. Now, as you all have expressed quite clearly, some of you have other ideas about how things should be interpreted and have made other observations (in some cases based on different assumptions). And when new data come in, even more observations will be able to be made (and assumptions tested). Hopefully our reconstruction provides the framework within which this can take place. It is not an end all and be all, but a tool in which to gauge new observations. The utility of the tool can be judged by the potential users. For those arguing that the tool (the reconstruction) is useless, then there is no reason to even contemplate how the melt during 2010 or any other subsequent year may compare to our determination of the past. For those arguing that the melt from 2010 may alter our observations about how individual and/or multiple year combinations compare to the past (you apparently find the tool to be useful), well, indeed they may. And so too may the years to come. In fact, our paper included this statement in the conclusions “Our reconstruction indicates that if the current trend toward increasing melt extent continues, total melt across the Greenland ice sheet will exceed historic values of the past two and a quarter centuries.” Doesn’t that pretty much fit squarely with what many of you are suggesting? Will the melt during 2010 exceed our melt extent index value for 2007? Possibly (not definitely), and if so, probably not by much. So I don’t anticipate that our conclusions made in the paper will be much impacted. Yes, 2010 may replace 2007 as the year with the greatest melt extent index, but I doubt much else will change substantially. But, I don’t know for sure, as I have stated several times, I have not done the necessary analysis. I think this pretty much sums up the situation from my end. For those of you who have not read the paper and have outstanding issues regarding the technical details, I encourage you to do so, for virtually everything that has been discussed is described in the paper—and, our responses to Jason Box’s review also shed some light on other background/technical issues. Thanks, again, for all your time and interest in our work, and for the discussions we have had. -Chip Knappenberger
    0 0
  28. Chip - Thank you again for the interesting discussion. I am of the opinion that surface melt is only one factor in mass loss, and that hence this single study is insufficient to judge or predict (or for that matter to make statements about) such mass loss. The GRACE satellites, altimetry, and ice speed measurements provide a more complete picture of ice loss, and hence sea level contributions. While I feel it unfortunate that you did not include the 2010 data which should at the least have modified your summary and conclusion sections, the surface melt data and methodology should be useful going forward.
    0 0
  29. Nice discussion all participants. Now that we are all very familiar with the recent paper, it is time to see if there is much new compared to the Wake (2009) paper looking from 1866-2005. This paper is not referenced by FKM, but should be a key paper to be compared to.
    0 0
  30. All I can say is, based on this whole conversation and everything else I've read, it seems to me that FKM2011 required an extensive dancing and dodging in order to come to their conclusion. Though I always appreciate authors coming to SkS to discuss their work, Chip has done little to convince me that their paper will stand as an important work. I agree with Daniel's article here that this paper was obsolete by design. I don't begrudge scientists attempting to break the existing paradigm. It's a hallmark of good science. My frustration, and I believe the frustration with many, is that this paper was published in order to act as a tool for those who wish to instill doubt about the science of climate change. Whereas the fact that this paper is obsolete as of publication is another indicator of how sure the scientific community is about climate change, it will still get used as a public banner used against climate change in order to delay action. I can hardly count the number of times I've had Lindzen Choi 2009 thrown at me, and the number of times I've had to point people to the many responses that render LC09 invalid. Here stands another paper that will be used in the same manner.
    0 0
  31. Dr. Pelto, I was not aware of the Wake et al. (2009) paper. So thanks for the link. Had I known about it, we most certainly would have made reference to it, for it seems, at first skim, to provide solid support for our results. It strikes me as a bit odd that Jason Box (an author of the Wake et al. (2009)) paper didn't mention it in his review. -Chip
    0 0
  32. Well said Rob, I could not agree more. The differences between Wake et al and FKM are stark, largely in how the results are discussed, the care with which conclusions are presented, and the clarity with which the context of discharge mass loss is appreciated in relation to surface runoff. Note how no reference is made to sea level rise, or to future climate based on these results, as appropriate for this type of study. The modelled historical records are comparable, as you might hope, but the inferences are dead wrong from FKM. Sadly, that won't stop them being used by some, time and again.
    0 0
  33. I second Skywatcher's assessment @132 of Rob's excellent and astute post @130. As I mentioned yesterday, there are some other peculiarities in the curious statements made by Chip and Pat concerning the role of internal climate variability in modulating the melt over the GIS (Greenland Ice Sheet), as well as the "moderate" contribution of the recent GIS melt to global sea-level rise. A new report has just come out that challenges the aforementioned claims-- for example, it suggests that the contribution of ice mass loss from GIS to global se level rise may have been too conservative in the most recent IPCC report. More soon when I have some time to put everything together.
    0 0
  34. I just did a better job of explaining what I was trying to earlier in this thread. But, I posted it over at the Center For Inquiry forum. And since it might be straining our SkS moderator's patience, allow me to share the link: The Arctic as a Messenger for Global Processes Climate Change and Pollution 
    0 0
  35. Then leaving it out there to dangle for the “skeptical” echo-chamber to morph it into another “aluminum tubes into nuclear weapons” distortion, then blast the soundbite through their media machine.
    It's not Chip's business to second guess the 'skeptical' blogosphere. Comments implying or directly accusing the authors of dodginess are combative and counter-productive, particularly when Chip has engaged so fulsomely and with good spirit. Please let's stick to facts and figures. Chip has said: "Granted, incorporating the melt extent for the summer of 2010 into the methodology as described in our papes may have required a few minor tweaks to some of the wording (and a few specific numbers). But, by and large, as I have said many times, I strongly believe (although I have not done the analysis) that the changes would not have altered the general nature of our conclusions (as we explained to the JGR editor)." I realize there are issues with the methodology amongst some, but getting a fix on inclusion of 2010 data with the methods used in the paper would be a good next step, no? Can this be done by the good people here questioning the paper? Quantitative analysis beats speculation every time.
    0 0
  36. I'd like to thank Chip for taking the time to come here and discuss the paper that is the subject of this thread (FKM 2011). I'd also like to thank each of the contributors for their interest displayed and for their zeal displayed in the furtherance of science. Participants displayed keen interest and depth of knowledge; even when things got heated, restraint and decorum ruled. The passion for learning on display was gratifying to see. For that is why science is done: to learn things and to then share that learning. (I wish I could have participated more, but an ill-timed multi-day bout of BSOD kept me busy recovering from repeated system crashes. Fingers crossed...) It is that passion for learning and zeal for knowledge that finds it's embodiment in the advancement of the science through the formulation of hypothesis' and studies and experiments designed to test them. In the case of climate science and global warming in general, and the Greenland Ice Sheet in particular, glaciologists like Dr. Jason Box and Dr. Mauri Pelto (and many others over the generations) have built our knowledge of ice sheet dynamics based on observational data (what the various forces acting on the ice sheet are and how the ice sheet has then responded to them) which has then led to a robust understanding of the underlying physics of the ice sheet response. The meta-analysis of existing GIS data undertaken by Frauenfeld, Knappenberger, and Michaels was an interesting method of using existing data to draw various insights into past modeled GIS response to temperatures at various times in the past. A shortcoming of the methodology was the lack of context into the manifold forces acting on the GIS that help then determine the response of the sheet (for example: the effects of the loss of ice shelf buffering and reduced sea ice and landfast ice along the Greenland perimeter, the effect of each is to reduce backpressure along the calving/ice-egdge front, leading then to thinning of the ice streams due to increased basal melt resulting in ice also then moving more quickly along the glacial bed of the streams; this vector change then propagates upglacier, etc). This lack of context reduces the overall value of the FKM methodology to one of evaluating the impact of the new method itself, which (given the above mentioned limitations in this comment and others) is of little interest to those already aware of the state of knowledge of the GIS, such as working glaciologists and other interested parties. Why? Because to them, FKM 2011 adds nothing to the science and is thus obsolete. Where the authors truly missed on an opportunity to both add impact and also advance the state of the science was the record melt of 2010. By September of 2010, the melt season which was the focus of the FKM study (June, July and August, or JJA) was "in the can". Not only were glaciologists everywhere aware of the record melt, but the news had already penetrated the lay news outlets. Had the authors then obtained this data (which surely would have been available upon request even if in rough form only), incorporating it into the FKM study would have pushed the study to the forefront of the field. No, the data would not have been in the proper format the authors were accustomed to dealing with. But that is merely a technical limitation and could have been dealt with. After all, the Muir Russell Commission was able to replicate the entire "hockey stick" from original data in a mere two days (something the auditors still have not yet completed themselves), pronouncing it something easily accomplished (cf page 48 of the report) by a competent researcher. Given the providential opportunity to make a meaningful, lasting contribution to the science by stepping up and making the most of the opportunity, the FKM authors instead took the opposite tack, and further themselves relegated their study to the dustbin of science; of interest to statistics mavens only. That zeal for learning, the desire to increase the state of the science in a specific area, was critically missing in the final form of the FKM study: a 2010-shaped void left its mark by its absence. On the whole I'd say that most of what else I'd planned on saying already got said. Those of who said it must know who you are, so thanks for that. :) A few general observations, then. The regional warming notable in GIS data in the early-to-mid 20th Century certainly could only add little contribution to SLR due to the confining limitations of both the buttressing ice shelves, thick landfast ice and the widespread existence of heavy pack ice. A few illuminating historical charts of Arctic Sea Ice edges, courtesy of Patrick Lockerby's Chatter Box blog: [Source: Philips' Handy Volume Atlas 1930 Arctic map] [Source: Russian map of Arctic, 1955] Compare and contrast the ice edges defined in those images to this recent image: [Source: September/March ice edge(1995-2009 mean)] Left unexplored, and a topic of a future comment by me: The editorial and decision making process at the heart of the publication of an obsolete paper. Best, The Yooper
    0 0
  37. Daniel, Nice summary. It also boils down to this, when the authors speak to the nature of the melting and attempt to place that melting in context, it is unacceptable to exclude extreme events such as 2010. Ignorance is perhaps one thing, but we know that was definitely not the case here. Additionally, they were aware of those 2010 data in September 2010, it is now eight months later, and by one of the authors admission, they have not yet incorporated those 2010 data. That appears to me to be the very antithesis of genuine scientific curiosity, but rather perhaps a situation where the authors had arrived at an answer that they liked, and did not wish to include data that might upset/challenge that. So what happens now? Dr. Box and others have to fill the void and do the job properly and clean up after a paper written by "skeptics". Déjà vu. Of course the failings of the journal and editor on this subject cannot go unchallenged.
    0 0
  38. Chip Knappenberger and Pat Michaels are masters at playing good cop, bad cop, but it is an act. They are both responsible, and being nice to Chip merely advances their misconduct, in this case for hiding the incline. Anyone looking at the FKM paper could see that they were comparing a short period of rapidly rising melt, with a longer more gradual period in the 1930s. As Martin Vermeer put it, what Box offered was a low cost way of making the paper somewhat less dishonest. "This is clearly what Box means by "causal factors"... an analysis of ice melt as relating to temperature is what he would have liked to see, to provide the "depth" that he is missing. But it would have undermined the simple story line of "yet another thing that contradicts warmism"... and it would have been extra work, quite a bit of it. So, Box offers an easy way out, which would also puncture the less-than-100%-honest story line. "
    0 0
  39. I’m going to be a party-pooper again, and state why I consider your narrative to be deficient Daniel. You state that you’re planning a future comment on: ”The editorial and decision making process at the heart of the publication of an obsolete paper.” I hope that when you do so, you can be a little more objective in your analysis than here. Your aim should be to make convincing arguments to reasonable people who might be confused about some of the issues related to the science and politics of climate studies. So far it doesn’t seem like it. Here’s some of what I consider to be problematic: 1. Your paragraph (it helps with long posts to number your paragraphs) starting and ending with:
    ”This lack of context……. Because to them, FKM 2011 adds nothing to the science and is thus obsolete.”
    ... isn't really correct. FKM2011 does add something to the science, and its benefits might have outweighed the negatives if it had been properly reviewed. One of the important elements of science is that interpretations are broadly independent of methodological approaches (in other words the essential features of the study object – the stark and uninterpreted historical and contemporary Greenland melt in this case- are revealed by independent analyses using different methods). FKM2011 is surely a useful confirmation of the conclusions of Dr. Box who addressed this subject in a paper in 2009: [L.M. Wake et al (2009) Surface mass-balance of the Greenland ice sheet since 1866, Annals of Glaciology 50, 178]. The abstract concludes: (concerning Surface Mass Balance = “SMB”):
    ”All SMB estimates are made relative to the 1961–90 average SMB and we compare annual SMB estimates from the period 1995–2005 to a similar period in the past (1923–33) where SMB was comparable, and conclude that the present-day changes are not exceptional within the last 140 years.”
    FKM2011 can't be too far wrong if the conclusion from the perspective of 2010 is similar to the perspective of an expert in 2009. I hope we're not go down the route of insisting that the essential elements of a particular local climate state is defined by 1 year’s data! That sounds like "cherry-picking" to me. 2. You suggest (in a somewhat Mills and Boon style if I may say so!) that: ”a 2010-shaped void left its mark by its absence.” But Dr. Box’s 2009 paper included data through only 2005. Are we going to complain that in Dr. Box’s study ”a 2009-shaped void left its mark by its absence.”? …not to mention the 2008-shaped void, and the 2007-shaped void, and the 2006-shaped void? Or are we a little bit reasonable and recognise that one can only include data in a paper that actually exists? And how do we decide when to cause a fuss about where to extend a study? 2008 and 2009 melt years were the lowest for some time (Tedesco and Fettweis data in Fig 2 of your top article). If FKM2011 was actually FKM2010, would this kerfuffle have arisen? Nope. 3. You state omnisciently:
    ”No, the data would not have been in the proper format the authors were accustomed to dealing with. But that is merely a technical limitation and could have been dealt with. After all, the Muir Russell Commission was able to replicate the entire "hockey stick" from original data in a mere two days (something the auditors still have not yet completed themselves), pronouncing it something easily accomplished by a competent researcher.”
    That is entirely unreasonable. It’s not that the data weren’t “in the proper format”. The data from independent groups used by FKM for their model simply weren’t available! That’s not “merely a technical limitation”. It means the analysis for the model simply couldn’t be done. Your analogy of the Muir Russell Commission (MRC) is completely inappropriate, and I fear it makes you appear as if you don’t consider this a subject that should be addressed objectively. The data for that reproduction existed, and in fact had been already “reproduced” several times (e.g. by Wahl and Amman). The independent data used by FKM for their reconstruction didn’t exist. This seems astonishingly easy to understand…. 4. One of the things that stands out from the comments on this thread is that the real problem with FKM2011 is easy to glean and would have been straightforward to address if a reviewer had chosen to do so. Right through the thread (e.g. see my comments, those of Dikran Marsupial, Tom Curtis and Dr. Pelto) we have highlighted statements, sentences or sub-paragraphs that were inappropriate interpretations given the scope of the data and independent knowledge. A reviewer should have ensured that these statements were removed from the paper and the data properly described in relation to the marked 2010 temperatures and melt, and especially in terms of the sort of information that Dr. Pelto has described about the nature of glacier recession in the early 20th century melt period and now. That was what was required of this paper - a thorough and if necessary suitably blunt review in late Dec/early Jan. At least one reviewer was offered the opportunity to do this on Dec 27th last. Unfortunately he declined. 5. We would have been left with a rather dull but confirmatory study of Greenland melt, that would have added a little (a few more years) to Dr. Box’s own paper published in 2009 (see [1.] above). That would be fine. You’re allowed to publish dull and confirmatory studies. The “house journals” of particular scientific fields are full of them. At least one journal I know of even has categories for the reviewer’s general assessment of a paper that includes the category “dull but sound”. That’s an indication to the editor that the manuscript is pretty borderline. In this particular case at least one reviewer thought FKM2011 was better than that. He categorised it as “good”.
    0 0
  40. barry
    I realize there are issues with the methodology amongst some, but getting a fix on inclusion of 2010 data with the methods used in the paper would be a good next step, no? Can this be done by the good people here questioning the paper? Quantitative analysis beats speculation every time
    I asked Chip the same thing by private email explaining that I'd like to do this myself. The satellite index melt data KFM2011 used to compute the average in their figure 2 come from index from Abdalati and Steffen, 1997; Fettweis et al., 2007; Mote, 2007. His answer is as far as he is aware, those data aren't available yet. When reading here, I saw the link to the Tedesco paper which contains melt index data for 2010. (This paper was published after the final version of KFM2011 was submitted to JGR but before KFM2011 was published. But as readers are aware, one isn't permitted to completely recompute ones results after a paper has been accepted.) The Tedesco paper would seem to have data that we might use to make a decent guess as to whether the results of KFM2011 would be obsolete when 2010 melt data were published. Specifically, had Tedesco been used as the melt-index, the relevant 2010 melt data would be the value for 2010 in figure 1C in Tedesco. I examined figure 1C and drew a trace to see how the melt index for 2010 compares to melt data for 2007: It seems according to Tedesco melt index for 2010 was exceeded that for 2007 by a tiny amount. In corporating this value into KFM would involve adding a blue dot for 2010 to figure 2 in KFM. Here's my marked up version with lines illustrating various features of the graph: Assuming the relative values of the melt indices from 2007 and 2010 from the two other groups exceeds 2007 by a similar tiny amount, the final blue dot representing 2010 melt data : * would likely still fall inside the ±2σ uncertainty intervals for roughly 20 years of the reconstructed melt data. That is: given what we know, we would not state that 2010 had a record melt index. (I think this is the relevance of explaining the measured melt index for 2007 falls inside the uncertainty of the reconstruction. Based on what we know, we can't call 2007 since 1840 or even earlier start years. ) * the 10 year lagging average would likely still fall below the levels achieved during the previous rapid melt period. * the duration of the recent rapid melt period would remain shorter than the previous one. I suspect that the first two of these things may change during the next El Nino. But as far as I can see, incorporation of the 2010 melt data would require KFM to slightly tweak their text. Adding the data did not make the paper "obsolete". What mystifies me is why Jason Box, who is a co-author and who claims the 2010 data would and does make the paper obsolete didn't just slap the 2010 data point from Tedesco onto KFM2010. I'd do it myself, but I don't know if re-baselining would be required. But it seems to me that if we added the Tedesco data to the KFM2010's figure, the appropriate tweak the KFM2010's abstract is to strike out "2007" and replace it with "2010". This may change when the melt data from the other groups is available. I'll try to remember this issue and comment when it does become available. My fuller discussion is here
    0 0
  41. Eli, I certainly agree with your first statement. You reproduce something Martin Vermeer stated, viz:
    ""This is clearly what Box means by "causal factors"... an analysis of ice melt as relating to temperature is what he would have liked to see, to provide the "depth" that he is missing. ......"
    Two things about that: 1. First, that may very well be what Box meant, but if he did mean it why didn't he say so? Several commentators have suggest interpretations of what Dr. Box meant in his review. In my opinion it's farcical. If it's not possible to give clear and unambiguous guidance to an editor then I don't see how one can subsequently complain when a deficient paper results. 2. Secondly if Martin thinks that "an analysis of ice melt as relating to temperature is what he would have liked to see...", then he could look at page 3 of FKM2011 and read the section that begins: "Our Greenland melt reconstruction therefore focuses on the relationship between summer average temperatures from the available four coastal locations in southern Greenland and our standardized melt index." where an analysis of ice melt as relating to temperature is described; i.e. it uses the empirical temperature and melt data for the period 1979-2009 in order to optimize a model for the relationship between temperature and melt that can be used to determine historical melt. Dr. Box classified the paper methodologically as "good". I'm not playing Devil's Advocate here. In my opinion a truly dismal review has caused a huge amount of confusion over this paper. We (and the editor!) shouldn't be having to guess what the reviewer meant, and if he felt so strongly about defects in the paper he should have taken the opportunity to re-review it in early Jan and do somethibg about it, rather than get mad.
    0 0
  42. Chris, seriously? Are you blaming a bad review for this paper? Is this Odonnel/Steig all over again? You have seen what the author's have done with it since, right? Do you really think Box's ideas could have saved it from the publishing afterglow? Do we really need to act dense to this issue to appear *nice*? I'd look at Wake 09 to see how this paper's conclusions should have been written, as stated earlier. This way we can congratulate the author's on the statistical methods and then turn back to analyzing reality.
    0 0
  43. Chris @139 and @141, I agree with some of your comments, in particular I agree that Dr. Box could have handled the review better, and so could the editor. I do, however, take issue with other claims and arguments that you made. Unfortunately, I do not have time to properly address them all today. At the end of the day, and despite all the attention, KFM have to this day still not bothered to include the 2010 data-- surely data format issues have not held them back for eight months! Note what the Sir Muir Russell inquiry accomplished in a matter of days. Instead, it is unfortunate that we now have "lukewarmer" bloggers now trying to defend KFM, as of course they would. It would be much better for all concerned if KFM did the analysis themselves. While KFM and Wake et al. are in broad agreement, there are striking differences in how the results are interpreted, and how the findings are being used (or is that abuse din the case of Pat Michaels?). Your comment about Wake et al.'s "void" is a strawman and very much avoids the issue at here and now, unless of course you can demonstrate that reviewer's of the Wake et al. paper specifically requested that they include the 2006-2008 data. What is (intentionally) lost in all this is that the current warming is in all likelihood not transient whereas the 1925-1955 event was, and its causes are in all likelihood very different than those driving the warming now and into the future-- I'll post some more on this tomorrow when I have more time. Citing the KFM paper as evidence that what is happening now (and where we are heading) is not exceptional, and possibly even natural or within the realm of natural variability is thus misleading, disingenuous and wrong. The duplicity being shown by Knappenburger and Michaels is also deeply disturbing. I could be more direct and forthright, but that might violate the comments policy. Chris, let us not be naive about the game that is being played by KFM-- 'skeptics' have quite a long history of "playing" peer-reviewed journals.
    0 0
  44. Not really grypo. However an incisive review, paarticularly in late Dec/Jan, could easily have addressed the several problmatic sentences in the paper, and ensured that the data was properly interpreted in relation to independent data. (Not sure what you mean by O'Donnel and Steig) Yes, I've seen a little of what the authors have done with it. What do you expect - that's how a couple of the authors earn a living I believe. Not sure about Box's "ideas" - however he has considerable expertise in the subject of the paper, and it would have been nice if he'd chosen to review the paper robustly in Jan. At the very least some incorrect statements in the abstract should have been removed/corrected. Not sure what you mean by "acting dense to this issue to appear "nice""? I hope I'm not acting dense, and I certainly don't think I'm being nice, although I am trying to be scientific, objective and accurate! Here's the conclusions of Wake et al 2009 that you suggest should be a model for how KFM should have written theirs. They don't actually seem so different in general outline from FKM's. I would conclude from the conclusions of Wake et al that things are not very different now in Greenland than then, just like FKM (my bold in the conclusions below). I don't actually think that's going to be true going forward into the future, but a dispassionate read of Wake et al's (2009) conclusions wouldn't give you that idea, apart perhaps from the sentence about disappearance of some ice sheet points... CONCLUSION We have presented a modelling study tracking SMB changes of the Greenland ice sheet since 1866, reflecting how the ice sheet has behaved under the climatic conditions of the 19th– 21st centuries. Over the time window of our study, we find that the Greenland ice sheet has reacted to, and endured, a temperature increase similar to that experienced at present. Higher surface runoff rates similar to those of the last decade were also present in an earlier warm period in the 1920s and 1930s and apparently did not lead to a strong feedback cycle through surface lowering and increased ice discharge. Judging by the volume loss in these periods, we can interpret that the current climate of Greenland is not causing any exceptional changes in the ice sheet. Mass loss through glacier discharge is currently believed to dominate mass loss through SMB, and both processes are likely to be correlated. Forman and others (2007) report that the ice sheet retreated 1–2km inland at Kangerlussuaq, West Greenland, over the past 100 years. Although our model resolution is 55 km, we predict complete disappearance of some ice-sheet points in this area, in line with these observations. We are not able to shed light on the relative contributions of ice dynamics vs SMB to the current mass loss, but our study puts the modernday changes into the context of longer-term century timescale changes."
    0 0
  45. Albatross, I'm not being naive (or I should say I don't consider that I am). In this particular instance I consider many of the individuals complaining about this mess, to be naive: There are two elements that ensure decent quality papers. The first is the inherent scientific integrity in the vast majority of publishing scientists (the most important part of peer-review; i.e. "self-peer-review"). The second is the peer-review process itself (reviewers giving robust and unambiguous guidance to editors). It's very rare indeed that each of these fail at the same time. Of course KFM are "playing games". We all know that. So in this particular case, we lose a main element of peer review, and are left with the other to hold the fort. Unfortunately the reviewer most qualified to do this seems to have deserted his post. He wrote a dismal review (have you read it?), classified the paper as "good", and declined to re-review the paper at a time when he could have made some very strong recommendations indeed. Why complain now? My comments about Wake et al don't constitute a strawman, and I recommend tha people try to look at this from an objective viewpoint. Wake et al demonstrate that so long as one is clear about the period of analysis, it's acceptable to publish a paper in 2009 that only includes data through 2005. It doesn't matter whether or not a reviewer suggested that they should have included more up to date data. The editor can overrule that if he considers the suggestion is unreasonable. The obvious point that several people seem preternaturally unable to absorb is that one cannot include data in a paper that doesn't yet exist. The editor seems to have cottoned on to that reality. Of course that doesn't absolve KFM from interpreting their data properly in the light of the 2010 data as it stood especially in December 2010. Unfortunately the expert reviewer declined to take part in the process that would have ensured they did. (not sure what the second reviewer was doing - I wonder whether he might be hiding under his bed until this blows over, and hoping that no one decides to identify him/her!). Sadly, we can't conjure up good outcomes by a combination of indignation and anger. It really helps if the systems of peer review work well enough at source.
    0 0
  46. And for a comparison to the Wake et al. conclusions provided by chris@144... Here is the first paragraph of conclusions from our paper:
    We have created a record of total annual ice melt extent across Greenland extending back approximately 226 years by combining satellite‐derived observations with melt extent values reconstructed with historical observations of summer temperatures and winter circulation patterns. This record of ice melt indicates that the melt extent observed since the late 1990s is among the highest likely to have occurred since the late 18th century, although recent values are not statistically different from those common during the period 1923–1961, a period when summer temperatures along the southern coast of Greenland were similarly high as those experienced in recent years. Our reconstruction indicates that if the current trend toward increasing melt extent continues, total melt across the Greenland ice sheet will exceed historic values of the past two and a quarter centuries.
    Not really very different from Wake et al. This conclusion follows directly from our work and will be little impacted by what occurred in 2010. In the last two paragraphs of our Conclusions, we go beyond our direct results, and speculate on sea level rise. In writing a paper, it is not particularly unusual to try to put the results in the bigger picture. -Chip
    0 0
  47. Oddly Dan thinks: "No, the data would not have been in the proper format the authors were accustomed to dealing with. But that is merely a technical limitation and could have been dealt with. After all, the Muir Russell Commission was able to replicate the entire "hockey stick" from original data in a mere two days (something the auditors still have not yet completed themselves), pronouncing it something easily accomplished (cf page 48 of the report) by a competent researcher." Muir Russell did no such thing. They constructed their own 'replication' of the land temperature series (chapter 6) and not the hockey stick. Strange the simple mistakes people make when grasping at straws. On the issue of failing to use "up to the data" I'm fairly confident that no one here will throw out all papers that are published with truncated data series. if that were the case some of Box's own work would qualify as bad science. And of course we have the famous example of Santer's paper. I would hope that KFM would publish their code so that an update could be made. That seems a simple matter and I suppose someone can go hound them for the code. The issue seems to be this: "Had the authors considered all available data, their conclusion that ‘Greenland climate has not changed significantly’ would have been simply insupportable." That is a TESTABLE claim. but no one has taken the time to test it. It seems rather brazen to claim that their conclusions would have been unsupportable. Well, test the claim of this post. if they had considered all the data would their conclusions be unsupportable? dont wave your skeptical arms. Ask them for their code and do the work. And what specifically do you think was wrong. you wrote "They write: “We find that the recent period of high-melt extent is similar in magnitude but, thus far, shorter in duration, than a period of high melt lasting from the early 1920s through the early 1960s. The greatest melt extent over the last 2 1/4 centuries occurred in 2007; however, this value is not statistically significantly different from the reconstructed melt extent during 20 other melt seasons, primarily during 1923–1961.”" if you add 2010 data which sentence is wrong A "We find that the recent period of high-melt extent is similar in magnitude but, thus far, shorter in duration, than a period of high melt lasting from the early 1920s through the early 1960s." adding 2010 data wont change a word of that claim. B "The greatest melt extent over the last 2 1/4 centuries occurred in 2007; however, this value is not statistically significantly different from the reconstructed melt extent during 20 other melt seasons, primarily during 1923–1961.”" adding 2010 data will change one word here. So.. The greatest melt extent over the last 2 1/4 centuries occurred in 2010; however, this value is not statistically significantly different from the reconstructed melt extent during 20 other melt seasons, primarily during 1923–1961. better?
    0 0
  48. Well done Daniel Bailey, you have drawn the "lukewarmers" (but I think that excludes poster Chris) out of the woodwork to defend their champion Michaels. Yes, please KFM release the code and perhaps CA will do a thorough audit of KFM too, and then perhaps, just perhaps, pigs might fly.
    0 0
  49. Chris, (the "dense" remark was not about you, it was everyone's ability to ignore the CATO article elephant in the room) "However an incisive review, paarticularly in late Dec/Jan, could easily have addressed the several problmatic sentences in the paper, and ensured that the data was properly interpreted in relation to independent data. " Well, he certainly could have, but Box's initial review tried to make the paper better by suggesting the FKM consider the warming and cooling causal factors that Box himself used to predict the 09-10 melt, accurately. But as a shortcut, he suggested they include the 2010 data. Now, we are all worked up because the data wasn't available, or timed right, even though, somehow, every other expert knew the implications, but whatever, who cares? Box's point is that publishing "as is" was insignificant and not up to JGR's usual standard. So his suggestion was ignored. This paper was too important wait apparently. Not my call or Box's. This coupled with that way the paper has been used, post-publication, is the real story here. Unless these are addressed, getting on to Box's handling of the review process seems like a misdirected priority. Although, it is certainly something to discuss in improving the review process in climate papers.
    0 0
  50. Lucia @140 and Mosher @147 suggest that using 2010 data would simply require substituting 2010 for 2007 in the sentence,
    "We find that the recent period of high-melt extent is similar in magnitude but, thus far, shorter in duration, than a period of high melt lasting from the early 1920s through the early 1960s. The greatest melt extent over the last 2 1/4 centuries occurred in 2007; however, this value is not statistically significantly different from the reconstructed melt extent during 20 other melt seasons, primarily during 1923–1961.
    Close scrutiny of the graph of the Tedesco figures (Figure 2 above) shows that the difference between 2007 and 2010 mass loss is only 1/6th of the difference between 2005 and 2007. Assuming a similar magnitude difference in the Ice Melt Extent Index, one difference the inclusion of 2010 would make is that the number of years prior to satellite observations in which 2010 lies within the 95% confidence intervals reduces to approximately eleven. The number of reconstructed temperatures lying within one RMSEv of the 2010 value would probably also fall from two to either one or zero. The trailing 10 year moving average for 2010 would also rise by about 0.3 points to almost match that in the 1930's. Given these changes: 1) Ice melt extent in the 2000's would be statistically indistinguishable from that for the highest period in the reconstruction. (This is true as it stands, but apparently was not worthy of comment in the paper.) 2) The two years with the greatest ice melt extent would have occurred in the last ten years, and five of the most extensive melts would have occurred in the last ten years. In no other ten year period would more than two of the ten most extensive melts have occured. 3) The year with the highest melt extent would be the most recent year, with just eleven reconstructed values having 95% confidence intervals encompassing that value. 4) The relatively low ice melt extents in the early satellite period are due in large part to major tropical volcanic eruptions, eruptions which were absent in the 1930s. In the absence of these erruptions, the longest and period of extensive melting would be that straddling the end of the 20th century, not that in the middle. Clearly natural forcings have favoured extensive ice melt in the mid 20th century, while acting against it towards the end. (True also in 2009, and surely worth a mention in the paper.) A paper drawing these conclusions, IMO, would be substantially different from the paper actually produced. Certainly it would have been very hard for Michaels to place the spin on it that he as been doing. Of course, there are certain caveattes to this analysis. Firstly (and most importantly), Tedesco shows mass loss, while FK&M show melt extent. The two are not equivalent and it is possible to have (as in 2005) very extensive melt areas with restricted mass loss due to greater precipitation. Given comments by Box, it is quite possible that that has indeed happened in 2010. If that where the case it would require an even more extensive revision of FK&M 2011 to bring it up to 2010, datawise. Second, this analysis has been done graphically, and has all the consequent uncertainties (ie, the numbers might be out by one or two in either direction). This is particularly the case in that FKM's graph reproduce by Lucia has an uneven scale.
    0 0

Prev  1  2  3  4  5  Next

You need to be logged in to post a comment. Login via the left margin or if you're new, register here.


The Consensus Project Website

THE ESCALATOR

(free to republish)


© Copyright 2024 John Cook
Home | Translations | About Us | Privacy | Contact Us