Climate Science Glossary

Term Lookup

Enter a term in the search box to find its definition.

Settings

Use the controls in the far right panel to increase or decrease the number of terms automatically displayed (or to completely turn that feature off).

Term Lookup

Settings


All IPCC definitions taken from Climate Change 2007: The Physical Science Basis. Working Group I Contribution to the Fourth Assessment Report of the Intergovernmental Panel on Climate Change, Annex I, Glossary, pp. 941-954. Cambridge University Press.

Home Arguments Software Resources Comments The Consensus Project Translations About Support

Bluesky Facebook LinkedIn Mastodon MeWe

Twitter YouTube RSS Posts RSS Comments Email Subscribe


Climate's changed before
It's the sun
It's not bad
There is no consensus
It's cooling
Models are unreliable
Temp record is unreliable
Animals and plants can adapt
It hasn't warmed since 1998
Antarctica is gaining ice
View All Arguments...


Username
Password
New? Register here
Forgot your password?

Latest Posts

Archives

Michaels Mischief #1: Continued Warming and Aerosols

Posted on 26 July 2011 by dana1981

Patrick Michaels is not known for his tendency to present a full accurate picture of climate science evidence (see for example his distortion of Hansen's famous 1988 study in testimony before US Congress).  Nevertheless, Forbes business magazine has decided to give Michaels a blog on their website.  We had hoped that when given the opportunity to write for such a high-profile media outlet, Michaels would strive for a more honest and complete representation of the scientific evidence for his newfound audience.  Unfortunately, as we will see below, Michaels' Forbes blog appears to continue his problem with leaving out the inconvenient bits of data, in addition to the now familiar "skeptic" pattern of self-contradiction.

Michaels vs. Michaels

In a recent blog post, between his title and second sentence, Michaels managed to contradict himself twice:

As Michaels undoubtedly knows, 'no statistically significant [at a 95% confidence level] warming' is not even remotely equivalent to 'no warming'; this is a Fox News and Daily Mail-level lie.  According to the University of East Anglia (UEA) data (HadCRUT), the average surface temperature has warmed 0.12°C since 1996 - it may not be statistically significant, but that's the trend Michaels references in his quote.  So he effectively goes from saying 'no warming' to '0.12°C warming' back to 'no warming' in the span of two sentences!

Ironically, in making this argument, Michaels relies exclusively on the HadCRUT surface temperature data set compiled by the Met Office Hadley Centre and UEA Climatic Research Unit (CRU).  But Michaels has previously severely criticized the CRU data set:

So why is Michaels now relying exclusively on a data set which he has previously criticized so harshly?  Most likely it's because HadCRUT shows the smallest warming trend over the past 10 to 15 years, in which case Michaels is not only contradicting himself, but cherrypicking.

The Warming Continues

Michaels also engaged in some rather blatant cherrypicking by choosing November of 1996 as his starting point.  "Skeptics" used to claim that there has been no [statistically significant] warming since 1995, but as we previously reported, the global warming trend since 1995 in the HadCRUT data set is now statistically significant at the 95% confidence level.  So Michaels has moved the goalposts and selected the earliest date at which the HadCRUT trend fails this statistical significance test, and then deceived his audience by claiming that lacking stastistical significance means "no warming."

But HadCRUT isn't the only game in town, and as noted above, Michaels supposedly doesn't trust their data.  The global warming trend in the NASA GISS data set, for example, is statistically significant over the cherrypicked period in question.

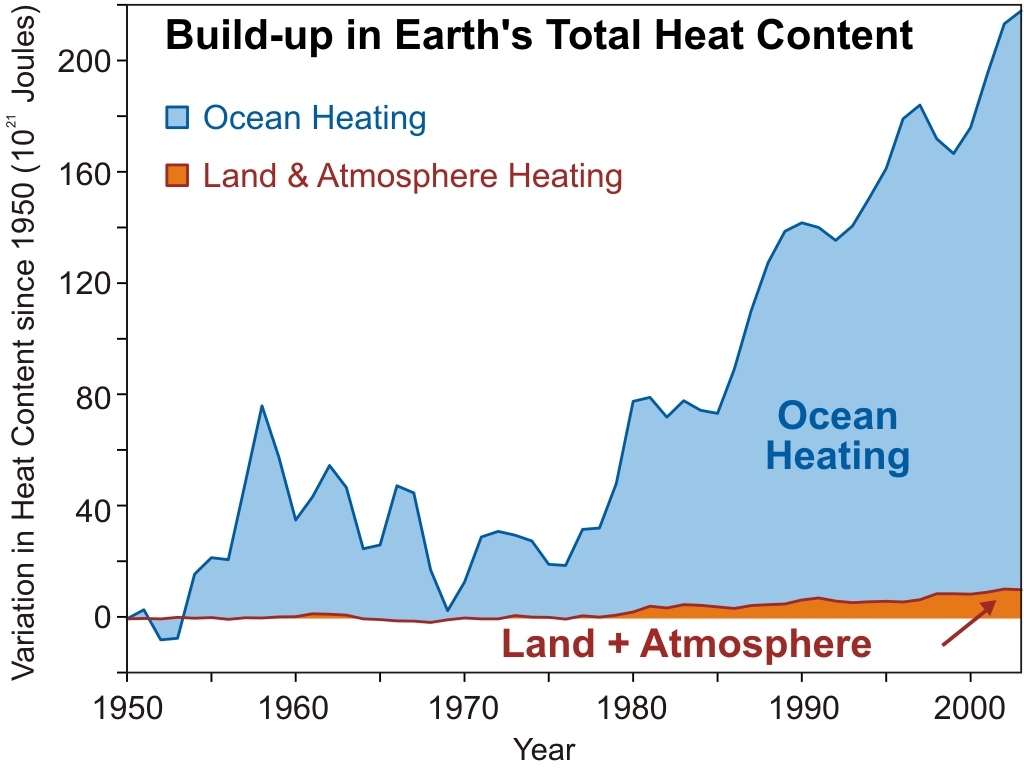
And of course surface temperatures are only a small part of the global picture.  The vast majority of heat is going into the oceans:

ocean heating

Thus we see that Michaels' titular claim of no warming for 15 years is wrong on many, many levels.  The error-riddled introduction to the post leads to a discussion of a paper we recently reviewed: Kaufmann (2011).

Kaufmann (2011)

As Rob Painting discussed in his analysis of the paper, Kaufmann et al. examined the slowed rate of global warming between 1998 and 2008 (note that we're no longer looking at November 1996 to June 2011, so Michaels' error-riddled introduction is also irrelevant to the rest of his post).  Kaufmann et al. concluded that the slowed rate of warming could be explained by a combination of factors: changes in the El Niño Southern Oscillation (ENSO; 1998 was the strongest El Niño in a century, and 2008 was a strong La Niña year), declining solar activity (the end of this period saw the longest solar minimum in a century), and increased human aerosol emissions primarily from China's expansion of coal combustion as a power source. 

Unfortunately, Michaels' description of the study's results isn't very accurate:

"Kaufmann’s team looked into how sulfate uncertainty impacted its results and decided that it was relatively minor."

Here are Kaufmann's actual results (emphasis added):

"Declining solar insolation as part of a normal eleven-year cycle, and a cyclical change from an El Nino to a La Nina dominate our measure of anthropogenic effects because rapid growth in short-lived sulfur emissions partially offsets rising greenhouse gas concentrations."

"The increase in sulfur emissions slows the increase in radiative forcing due to rising greenhouse gas concentrations (Fig. 1).  Net anthropogenic forcing rises 0.13 W?m2 between 2002 and 2007, which is smaller than the 0.24 W?m2 rise between 1997 and 2002."

Even though human CO2 emissions accelerated between 2002 and 2007, the anthropogenic forcing increase actually slowed by 46% as compared to 1997 to 2002, due to the increase in aerosol emissions.  This is hardly a "relatively minor" impact.  In fact, Solomon (2011) concluded that aerosol cooling has offset one-third of the CO2 warming since 2000.  Wild (2011) also found that the amount of solar radiation reaching the Earth's surface has declined significantly since 2000 over east Asia:
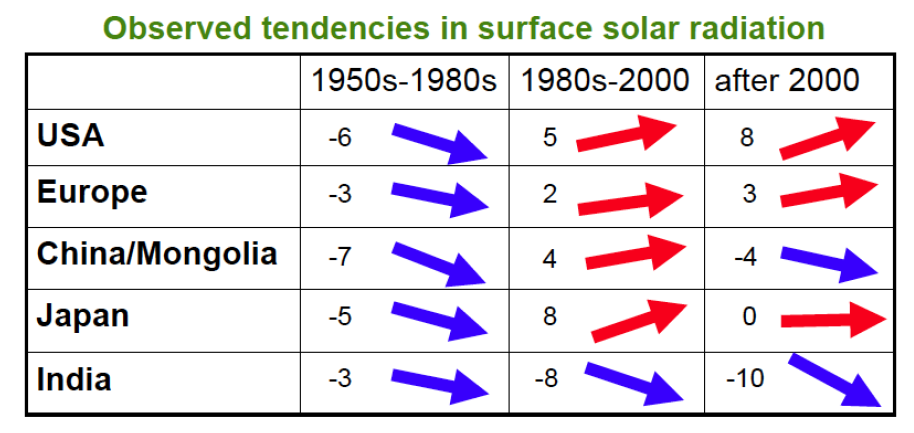
Wild figure 2

Changes in surface solar radiation observed in regions with good station coverage during three periods. The 1950s-1980s show predominant declines (“dimming”, left column), the 1980s-2000 indicate partial recoveries (“brightening”, middle column) at many locations, except India, while recent developments after 2000 show mixed tendencies (right column). Numbers denote typical literature estimates for the specified region and period in W/m2 per decade (Wild 2011).

More Aerosol Research

Michaels makes the valid point that the effects of aerosols on global temperatures remains a significant uncertainty in climate science.  He claims that since aerosols have a short atmospheric lifetime, they aren't well-mixed throughout the atmosphere (unlike greenhouse gases).  Thus if they have a significant cooling effect, it should be observed primarily in the northern hemisphere, where China is located. 

However, China is located relatively close to the equator.  As Rob Painting noted in his Kaufmann post, according to Rasch (2000), emissions from Asia are able to reach the upper atmosphere and spread out over both hemispheres.  Hatzianastassiou (2011) actually found that solar dimming has been greater in the southern than northern hemisphere, because the aerosol cooling effect is largest in pristine areas where there is little pollution to begin with.  This research directly contradicts Michaels' assumptions.  Furthermore, there could be other effects (like ENSO) affecting the warming trends in the southern vs. northern hemisphere.

Nevertheless, Michaels proceeds with his faulty premise by plotting hemispheric data from HadCRUT (for which he appears to have discovered a newfound appreciation), and notes that since 1998, the northern hemisphere shows a slight warming trend while the southern shows a slight cooling trend.  Michaels then declares that he has debunked Kaufmann's research, and proven that climate sensitivity is low.

The Rest of the Picture

It should go without saying that it's unwise to declare that virtually all previous climate sensitivity studies are wrong, based on little more than a superficial analysis of 10 to 12 years of surface temperature data.  But the real flaw in Michaels' argument is that he only looks at the hemispheric temperature trends since 1998, but fails to compare them to the pre-1998 trends.

We know that over the past century, the southern hemisphere has warmed more slowly than the northern hemisphere (primarily because it contains less land and more oceans, and water takes a lot of time and energy to heat up).  So the fact that the southern hemisphere is still warming less quickly than the northern hemisphere doesn't tell us anything by itself.  We need more data to see the whole picture. 

According to HadCRUT northern hemisphere data, the warming trends for 1975-1998 and 1998-Present were from 0.18°C/decade and 0.055°C/decade, respectively.  In the southern hemisphere, the trends were 0.13°C/decade to -0.046°C/decade.  So this data does support Michaels' premise: the southern hemisphere trend decreased more than the nothern hemisphere.

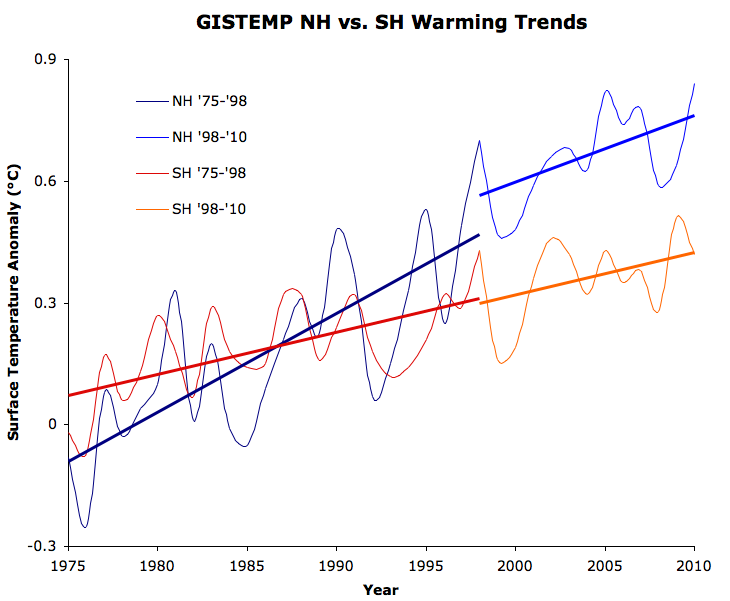
However, the data from NASA GISS shows a different picture.  The figure below shows the  surface temperature and linear warming trends according to GISTEMP from 1975 to 1998, and 1998 to 2010.

NH vs. SH

As you can see, the southern hemisphere warming trend is almost identical during the two periods (~0.1°C per decade), whereas the northern hemisphere warming trend has declined 32%, from 0.24°C per decade to 0.17°C per decade. 

Thus we see that contrary to Michaels' argument, it's neither necessarily true that aersols cooling should have had a larger effect in the northern hemisphere, nor that the southern hemisphere warming necessarily slowed more than the northern since 1998.  The effects of aerosols (both geographic and global) remain a significant uncertainty, and Michaels is grossly oversimplifying the situation, which leads him to the wrong conclusion.

Summary

Michaels committed the dishonest act of equating 'no statistically significant warming' with 'no warming'.  He relied exclusively on CRU temperature data to make his arguments, even though he has previously criticized this same data, because the other temperature data sets do not support the arguments Michaels makes.  On top of cherrypicking data sets, Michaels cherrypicks the exact earliest month to make the deceptive 'no statistically significant warming' argument.

Michaels' portrayal of Kaufmann's study was not very accurate, nor were his assumptions about the geographic distribution and effects of aerosols.  Overall, other than noting that the effects of aerosols remain a significant uncertainty, there is little accurate scientific content in Michaels' blog post, and he draws the wrong conclusion by grossly oversimplifies the picture.

Unfortunately we can undoubtedly expect to see much more of the same inaccurate representation of climate science from Michaels and Forbes in future blog posts, which will likely be the subjects of future Michaels Mischiefs.

0 0

Printable Version  |  Link to this page

Comments

Prev  1  2  

Comments 51 to 90 out of 90:

  1. KR @49, beautifully summarized.
    0 0
  2. MattJ @41, while I agree in principle, I have found that when attempting to do exactly that for readers of The Australian, my letters to the editor if even slightly critical of The Australian's reporting are immediately consigned to the trash can. I doubt Forbes editors will be any more generous.
    0 0
  3. Eric the Red, perhaps I can illustrate the problem we have with your line of argument. I took the Gisstemp annual data, and calculated successive 7 year trends from 1880-1886 to 2004-2010. I then determined how many of the seven year trends were less than one fifth of the 1880-2010 linear trend. It turned out that 51 of 125 successive seven year trends where "flat", ie, less than a fifth of the 1880-2010 linear trend. Of course, the full period includes some episodes of sustained negative trends. So I performed the same test for the period 1975 to 2010. Over that period, 8 out of 30 successive seven year trends, or just over one in four trends where flat. Excluding the most recent such flat trends (2002-2008, 2003-2009), it drops back to 1 in 5. Curiously, it there where 12 years between the previous such flat interval and the most recent two. Clearly such flat periods are common place in noisy data with a positive overall trend. Arguing from the existence of such a flat period to the conclusion that the trend has reversed is a fools game. That, however, appears to be what you are doing. In fact, what you are doing is best described as trying to amplify noise so much that it gets mistaken for signal. On a side note, the one time the ling term trend did definitely downturn in the 20th century, there where six flat or negative successive seven year trends in a row. So, if the trend continues to be flat for four more years, then you would have evidence worth talking about. In the mean time, if you want to argue that we are experiencing a downturn in global temperatures, you need to argue the physics, not just numerology.
    0 0
  4. Just a quick question, but the OP says that aerosols are up in part due to increased coal-burning by China. However this new NASA study (in press apparently) disagrees citing natural causes for the aerosol increase. Total aerosol amounts would also indicate contrary evidence to this claim. http://www.agu.org/pubs/crossref/2011/2011GL047563.shtml http://rpmedia.ask.com/ts?u=/wikipedia/commons/7/79/Aerosol_dimming.jpg So which is correct?
    0 0
  5. Dale - Most likely both are. Chinese sulfates aerosol emissions increased 60% over the last decade. And it appears this happens to coincide with an increase in tropical volcanic aerosols reaching the stratosphere. Many of the same authors of that paper also have one out identifying a large Asian aerosol effect in the Tropopause. We've got a series of post coming up on the topic. Disentangling the effect of aerosols from satellite observations is not an easy task.
    0 0
  6. Am I alone here in stating that the temperature increase of the naughts was less than the nineties?
    No, you are not. But you are alone in treating 10-year global temperature trends as if they are statistically significant.
    0 0
  7. Tom, First, yes I did do a Tamino-like analysis going back to 1880, and found the trend lied within the bounds for every period except a brief outlier around 1946. Second, I am not arguing that we are experiencing a general downturn in global temperatures (i.e. return to 1970 levels), but rather that we are not deviating from the long term trend. What we have currently experienced (and may continue) is a return to that trend after the large increase in the 1990s. Some people here like to talk about short-term changes without reference to the long term, and use various statistics which are virtually meaningless. No, Barry, I am not treating 10-year trends as statistically significant, others are. The global temperature measurements have high uncertainties, such that long time frame are necessary to achieve high statistical accuracy. The fallacy is that some people are restricting themselves to these time frames of 15+ years, and assuming that is what is occurring today. It is funny how the group arguing that the temperature increase is accelerating were using short time frames in the 90s, but are now using much longer time frames, while the opposite group, arguing that there has been no temperature increase, was using long time frames a decade ago, but are using short time frames now.
    0 0
    Moderator Response: [Dikran Marsupial] Please provide a verifiable reference to support the contention made in the last paragraph.
  8. Albatross, Regarding Dana's original post, I found it quite lacking. The arguments and data chosen are just as poor as that which he is trying to refute. Read the original Forbes article and the Kaufmann paper. Countering one form of cherry-picking with another will not win many converts.
    0 0
  9. 57, Eric the Red,
    The fallacy is that some people are restricting themselves to these time frames of 15+ years, and assuming that is what is occurring today.
    No, you are standing this on its head. The proper approach is to assume that the trend is continuing, unless sufficient data exists to prove otherwise. The trend was accelerating, so this is assumed to be the case unless a statistically significant downturn (or leveling) occurs. Your argument is orthogonal to this. You argue that because one can't get information from a short trend, one must assume that the trend has stopped until enough data is gathered to prove otherwise. When that day comes you will possibly admit that the trend continued in that period, but then in the new current period there's not enough data so the trend can be assumed to have stopped, and no one can prove otherwise. This approach in turn enables you to, year after year, claim that global warming may have halted, and maybe we should wait a little while to be sure. And that, sadly, is the final, bottom line to every single thread you post on... we don't know, we can't be sure, we better just sit tight and wait and see. It's all much too confusing, and you just want to be sure so you don't make a mistake. By the way, I, like Dikran, demand a citation to prove the outlandish proclamation in your last paragraph.
    0 0
    Moderator Response: ... and the reason for assuming the trend will continue is because of the known physical mechanisms.
  10. ETR#57: "some people are restricting themselves to these time frames of 15+ years, and assuming that is what is occurring today." That's a bizarro-world statement with no apparent basis in this reality. Using a 15+ year time frame to establish an averaging period for a trend is not a 'restriction,' it's a necessary step. For example, look at the familiar graph below: -- accessed July 26, 2011 The red curve is a 5 year running mean; it stops in 2008 (because it needs 2 1/2 years of data on either side). The curve rose above 0 in the mid 1970s and has touched +0.7C; that's a 4 decade slope on the order of 0.17-0.2 degC/decade; if you are saying that 'what is happening today' is the slight 'wiggle' at the end of the red curve -- and if you think the existence of that wiggle proves something about what is happening now -- then you are deeply confused. Look at the rest of the red curve; it wiggles a lot -- because it is based on 5 year averaging! Of course, this has veered off-topic - see the thread Did global warming stop in ____? and you can fill in your choice of year.
    0 0
  11. Muon, It appears my post was lost completely on you, as you are repeating the mistake of others.
    0 0
    Moderator Response: [Dikran Marsupial] This post is unhelpful; if muoncounter has misunderstood you, then explain the misunderstanding (as you see it). Note also that if many appear to be misunderstanding your posts, perhaps the problem lies with the composition of your posts, rather than their comprehension.
  12. Eric, You state, "I am not treating 10-year trends as statistically significant, others are." I wondered if I had misinterpreted you, so I checked. To quote:
    I am not sure exactly what you mean by steeper than linear, but assume that you are implying that the linear trend is increasing. That is simply not occurring, as the greatest increase in the past 40 years was observed in the 1990s, with the smallest occurring in the past decade.
    You are saying the trend of the past decade is less than the previous. In order to say such a thing, these trends must be statistically significant. Yet you have just stated that ten-year trends are not statistically significant.
    Best is to use a long term trend (with good statistics), and then compare the most recent data to that trend.
    In every one of these plots, the increase is significantly less in the past decade, and approaching zero
    Do you see a pattern? You are referring to the last decade's trend as if it's statistically significant. I don't see anyone else making that mistake.
    0 0
  13. Barry, No, I am saying it is statistically significant. Previous posts claimed that the temperature increase was accelerating because the average temperature in the 2000s increased from the average temperature in the 1990s by more than the increase in the previous decade. I was pointing out the fallacy in this analysis in that the greatest increase occurred during the 1990s. I made no mention of statistical significance, nor implication thereof. The last paragraph is a reference to Tamino's analysis. You should probably check his work to understand the issues of statisically significant. The recent trends do not differ significantly from the long term.
    0 0
    Moderator Response: [Dikran Marsupial] The point is Eric, that if you are going to base an argument on a trend, then it must be at least statistically significant for your argument to have any scientific basis. The fact that recent trends do not differ significantly from the long term does not mean that they have not changed from the long term, just that there is insufficient evidence to rule out the possibility that they are the same as the long term.

    If by "I am saying it is statistically significant" you mean decadal trends, then you need to provide the details of the analysis (as Tamino and others have already demonstrated they are not statistically significant).
  14. EtR#61: "you are repeating the mistake of others. " Debatable, but I'll try again. However, I take my response to Did global warming stop in ___?, where it belongs.
    0 0
  15. In my opinion when talking about climate you should be looking at periods of a minimum of 30years.
    0 0
  16. EtR @58, Really, that is the substance of your case and to obfuscate? You have still not replied to the three questions posed to you, so please don't continue to try and take me and others on a wild goose chase by making more unsupported assertions. The one thing that we both agree on is that Pat Michaels is guilty of cherry picking. Addressing those very cherry picks of his does not constitute a cherry pick. You have the logic all wrong. Now can we move on please (unless you are interested in actually answering those three specific questions). As for: "Read the original Forbes article and the Kaufmann paper" A rather peculiar strawman Eric. In fact I have read both, and in fact it was I who (to my knowledge) brought Pat's diatribe to the SkS community's attention on 19 July 2011 after reading Dr. Gleick's refutation. Now instead of engaging in debating tricks, please try and focus on and stick to and learn about the science.
    0 0
  17. Albatross, I thought I answered all three of your questions. About what else were you inquiring? ( -Snip- ).
    0 0
    Response:

    [DB] Argumentative & inflammatory snipped.

  18. Eric, could you describe what you understand statistical significance to be? It might clear the confusion.
    0 0
  19. Barry, Statistical significance is understood to be the 95% confidence level. This commonly applies to standard deviations, t-tests, etc.
    0 0
  20. Out of curiosity, is Eric the Red arguing anything on this comment thread that he hasn't previously argued on the threads to other SkS articles?
    0 0
    Response:

    [DB] Not AFAIK.

  21. I'm a bit confused as to how I'm supposed to have cherrypicked anything. I showed the hemispheric trends in GISTEMP to illustrate that they're different from HadCRUT, and because they had the most easily-available hemispheric temperature data. Since when is it cherrypicking to criticize cherrypicking? I should also note that probably half of the post was about aerosols, which I don't think anybody has mentioned in the comments yet! Fortunately Rob P is working on a post devoted exclusively to aerosols, so hopefully we can get an interesting discussion the subject there without being bogged down in statistically insignificant cherrypicking silliness.
    0 0
  22. Dana, You criticized Michaels for cherrypicking his datasets (CRU) and time frames (1996-), then you did the same thing (GISS and 1998-). There is enough scientific data to not argue on a similar level. Aerosols are a much bigger question, which needs to be answered. Michaels was referring to sulfate uncertainty, not sulfate effect. This was probably intentional on his part, and meant to confuse. The geographic dispersion of aerosols may very well be as Michaels claims. The atmospheric interaction between the hemispheres is limited. More work is needed to ascertain the temperature effect.
    0 0
  23. Eric the Red - Dana simply used available data to look at Michaels' claims in the context with which they were made. In my opinion (your mileage may vary) it's a decent article. "More work is needed to ascertain the temperature effect." (aerosols) Correct, although statements like this are often presented when someone wishes to use uncertainties to claim that we don't know well enough (or, alternatively, anything) to act upon. Michaels' statements about aerosols and their effects are really quite distorted - I would classify them as advocacy statements (from a PR person) driven by the desire to present a particular point of view on policy, not objective statements about the science. And hence Dana is quite right to show that even when Michaels cherrypicks recent data, he's still wrong - even with that small of a data set.
    0 0
  24. EtR @72, "You criticized Michaels for cherrypicking his datasets (CRU) and time frames (1996-), then you did the same thing (GISS and 1998-)." You are very confused, and wrong. Dana showed the GISTEMP data for the same period as the HadCRUT data 1998-2010. Had you read Pat's piece, is seems that you have not (or at least not properly) you will have noticed that Pat refers two different time frames in order to fabricate his deception: monthly HadCRUT data from November 1996 through 2010; and annual HadCRUT data from 1998-2010. Dana made it very clear that the GISTEMP data show a different story to the HadCRUT data with reference to Pat's cherry-picked 1998-2010 window. Unlike Pat, Dana showed data going back to 1975, not just for the cherry-picked 1998-2010 window. To achieve his deception Pat had to 1) Cherry-pick the data set, 2) Cherry pick the time frame. Disingenuous and deceptive at best. I could say more but doing that would violate the comments policy. Pat can play this game of cherry picking ad infinitum all the while the long-term and statistically significant temperature trend is UP. KR is correct, most "skeptical" scientists (e.g., Lindzen, Spencer and Michaels), are interested in advocacy, not the advancement of science.
    0 0
  25. Badgersouth @70, no!
    0 0
  26. If Eric the Red is just regurtitating stuff that he has previously posted on other threads, why indulge him on this thread? SkS is not obliged to provide a forum for repeat performances.
    0 0
  27. So Eric, you think the trend of each of the past two decades is statistically significant at the 95% confidence level? How did you work that out?
    0 0
  28. Albatross @74 clarified nicely. I didn't choose 1998 as a starting point - Michaels did because Kaufmann did. I chose GISTEMP simply to illustrate that not all data sets agree on hemispheric trends - it was a contrasting example with easily accessible data. And as Albatross noted, I also showed the data since 1975, unlike Michaels, to show how the hemispheric trends have changed (I didn't plot the Hadley data for this period, but I did discuss it). I'm forced to conclude Eric's cherrypicking accusation is based on the fact that he didn't read the post very carefully.
    0 0
  29. Dana I didn't choose 1998 as a starting point - Michaels did because Kaufmann did. To be fair, Kaufmann chose it because "skeptics" like Michaels did!
    0 0
  30. Since this is a post on the subject of Forbes magazine, I don't feel too bad bringing up another Forbes article on the subject of global warming (my link is to astronomer Phil Plait's blog Bad Astronomy). The author is using Spencer & Braswell 2011 to support his claim. Unfortunately, Phil doesn't link to an article or blog post specifically critiquing flaws in Spencer & Braswell's paper. Having done a search on Skeptical Science using the phrase 'spencer 2011' I do not think any such rebuttal has occured here. Anyone familiar with the reaction to Spencer & Braswell 2011? Will there perhaps be a Skeptical Science post on the paper?
    0 0
  31. 80, Composer99, It was only just published days ago, so I'm sure it will take a while for even serious blog criticisms, let alone rebuttals, although except for reputation and past performance, there's no reason on the surface to believe what the paper says is entirely wrong. I'm only just reading it right now, but an early assessment based on the conclusions, from a purely amateur point of view, is that I don't believe these findings in any way affect climate sensitivity. They may affect the rate of warming due to the rise in CO2, and so arriving at the final temperature setting for the level of CO2 we pump into the atmosphere may take longer. That would, in fact, be somewhat in keeping with what we are observing. It would also be dangerous, because it could lead to a false sense of security that climate sensitivity is low. That would cause us to burn more fossil fuels, and raise CO2 levels even higher, when that end result could be totally untenable for the poor souls that have to live in those conditions long after we're gone. And they'll have to find a way to combat those conditions without any fossil fuels as even a minor factor in the battle, because by then they'll be all gone, or the atmosphere will be so badly polluted with CO2 that they won't dare to add a single additional ppm. But simply because the planet is able to shed heat more quickly, to me, does not imply low climate sensitivity, but rather only a slower rate of warming. The final temperature will be the same. So while the paper's results may be correct, I'm not entirely sure that the conclusions they make properly follow those observations. But, as I said, I haven't yet read the full paper, and I don't think the people who are truly qualified to do so will be able to get to it for some time yet.
    0 0
  32. 80, Composer99, A quick google search did find this: No, new data does not “blow a gaping hole in global warming alarmism”
    0 0
  33. 80, Composer99, RealClimage did just yesterday do something with this here. And the blog post I just linked to also has this analysis.
    0 0
  34. 80, Composer99, An oft repeated quote in the blog entries I've found (I'll trust Trenberth over Spencer any day of the week, year, decade or century):
    "I cannot believe it got published," said Kevin Trenberth, a senior scientist at the National Center for Atmospheric Research.
    0 0
  35. Thanks, Sphaerica.
    0 0
  36. 85, Composer99, The RC post is pretty specific, and pretty scathing. They apparently agree with my assessment that their conclusions about climate sensitivity are invalid, and also find numerous flaws in the methodology, and do a pretty darn good job of backing up that claim. What's their bottom line?
    The bottom line is that there is NO merit whatsoever in this paper. It turns out that Spencer and Braswell have an almost perfect title for their paper: “the misdiagnosis of surface temperature feedbacks from variations in the Earth’s Radiant Energy Balance” (leaving out the “On”).
    0 0
  37. 85, Composer99, A quick summary of RC's key points:
    • Not all satellite datasets give the same extreme result... they chose the one that makes their claim look best
    • The paper lacks the supporting statistical information to make it credible
    • The paper lacks the information to make it repeatable
    • Those two items alone demonstrate very shoddy peer review
    • The journal it was published in is in no way a credible climate science or atmospheric physics journal
    • RC's own similar analysis shows different results (and these are clearly provided by them)
    • The overly simplistic model is one that Spencer has used before and has already been proven to be grossly flawed and easily manipulated to produce any desired result, and so is wholly improper in its use in this context
    • Like Lindzen before them, in order to use such a small time frame, Spencer uses ENSO warming as a proxy for climate change without accounting for the fact that ENSO is very different from actual climate change, and is not a forcing itself
    • Their conclusions about climate sensitivity are incorrect and unsupportable
    0 0
  38. Thanks again, Sphaerica @87; I've linked to your summary at the Bad Astronomy thread.
    0 0
  39. We'll be re-posting the RealClimate article by Trenberth and Fasullo in the near future.
    0 0
  40. also Sphaerica, I'm trying to simplify their post into a Basic rebuttal, and I'm going to make use of your bullet points in comment #87, if you don't mind. Thanks!
    0 0

Prev  1  2  

You need to be logged in to post a comment. Login via the left margin or if you're new, register here.


The Consensus Project Website

THE ESCALATOR

(free to republish)


© Copyright 2024 John Cook
Home | Translations | About Us | Privacy | Contact Us