Climate Science Glossary

Term Lookup

Enter a term in the search box to find its definition.

Settings

Use the controls in the far right panel to increase or decrease the number of terms automatically displayed (or to completely turn that feature off).

Term Lookup

Settings


All IPCC definitions taken from Climate Change 2007: The Physical Science Basis. Working Group I Contribution to the Fourth Assessment Report of the Intergovernmental Panel on Climate Change, Annex I, Glossary, pp. 941-954. Cambridge University Press.

Home Arguments Software Resources Comments The Consensus Project Translations About Support

Twitter Facebook YouTube Mastodon MeWe

RSS Posts RSS Comments Email Subscribe


Climate's changed before
It's the sun
It's not bad
There is no consensus
It's cooling
Models are unreliable
Temp record is unreliable
Animals and plants can adapt
It hasn't warmed since 1998
Antarctica is gaining ice
View All Arguments...


Username
Password
New? Register here
Forgot your password?

Latest Posts

Archives

Breaking News…The Earth Is Warming…Still!

Posted on 17 February 2012 by Glenn Tamblyn

In my under-graduate days, studying engineering some years ago (quite a few actually but the less said about that the better), one idea was drummed into us again and again. If you want to study any sort of system you absolutely need to define your ‘system boundaries’ correctly. What are the boundaries of the thing you are studying? Get this right and your analysis may be solid. Get it wrong and your analysis will be rubbish.

Bounding Around

So when we think about Global Warming we need to be really certain that our ‘system boundaries’ are right. So what is the theory of Global Warming, in a nutshell? And what does this tell us about where we need to set our boundaries. Put at its simplest, Global Warming says that more GH Gases will cause an imbalance between the amount of energy the Earth receives from the Sun, and the energy it looses to Space. More of the GH gases make it harder for the Earth to loose energy to space, so heat starts to build-up here. And this heat build up can lead to higher temperatures.

So what does this tell us about what needs to be inside our ‘system boundary’?

Our system boundary needs to include anywhere where this extra heat can accumulate! To understand Global Warming we need to look at all the places where heat can go and account for all of them.

And this is what the scientists have done. This graph, taken from the IPCC’s 2007 report shows the estimates of how much heat has been added to different parts of the environment – melting ice, warming the land, air and oceans between 1961-2003 and 1993 - 2003.

Heating since 1961

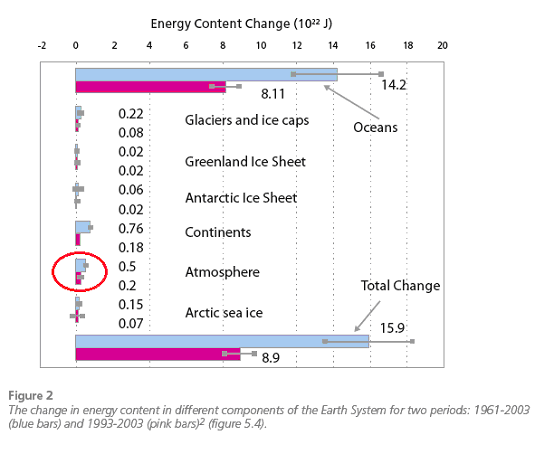
I have highlighted the atmosphere part for a very simple reason. This is what most of us think of when we talk about ‘Global Warming’; that it is changes in the air temperature!

Yet look at the graph; warming of the atmosphere really is small potatoes! The main game in Global Warming is what happens in the Oceans. Around 90% of the heat added since 1961 has happened there. In contrast warming of the atmosphere is only around 3% of the heat.

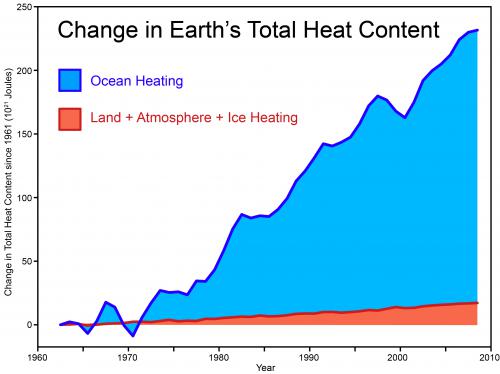
Here is a different way of looking at the same thing with data from Church et al 2011

Church et al Heating

So if we were to set our ‘system boundary’ incorrectly and just looked at the atmosphere, we would be looking at only a very small part of the system and could easily reach a poor conclusion. Like trying to understand the Dog by just looking at its Tail!

Pin the Tail on the …

So what has been happening in the oceans? How do we measure the data needed to produce these graphs? To understand this we need to measure temperatures down through the depths of the ocean at many points. Then by observing how these measurements change and knowing the thermal properties of sea water, its Specific Heat, we can start to calculate heat accumulation.

First a little bit of history. The very first measurements of deep ocean temperatures were performed with instruments lowered from a ship down into the ocean. This method is still used today for detailed studies and for looking at what is happening all the way to the sea bottom. But this method has a big disadvantage. A research ship is needed that can stop, lower a sensor platform over the side from a crane, and sample all the way down. This might take several hours to take measurements at one location. Then it moves on to another location. It is very slow and very expensive and doesn't actually cover much area.

 In the 1960’s a better idea was developed. The Expendable Bathythermograph  or XBT. A fairly simple, expendable device that could be dropped over the side of a ship while it was underway and report basic data as it sank. Then it just fell to the sea floor. And this didn’t just have to be done from research ships. Any commercial vessel could do it. So now there was a tool for gathering ocean temperature data cheaply from around the world. But it was limited to reporting the top 700 metres of the ocean.

Then through the 2000’s, a consortium of many nations began deploying a smarter answer; the Argo Float Array. This is a series of several thousand free floating ‘smart’ buoys that drift with the currents around the world’s oceans.

Argo Float Array DistributionAn ARGO Float


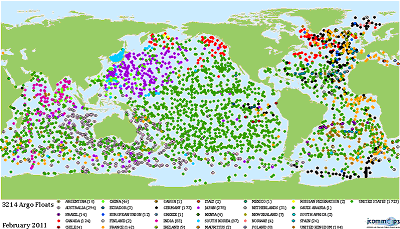
These buoys are able to auto-dive down to 2000 metres, measuring as they go, then surface and report their data, and their location via GPS, to satellites that collect the information. Now we have a more sophisticated measuring system for the world’s oceans. So what does all this data show us?

As the figure above suggests, most of the heat has gone into the oceans. But for the last decade or so Mother Nature has been playing some tricks!

Compare these two graphs which are from the National Oceanographic Data Centre (NODC) which also provides a range of other graphs looking at different aspects of sea level rise.

Ocean Heat to 700 metres


Ocean Heat to 2000 metres

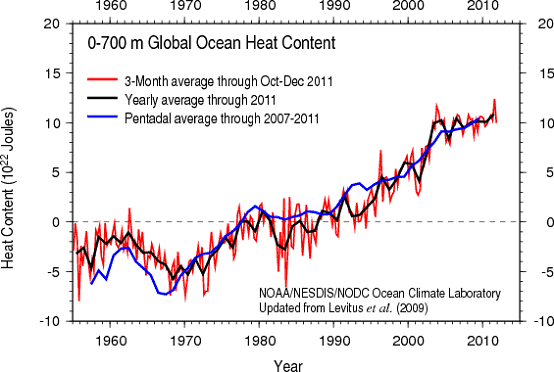
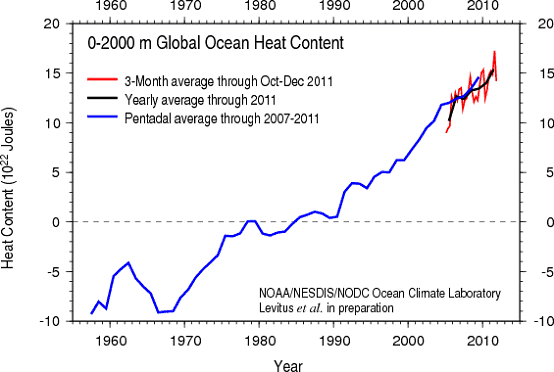
The upper graph shows data from the top 700 metres of the ocean. This is a combination of XBT data going back to the 1960’s and ARGO data. The second graph is showing data all the way down to 2000 metres. How can we have data to 2000 metres for those past decades when ARGO only began operation in the 2000’s? By combining data from 0-700 metres from the XBT’s, with deep data from the ‘lower a sensor over the side’ type measurement programs an estimate can be made of what was happening down deeper. But during the 2000’s we have live data from both depth ranges.

And the picture is rather strange!  Up until the early 2000’s, the two trends are broadly similar. The top layer grew by about 1.7 x 10²³ joules while the entire 0-2000 range warmed by about 2.1 x 10²³ joules. The top layer contained about 80% of the added heat.

But for the last decade or so the top layer has nearly flat lined while the full range has continued warming. Since 2004 there is around 0.5 x 10²³ joules in the full depth that isn’t in the top layer! It must be down deeper, between 700 & 2000 metres. What is Mother Nature up to? How can the deeper water be warming if the upper layer isn’t?

We pause briefly…

Here both Climate Models and Oceanography can come to our rescue. In a paper published last year Meehl et al (2011) looked at what a range of different climate models predict might happen in the future. And one rather surprising result they found were ‘Hiatus periods’. Periods of a decade or so where air temperatures - that 3% part that we live in - seem to plateau. But it is what the various models show is happening in the oceans during these periods that is really interesting.

'Hiatus' vs Normal Ocean warming

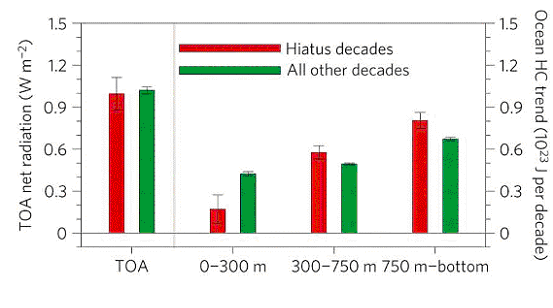
During ‘normal’ periods, more heat goes into the upper part of the oceans and less into the lower depths. But during the ‘Hiatus’ periods, the top of the ocean doesn’t accumulate nearly as much heat whereas the next lower levels accumulate more. Exactly what the current ocean data is telling us!

But why? How can heat reach these greater depths without also heating the top layer?

It’s all about circulation patterns in the ocean. The major circulation patterns are about large surface and bottom currents. Connecting these are regions of major up-welling and down-welling – locations where significant exchanges occur between the surface and the abyssal deeps. But these abyssal deeps aren’t at 2000 metres – more like 5,000 to 8,000 metres.

However, there are also regions in the open ocean with smaller scale vertical-mixing currents that combine the very surface layer with the next level down.

Here for example is the climate model simulation of the mixing currents that overturn the upper layers of the ocean across the Pacific.

Pacific Upper levels circulation


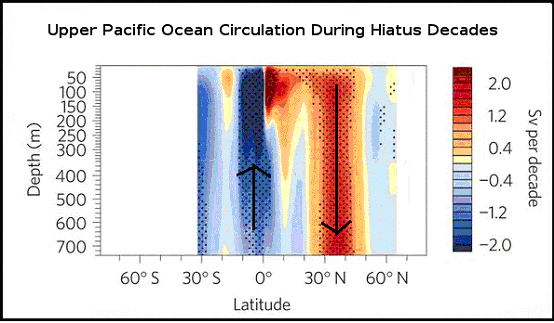
So all that Mother Nature has to do is crank these upper ocean circulation patterns up a notch for a period and heat is drawn down from the surface to the next level, to be replaced with colder water from below.

So lets consider what such a pattern will do to the Earth’s climate patterns while it lasts.  The next lower level of the ocean will warm because warm water is being pumped down from above. The surface of the ocean won’t warm as much, if at all, because its heat is continually being pumped lower to be replaced by colder water. And because the ocean surface doesn’t warm very much during this period, the atmosphere doesn’t warm as much either. So from our rather limited perspective here on the surface it looks like warming has stopped. When in fact it is simply going on somewhere else. The Dog may have temporarily stopped wagging its Tail but the Dog is still trotting along.

And the models predict that these Hiatus periods last for a decade or so. Then the ocean heat patterns revert to their ‘normal’ structure. And the top layer of the ocean resumes normal heating. And then the Atmosphere resumes heating! So the Dog will resume wagging its Tail soon. It’s a Dog, it can’t help doing that.

So when you hear or read anywhere or are told by anyone that ‘warming stopped in (insert preferred date)’ the simple, observed fact is that it hasn’t stopped warming!  It’s just that much of the warming has been happening somewhere else recently.

So anyone who says otherwise is simply falling into the most basic trap that any under-graduate engineer or scientist is taught to avoid. Not using the correct system boundary! And if the person saying this is a professional scientist or engineer what conclusion can we draw from their opinion? That they are incompetent? Or…? 

The Smoking Gun

When the first studies of the XBT data were produced in then early 2000’s, showing just how much heat had been added to the oceans, the climate science community labelled this ‘The Smoking Gun’. They knew that increased Greenhouse Gases had to be causing a heat accumulation – the understanding of the physics of this is very solid. But they knew also that the Surface Temperature records that had been compiled to date only showed where a small percentage of the extra heat was going. The surface was warming much as the climate modelling predicted but until they could begin to confirm what was happening in the oceans, they didn’t have enough of the pieces of the jigsaw puzzle. They knew how to draw their system boundaries. 

The appearance of the first studies on Ocean Heat Content during the 2000’s would have been one of the significant factors in the IPCC increasing its level of confidence that AGW was real in its 4th report in 2007.

Because the pattern of where the heat is going says something very important about what is causing it. It is sometimes argued that the global warming we are observing is due to internal variability, a recovery from the Little Ice Age  etc. These suggestions are always based on just the surface temperature record. For these ideas to be reasonable, heat has to come from some other part of the climate system in order to warm the atmosphere. If every other part of the climate system is also warming at the same time then this cannot be ‘internal variability’. And if the total heat in the system is accumulating this can’t be due to a ‘recovery’ from the Little Ice Age. This must be new heat being added today.

But the absolute clincher is that the amount of heat going into the oceans is so great that no other source of heat here on Earth could supply it. The first two graphs at the start of this post are absolute proof that something is disturbing the Earth’s external energy balance. And since we know that the Sun’s energy output has, if anything, been declining slightly over the last ½ century the only remaining possibility is something affecting the Earth’s ability to release heat to space. There are three candidates.

So both through many lines of evidence, and also by applying some basic engineering understanding, the idea that increased GH gases are the primary cause of the warming the Earth has seen in the last ½ century or so seems very solid. No other explanation fits the evidence.

It seems my old Professors were right; its simple really when you get your system boundaries right. Watch the Dog, not just its Tail!

So when someone tells you that warming has stopped they are simply wrong.  Probably spending too much time just looking at the Dog's Tail.

0 0

Printable Version  |  Link to this page

Comments

Prev  1  2  

Comments 51 to 83 out of 83:

  1. skept.fr - My apologies, there is a terminology issue involved. When you said "dissipation", I interpreted that as heat energy leaving the climate system. The D'Araso paper you reference is speaking of dissipation in terms of energy shifts between various scales, from mass movements of the ocean currents to centimeter level turbulence (~9 orders of magnitude). Note from the D'Araso paper that wind is the primary energy input for mixing, upwelling and downwelling: "Although the basic characteristics of ocean circulation have been well known for many decades, a detailed understanding of its energetics has emerged only recently. The energy sources are well understood: Wind stress acting on surface currents (or “wind-work”), particularly in the Southern Ocean, is the dominant energy source, with little net input from heating/cooling or precipitation/evaporation. " D'Araso is primarily discussing how that energy of circulation moves from large-scale (10-100km) ocean movement into small-scale turbulence, the fluid dynamics of turbulence generation. One reason it's an interesting question is that a first-pass naive look at the dynamics seems to indicate that large scale kinetic movements are self-stabilizing, whereas as observed large scale movements cascade down into small scale turbulence - and that's the process D'Araso is exploring. This has implications in mixing ratios and heat distribution, which should be helpful for improving ocean circulation and energy distribution models.
    0 0
  2. #51 KR : Apologies are mine, I was all but clear in my expression. Thank you for your explanation about D'Araso paper. For a non-physicist, theses questions of energy may seem simple at first glance, but become very complex when you try to deepen your understanding.
    0 0
  3. @Ken Lambert You are considering the period from 2005 to 2011. And you only consider GHG forcing. However, the Sun has been exceptionally quiet over most of this short period. TSI has been lower than it had been during the two previous minima of the 11 year cycle for all but the last year (2011) of this whole period. This is more than enough to cancel out the enhanced greenhouse effect gained from 2005 to 2011. The variation in solar forcing from minimum to maximum of a 11 year cycle is typically about 1 W/m^2. So, most of the ocean warming that was nevertheless measured consists in warming that was already in the pipeline, as it were. We were not yet equilibrated to the previous enhanced greenhouse effect caused by the CO2 emitted in the previous couple decades. The thermal state of the troposhere+oceans is transient. It responds belatedly to the current total forcing, not only instantaneously to the most recent variation. This is why the recent variation in Solar influx has an effect that combines with (and has clearly been dominated by) the longer term increase in GHG forcing. (I also didn't consider possible variations in aerosol forcing that contribute to the overall radiative balance.)
    0 0
  4. Ken Lambert @49 The figures I would use are the annual data rather than the Pentadal data since the earlier years are estimates from XBT. So my eyeball gives me roughly 5 * 10^22 over 5 years. Translating this to a TOA imbalance, this is 5*10^22/(5*365.25*24*60*60*510000000000000*0.7) = 0.88 w/m^2 As for what I am claiming for "What are you claiming is the OHC increase measured from 2000m to the bottom? ", I am not claiming anything. The purpose of this post is to refute the 'warming has stoped since (insert date here) meme. I am not addressing anything like the missing heat meme. Maybe heat is missing, maybe it isn't. But warming is still happpening.
    0 0
  5. Glenn #54 5E22 over 5 years is 1E22 or 100E20 Joules average per year. 0.9W/sq.m is 145E20 Joules per year globally; so your 100E20 equates to 0.62W/sq.m. Where did you get the 0.7? Are you relating calculating your 0.88W/sq.m for the 70% of the Earth's surface which is ocean? If so this equates to 0.88 x 0.7 = 0.62W/sq.m globally as I have calculated above.
    0 0
  6. PN #53 "The variation in solar forcing from minimum to maximum of a 11 year cycle is typically about 1 W/m^2." "This is more than enough to cancel out the enhanced greenhouse effect gained from 2005 to 2011" I don't think so. Your 1W/sq.m is the variation on a TSI of about 1366W/sq.m. You have to divide that by 4 for the sphere/circle geometry to get the average over the Earth's surface. This reduces (also by a factor of 4) the Solar ripple to 0.25W/sq.m peak to trough or +/-0.13W/sq.m. for an Incoming Solar radiation of about 342W/sq.m. I am considering the warming imbalance at TOA - from all effects - GHG, Solar, Aerosols climate responses and feedbacks. There is no 'warming in the pipeline' in energy terms. All the heat energy absorbed in the past to date is reflected somewhere in the Earth system as a temperature rise or phase change (evaporation, ice melt etc). There might be temperature rise in some part of the system and due to thermal lag - but without future energy gain - there would be temperature decline in some other part of the system. So future warming requires future imbalance.
    0 0
  7. Ken Lambert - "There is no 'warming in the pipeline' in energy terms." That is not the case. As long as there is an energy imbalance at the TOA, as long as the oceans in particular are in thermal disequilibrium, there is "warming in the pipeline", or as I prefer to term it, unrealized warming. This is only made worse by the increasing greenhouse gas forcings we are putting out. To quote Galileo, Eppur si muove. When the energy content of the climate stops moving, attains long term averaged equilibrium at the top of the atmosphere, then we can state that there is no longer "warming in the pipeline". Not before.
    0 0
  8. Sorry, Ken Lambert. You are right. I had thought the 1W/m^2 variation in TSI that I had found was TOA. This is indeed rather close to 0.25W/m^2. You say that you are considering the warming imbalance from all effects. But is the modelled 0.9 to 1 W/m^2 that you mentioned based retrospectively on the true (estimated) forcings or was it produced by the models as an ensemble average?
    0 0
  9. "So future warming requires future imbalance." That's certainly true. However it takes time to restore any new imbalance (unless the variation is so slow that the state never is transient). It takes time for oceans to warm. So, if there is a variation in the absolute values of the forcing between some time t1 and a later time t2, the resulting imbalance (that will need to be restored from t1 onward) is F(t2) - F(t1) + I, where F(t) is the total forcing at t, and 'I' is the previous imbalance caused by past variations in forcing that had not yet been fully restored at t1.
    0 0
  10. KR "As long as there is an energy imbalance at the TOA, as long as the oceans in particular are in thermal disequilibrium, there is "warming in the pipeline", or as I prefer to term it, unrealized warming." In thermal disequilibrium with what? The ocean heat content is a finite quantity at any point in time. Temperature might be in disequilibrium - but that is probably always the case.
    0 0
  11. PN #58 "You say that you are considering the warming imbalance from all effects. But is the modelled 0.9 to 1 W/m^2 that you mentioned based retrospectively on the true (estimated) forcings or was it produced by the models as an ensemble average?" A good question. Fig 2.4 of AR4 plus climate responses is the answer. Ref Trenberth 2009 - "Tracking the Earth's Energy...." Probably a bit of both your options.
    0 0
  12. Ken Lambert - If the oceans are not warm enough for the TOA imbalance to be canceled, then there is disequilibrium, and future warming in the pipeline. As long as there is a TOA imbalance, and the thermal inertial of the climate has not caught up to it, there is still warming that will occur. I have to consider your post to be semantic gaming of this point.
    0 0
  13. KR #62 Not semantic gaming KR - correct understanding of the relationship between energy (heat) gain and temperature rise. Future heat gain is from future imbalance. If the imbalance zeroed tomorrow the energy absorbed to then would appear in the system somewhere. Global temperature rise would also stop tomorrow. Regional and media temperatures may rise as heat is redistributed through the system, but this will be matched by falls elsewhere.
    0 0
  14. Ken, your 'correct' understanding would seem to require that ice not melt when subjected to temperatures above freezing, but only when subjected to continually increasing temperatures. As that isn't how ice actually behaves I must question your assertion that this is "correct".
    0 0
  15. Ken Lambert - "Future heat gain is from future imbalance." That is a misstatement of the physics. Future heat gain is also coming from current imbalance, as the thermal inertia of the climate has not caught up to the moving target of imbalance. If GHG increases were to stop right now, we would still have decades of transient climate response, with potentially a few hundred years to equilibrium climate response - the slower feedbacks of cryosphere and vegetation. Yes, if the TOA imbalance were suddenly and miraculously zeroed (with leprechauns?), then warming would end. If you have some method of doing that, please, let everyone know!
    0 0
  16. CBD #64 KR #65 Ice melt and evaporation (phase changes) will absorb some of the heat at constant temperature - just as freezing and condensation will give up heat at constant temperature. KR Yes transient *temperature* response - not energy gain.
    0 0
  17. KR #65 Loeb says the imbalance is between 0.07 and 0.93W/sq.m so it could be zero now at the lower confidence limit. Add a few more of Hansen's aerosols and you won't need leprechauns.
    0 0
  18. So Ken, are you willing to bet on such odds? If so, I have a few other propositions to make to you.
    0 0
  19. Ken Lambert - "Yes transient *temperature* response - not energy gain." I have to find your last post, um, *stunning* in it's failure of physics. As long as there is an imbalance at the TOA, there will be ongoing energy change. Phase changes absorb a good bit of energy, but do not change ambient temperature - hence they go nowhere in terms of redressing the TOA imbalance while the energy accumulates. Temperature rises are themselves energy changes - and the only thing that can redress the TOA imbalance. There are no phase changes, no temperature changes, without energy changes. I strongly suggest you read up on your physics - what you have just posted pushes the "not even wrong" envelope.
    0 0
  20. #66 "Ice melt and evaporation (phase changes) will absorb some of the heat at constant temperature..." You're funny, Ken! While still not getting around the difference between heat absorbed by the system and overall energy balance, you mention ice melt as if that will stop temperatures rising. It might... in places where there is ice. Did you notice that nearly all the world's glaciers are in retreat (WGMS), Arctic sea ice is declining (as is global sea ice). This is some of that phase change at constant temperature, you mention. Except that this phase change means the glaciers and ice sheets end up at a lower elevation, or uncover dark land or water, all of which leads to more melting and warmer temperatures! Thanks for clearing that up. /sarc
    0 0
  21. KR #69 We are discussing the cessation of any TOA imbalance (see #63 where this started) - "Yes transient *temperature* response - not energy gain." Without an imbalance - existing heat will flow around the system creating temperature and phase changes - but *not* a global temperature increase or decrease in the Earth system. "There are no phase changes, no temperature changes, without energy changes." Quite right - the issue is whether or not there are global increases or decreases - not 'changes' shunting around existing heat energy within the Earth system.
    0 0
  22. Ken, I'm trying to follow your logic and just can't see how you get from A to B; "If the imbalance zeroed tomorrow the energy absorbed to then would appear in the system somewhere. Global temperature rise would also stop tomorrow." If the energy absorbed remains then it is gradually going to get spread around the system... which means that it will result in a net loss of ice (i.e. "ice melt... will absorb some of the heat")... which means that the planet's albedo will change... which means that there will be an additional ongoing forcing... which means that global temperature rise will not "stop tomorrow". The only way for that to happen would be for your hypothetical magical pixie dust solution to eliminate the ongoing energy imbalance and extract sufficient energy such that global ice cover (and other long term feedbacks) would remain constant rather than continue responding to the energy built up in the system. All of which is rather moot given the general lack of magical pixie dust of a non-hypothetical variety.
    0 0
  23. A layman question (from recent posts 63-72) : when a volume of ice melt (typically arctic sea-ice), it consumes energy but the phase transition from solid to liquid also changes the radiative property of the surface, with far less albedo in the new state of the system. How do you count (in energy balance from state S0 with ice to state S1 without ice) this radiative effect, quite different from sensible/latent heat distribution?
    0 0
  24. CBD #72 Reduction in albedo due to ice loss is probably not a good example. 90% of the planet's ice is in Antarctica. Losing mass does not directly relate to losing surface area if thickness changes but not disappears. Albedo is not just ice or snow reflection - clouds and aerosols are a big part. What we always hear about is summer Arctic sea ice melt, but never winter regain - nor the lower latitude white outs such as has happened in recent years across Eurpoe and North America where Albedo is enhanced for several weeks over larger areas than the Arctic. The Arctic above 66N is less than 7% of the planet's surface.
    0 0
  25. So... your answer is nonsense and obfuscation? Got it. For the record, the "winter regain" of arctic sea ice also shows an ongoing decline. Not that this is particularly relevant given the general lack of sunlight (and thus comparative importance of albedo) in the Arctic in Winter.
    0 0
  26. Ken Lambert - CBDunkerson is quite correct here: even if the TOA imbalance were zeroed tomorrow, the time lag of various feedbacks such as ice, vegetative albedo, etc., will cause temperature to increase from present levels. I stand corrected on that. This is because the climate has not yet caught up with the current imbalance. Best estimates for the TOA imbalance are around 0.5 W/m^2, with a fairly strong likelyhood that it's only that low due to high aerosol levels (which won't last). If you know any magical leprechauns who can zero that, please call them in. Otherwise we will have to deal with the situation as it actually stands - and work on reducing GHG emissions to mitigate ongoing climate change.
    0 0
  27. KR wrote: "If you know any magical leprechauns who can zero that..." Hmmm, it looks like I was in error here. I incorrectly cited pixies, not leprechauns. I apologize for any confusion this may have caused.
    0 0
  28. CBDunkerson - You have to be very careful about the pixie/leprechaun distinction: you can get in real trouble over that at the annual Mythic World Cup. The fans take such things quite seriously...
    0 0
  29. Re: winter regain. The relevant question really is what does climate theory predict for ice cover and what is the observations? Do we expect rapid decline in sea ice are in winter with rising GHG gases? No. Do we expect summer ice decline? yes.
    0 0
  30. KR & CBD All sea ice decline is small in absorbed energy terms. From memory, sea ice melt is 1-2E20 Joules/year in a Trenberth imbalance of 145E20 Joules/year (0.9W/sq.m). scaddenp #79 "Do we expect rapid decline in sea ice are in winter with rising GHG gases? No. Do we expect summer ice decline? yes." If sea ice largely recovers in winter - then the energy absorbed in a bigger summer ice melt is largely being lost to space. This indicates that more energy is being pumped through the Arctic in a larger amplitude summer/winter cycle. It is still small in energy terms - 2 or 3% of the claimed warming imbalance.
    0 0
  31. Ken Lambert - I would agree with you that ice melt is only a few percent of climate energy changes. Which is why I found your invocation of it here, in an apparent claim (as I interpreted it) that "warming in the pipeline" won't happen due to ice melt energy absorption (contrary to the OP, an this post in particular), to be, well, quite puzzling.
    0 0
  32. KR #81 I said 'some' of the heat would go to ice melt at #66. That 'some' is small.
    0 0
    Response:

    [DB] Rather than continuing with playing semantical games, please try supporting assertions with quantifications and references to peer-reviewed articles appearing in reputable journals that support your position.

  33. Ken L#80: "If sea ice largely recovers in winter - then the energy absorbed in a bigger summer ice melt is largely being lost to space." Winter sea ice extent is not recovering quite so completely. But you are correct about the increasing amplitude of the annual freeze-thaw cycle. --source The cycle has a very clear long term trend, so it is obvious it does not average around 0 from year to year. In addition, high latitudes consistently warm faster than mid-latitudes. -- source This combination of amplification in ice melt cycle and warming should indicate that not all this energy is lost to space.
    0 0

Prev  1  2  

You need to be logged in to post a comment. Login via the left margin or if you're new, register here.


The Consensus Project Website

THE ESCALATOR

(free to republish)


© Copyright 2024 John Cook
Home | Translations | About Us | Privacy | Contact Us