


 Arguments


Pielke Sr. and SkS Disagreements and Open Questions
Posted on 1 October 2011 by dana1981
Dr. Roger Pielke Sr. has responded to our last set of questions and answers, and we would like to thank him for a civil discourse to this point. Unfortunately, in the meantime Dr. Pielke has taken offense to some challenging, but relatively benign comments (although we think he got in a few licks himself), and decided that his interaction with SkS was over.
To sum up the discussion, there are some points on which we agree, others on which we disagree, and a few others which require further clarification. We will summarize the disagreements and open questions in the text below, based on our understanding of Dr. Pielke's comments. Readers are invited to read Dr. Pielke's comments to verify that we are accurately representing them in this summary.
CO2 Contribution to Global Warming
In response to our question regarding what fraction of the observed global warming is due to CO2 and other anthropogenic effects, Dr. Pielke responded:
"~26% of the positive radiative forcing was from CO2"
This is not a complete answer, but the question is a complex one. However, we believe Dr. Pielke has underestimated the CO2 contribution. Figure 1 shows the radiative forcing estimates in the 2007 IPCC report.
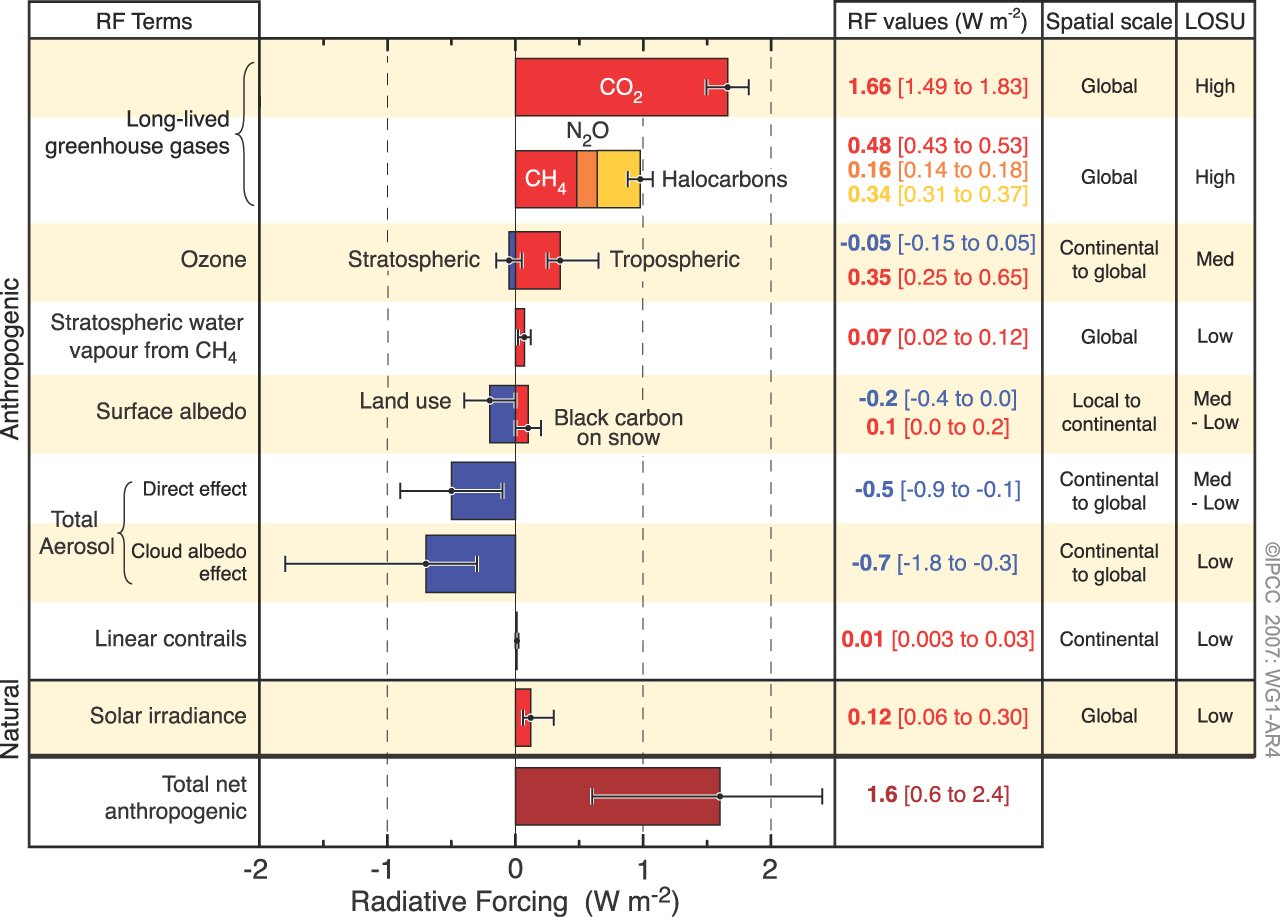
Figure 1: Global average radiative forcing in 2005 (best estimates and 5 to 95% uncertainty ranges) with respect to 1750. Source (IPCC AR4).
The radiative forcing from CO2 is well-known, and estimated at 1.66 Watts per square meter (W/m2). The remainder of the positive radiative forcings add up to 1.63 W/m2. Therefore, CO2 accounts for approximately 50% of the positive radiative forcing - twice Dr. Pielke's estimate. Dr. Pielke references research which has suggested that, for example, methane plays a larger role than the IPCC estimate. However, the radiative forcing from methane (which is well-known) is based on its atmospheric concentration, which is also well-known. Dr. Pielke also clarified his opinion that soot (black carbon) might account for a larger positive radiative forcing than CO2. However, aerosols have both warming and cooling effects, with the cooling effects likely being larger in magnitude (Ramanathan and Carmichael 2008).
Answering the SkS Question
Our view of this question is that if we use the current CO2 forcing and a transient climate response of approximately 2°C for doubled atmospheric CO2 (IPCC AR4 best estimate), the atmospheric CO2 increase over the past century has caused approximately 0.9°C warming of the average global surface temperature (best estimate). This best estimate is more than 100% of the observed surface warming (0.8°C), meaning that all other non-CO2 anthropogenic plus natural effects have most likely had a small net cooling effect over this period.
NRC Report
Dr. Pielke cites the 2005 National Research Council (NRC) report on radiative forcing of climate change in arguing that climate models underestimate the effects of land-use change on climate. The report does note (emphasis added):
"Regional variations in radiative forcing may have important regional and global climatic implications that are not resolved by the concept of global mean radiative forcing."
However, the NRC report does not share Dr. Pielke's minimization of the role of CO2, or the continued importance of the top the atmosphere (TOA) energy imbalance:
"The strengths of the traditional radiative forcing concept warrant its continued use in scientific investigations, climate change assessments, and policy applications"
"The largest positive forcing (warming)...is from the increase of well-mixed greenhouse gases (CO2, nitrous oxide [N2O], methane [CH4], and chlorofluorocarbons [CFCs])"
OHC as The Global Warming Diagnostic
Dr. Pielke appears to believe that ocean heat content (OHC) by itself is a sufficient "diagnostic to monitor global warming." We do agree that most of the global energy imbalance goes into the oceans - we even created a high resolution graphic illustrating this point:
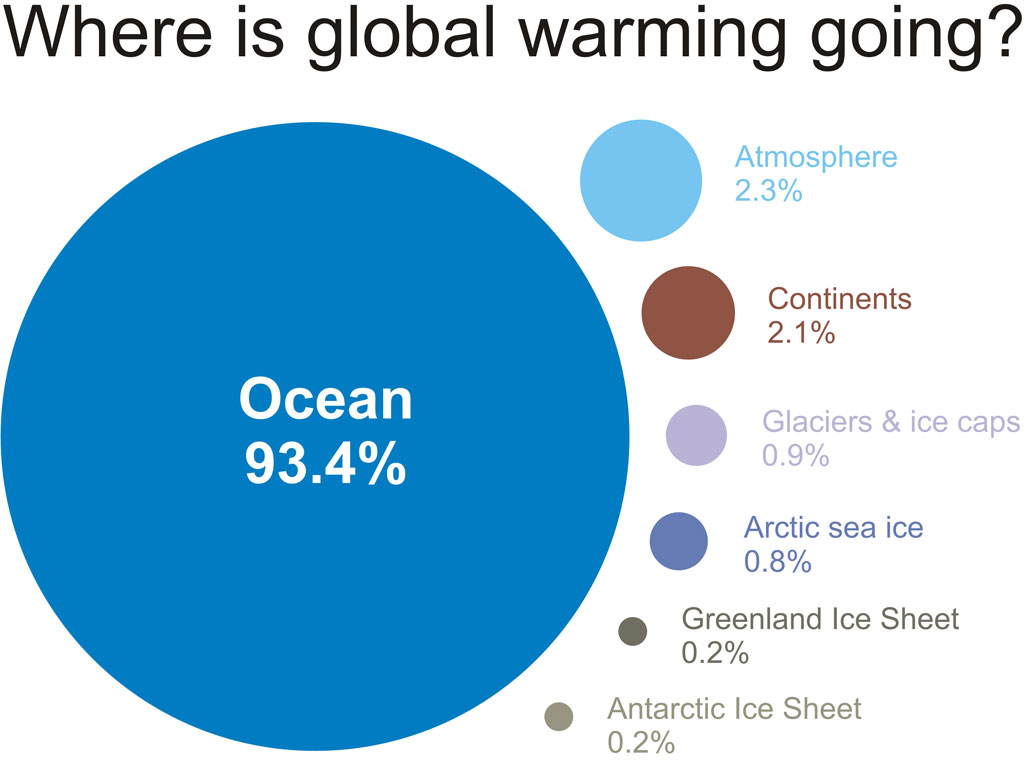
However, as the graphic illustrates, nearly 7% of the energy goes into the rest of the climate system. Moreover, the degree of accuracy of OHC measurements is still quite uncertain: the ARGO network is relatively new, and doesn't measure the deep oceans, and short-term noise in the data remains a concern (i.e. see Domingues et al. 2008).
Furthermore, we humans are surface-dwelling creatures, so impacts to the climate on the surface is highly significant to us. And most fast feedbacks are dominated by surface/atmospheric temperatures; so to rely on OHC as the sole diagnostic would disguise the progression of processes that will affect our experience of climate.
Ultimately we stand behind our answer that we must consider all lines of evidence, and all aspects of the climate. SkS does not believe there should be a single preferred global warming diagnostic. However, it's also important to note that a lot of energy has gone into the oceans (more on this below).
Ocean Heat Content anomaly from 0 to 700 metres calculated by various teams (Lyman 2010).
Colleagues' Contributions
Dr. Pielke has yet to acknowledge the frequent climate myth and misinformation propagation of several of his colleagues (most notably Roy Spencer and John Christy). We do agree that these individuals have done some good scientific research and made valuable contributions, such as the development of the satellite temperature record. Dr. Pielke says of Roy Spencer:
"Despite the vigor with which you criticize Roy Spencer, he actually has been instrumental in elevating our awareness that natural variations in cloud cover, as a result of temporal variations in atmospheric circulation features, as causing long term variations in the TOA radiative imbalance."
We question the accuracy of this statement. Much of Spencer's research related to cloud cover has been fundamentally flawed, due, for example, to his over-reliance on an overly simplistic climate model (i.e. see here and here and here). And while they have made some valuable contributions, they have also done significant damage by misinforming the public and policymakers on climate issues.
Acting on the Prudent path
Although we were able to find common ground with Dr. Pielke on the 'prudent path' of reducing human CO2 emissions, we remain concerned that he continues to vigorously defend his colleagues who make statements that undermine this goal, for example Roy Spencer:
"Just as the deepening horse manure crisis was alleviated by the introduction of the automobile over a century ago, I suspect that our current worries over global warming will evaporate in the coming decades"
While we are happy that SkS and Dr. Pielke find common cause when it comes to how humans should deal with mitigating climate change, we are concerned and confused that Dr. Pielke continues to defend his colleagues who are very clearly opposed to taking this critical action, who think that man-made warming is a non-issue, and who communicate that belief to the public and policymakers in an effort to delay action.
Climate Model Accuracy
Dr. Pielke does not believe that climate model projections have been accurate, particularly at the regional level, and that linking policy to climate model results does more harm than good.
As the saying goes, all models are wrong, but some are useful. Climate models are by no means perfect and several weaknesses are recognized by the modelers themselves. For example, models tend to slightly overestimate the lower troposphere temperature trend, underestimate the Arctic sea ice decline, and decadal and sub-regional projections aren't yet satisfactory. However, despite their imperfections, climate models are valuable tools which have been used in many attribution studies, and have given the broadscale picture of what has happened over the past half century reasonably well. There are examples of models making accurate projections on important metrics, for example in drought (Sheffield and Wood 2007), precipitation extremes (Min et al. 2011), and floods (Pall et al. 2011). It is the over-emphasizing of their (real or purported) weaknesses that does more harm than good.
Finally, we must bear in mind the possibility that models may paint too rosy of a picture, based on data from the geologic record:
"In the meantime, we need to be cautious. If anything, the models are underestimating change, compared with the geological record. According to the evidence from the past, the Earth's climate is sensitive to small changes, whereas the climate models seem to require a much bigger disturbance to produce abrupt change. Simulations of the coming century with the current generation of complex models may be giving us a false sense of security." (Valdes 2011)
Ocean Acidification
Regarding ocean acidification, Dr. Pielke commented: "Regardless of whether we reduce the alkalinity of the oceans..." We would like to note that this is not a debatable question: human CO2 emissions are making the oceans more acidic. For details, see the OA not OK series or booklet, or various posts on the subject, including by renowned ocean expert Ove Hoegh-Guldberg.
Unanswered Questions
From Pielke
Dr. Pielke was dissatisfied with our answers to his questions regarding preferred climate change diagnostics, and whether global warming is a subset of or dominates climate change. We accept the NRC definition of "climate change" provided by Dr. Pielke. Our answer remains that we do not have preferred diagnostics of climate change; we must take all lines of evidence and data into consideration, and there are many (i.e. sea-level rise, ice melt, species endangerment and migration, crop yields, heat wave frequency and intensity, etc.). Based on the NRC definition, the increase in global temperature is a subset of climate change.
From SkS
SkS was dissatisfied with Dr. Pielke's answer to our question about reconciling his colleagues' arguments for low climate sensitivity and the paleoclimate record.
"I do not find the glacial and interglacial periods as useful comparisons with the current climate since when we study them with models, they have large differences in imposed terrain (e.g. massive continetal glaciers over the northern hemisphere which will alter jet stream features, for example).
In any case, I find the discussion of the so-called “climate sensitivity” by all sides of this issue as an almost meaningless activity."
We acknowledge Dr. Pielke's position on this issue, but disagree, and would appreciate an answer to this question. Ultimately, while there are certainly differences between glacial and interglacial periods, the global energy imbalance must be able to explain the change in surface temperature. There are also some good paleoclimate analogues to the current climate, like during the Pliocene and the Paleocene-Eocene Thermal Maximum (PETM).
If the equilibrium climate sensitivity is ~1°C for double CO2, as Spencer and Christy and Lindzen argue, a radiative forcing of nearly 20 W/m2 is required to explain glacial-interglacial transitions. This is three times larger than the net forcing identified in the paleoclimate record during these periods. That's a big discrepancy; can it be reconciled? Based on the evidence, we don't believe so.
Further Questions
Although Dr. Pielke appears to have terminated his interactions with SkS, we would like to give him the opportunity to clarify or retract some questionable statements he has recently made on his blog.
Troposphere Warming
Of Santer et al. (2011), Dr. Pielke said:
"they did not recognize that the global average temperature trend in the lower troposphere has been nearly flat as shown, for example, in the figure below from the RSS MSU data...There has been NO long-term trend since the large El Niño in 1998. That’s 13 years."
However, Santer et al. concluded that a minimum of 17 years is necessary to identify human effects in the temperature of the lower troposphere (TLT), so why look at the 13-year trend? Moreover, as Pielke notes, there was a very strong El Niño in 1998, and TLT data is very sensitive to changes in ENSO. We wonder, will Dr. Pielke will acknowledge that 1998 was a poorly-chosen start date for this analysis?
Ocean Warming
In another blog post, Dr. Pielke said that the upper 700 meters of ocean have accumulated no heat since 2003. However, we examined the data from several studies on the subject (provided by NOAA), and found that between 2003 and 2009, the upper 700 meters accumulated between 1.1 x 10²¹ Joules (Levitus - though this reference may be slightly out of date), and 5.6 x 10²² Joules (Palmer), with Willis et al. falling in between at 5.1 x 10²¹ Joules.
And of course there's nothing special about the upper 700 meters; von Shuckmann and Le Traon (2011) estimate an increase of 5.9 x 10²² Joules between 2005 and 2010 for 10 to 1,500 meters, and heat is accumulating in the deep oceans as well (i.e. see here and here and here).
While the trends listed above are not statistically significant due to the short timeframe, they are nevertheless most likely positive, and we certainly can't be confident that they are zero, particularly given the order of magnitude discrepancy between the various estimates. Given this data we wonder, will Dr. Pielke agree that his previous assessment of zero Joules accumulated during this period was incorrect, and that the timeframe (since 2003) and depth (700 meters) is insufficient for a suitable assessment of the climatological trend?


 [Source]
 0
0  0
0 (RSS TLT anomaly as reproduced by Dr Pielke, Sept 7th, 2011).
As an aside, I to believe that policy makers are being misled "into believing that the climate should more-or-less monotonically warm". However, that misleading is coming from people like your friends Christopher Monckton and Anthony Watts.
(RSS TLT anomaly as reproduced by Dr Pielke, Sept 7th, 2011).
As an aside, I to believe that policy makers are being misled "into believing that the climate should more-or-less monotonically warm". However, that misleading is coming from people like your friends Christopher Monckton and Anthony Watts.


Comments