Climate Science Glossary

Term Lookup

Enter a term in the search box to find its definition.

Settings

Use the controls in the far right panel to increase or decrease the number of terms automatically displayed (or to completely turn that feature off).

Term Lookup

Settings


All IPCC definitions taken from Climate Change 2007: The Physical Science Basis. Working Group I Contribution to the Fourth Assessment Report of the Intergovernmental Panel on Climate Change, Annex I, Glossary, pp. 941-954. Cambridge University Press.

Home Arguments Software Resources Comments The Consensus Project Translations About Support

Twitter Facebook YouTube Mastodon MeWe

RSS Posts RSS Comments Email Subscribe


Climate's changed before
It's the sun
It's not bad
There is no consensus
It's cooling
Models are unreliable
Temp record is unreliable
Animals and plants can adapt
It hasn't warmed since 1998
Antarctica is gaining ice
View All Arguments...


Username
Password
New? Register here
Forgot your password?

Latest Posts

Archives

On the reliability of the U.S. Surface Temperature Record

Posted on 22 January 2010 by John Cook

The website surfacestations.org enlisted an army of volunteers, travelling across the U.S. photographing weather stations. The point of this effort was to document cases of microsite influence - weather stations located near car parks, air conditioners and airport tarmacs and anything else that might impose a warming bias. While photos can be compelling, the only way to quantify any microsite influence is through analysis of the data. This has been done in On the reliability of the U.S. Surface Temperature Record (Menne 2010), published in the Journal of Geophysical Research. The trends from poorly sited weather stations are compared to well-sited stations. The results indicate that yes, there is a bias associated with poor exposure sites. However, the bias is not what you expect.

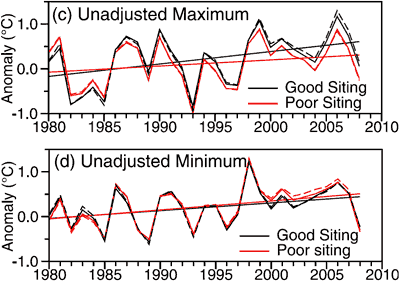
Weather stations are split into two categories: good (rating 1 or 2) and bad (ratings 3, 4 or 5). Each day, the minimum and maximum temperature are recorded. All temperature data goes through a process of homogenisation, removing non-climatic influences such as relocation of the weather station or change in the Time of Observation. In this analysis, both the raw, unadjusted data and homogenised, adjusted data are compared. Figure 1 shows the comparison of unadjusted temperature from the good and bad sites. The top figure (c) is the maximum temperature, the bottom figure (d) is the minimum temperature. The black line represents well sited weather stations with the red line representing poorly sited stations.
Maximum and Minimum Temperature Anomaly for good and bad sites
Figure 1. Annual average maximum and minimum unadjusted temperature change calculated using (c) maximum and (d) minimum temperatures from good and poor exposure sites (Menne 2010).

Poor sites show a cooler maximum temperature compared to good sites. For minimum temperature, the poor sites are slightly warmer. The net effect is a cool bias in poorly sited stations. Considering all the air-conditioners, BBQs, car parks and tarmacs, this result is somewhat a surprise. Why are poor sites showing a cooler trend than good sites?

The cool bias occurs primarily during the mid and late 1980s. Over this period, about 60% of USHCN sites converted from Cotton Region Shelters (CRS otherwise known as Stevenson Screens) to electronic Maximum/Minimum Temperature Systems (MMTS). MMTS sensors are attached by cable to an indoor readout device. Consequently, limited by cable length, they're often located closer to heated buildings, paved surfaces and other artificial sources of heat.

Investigations into the impact of the MMTS on temperature data have found that on average, MMTS sensors record lower daily maximums than their CRS counterparts, and, conversely, slightly higher daily minimums (Menne 2009). Only about 30% of the good sites currently have the newer MMTS-type sensors compared to about 75% of the poor exposure locations. Thus it's MMTS sensors that are responsible for the cool bias imposed on poor sites.

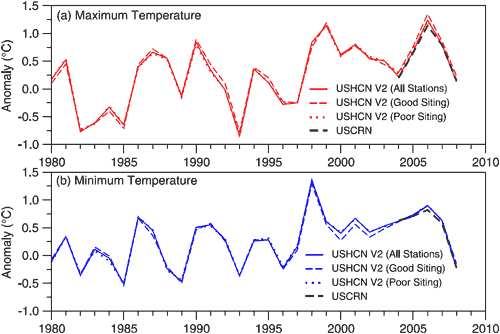
When the change from CRS to MMTS are taken into account, as well as other biases such as station relocation and Time of Observation, the trend from good sites show close agreement with poor sites.
Maximum and Minimum Temperature Anomaly for good and bad sites
Figure 2: Comparison of U.S. average annual (a) maximum and (b) minimum temperatures calculated using USHCN version 2 adjusted temperatures. Good and poor site ratings are based on surfacestations.org.

Does this latest analysis mean all the work at surfacestations.org has been a waste of time? On the contrary, the laborious task of rating each individual weather station enabled Menne 2010 to identify a cool bias in poor sites and isolate the cause. The role of surfacestations.org is recognised in the paper's acknowledgements in which they "wish to thank Anthony Watts and the many volunteers at surfacestations.org for their considerable efforts in documenting the current site characteristics of USHCN stations." A net cooling bias was perhaps not the result the surfacestations.org volunteers were hoping for but improving the quality of the surface temperature record is surely a result we should all appreciate.

UPDATE 24/1/2010: There seems to be some confusion in the comments mistaking Urban Heat Island and microsite influences which are two separate phenomenon. Urban Heat Island is the phenomenon where a metropolitan area in general is warmer than surrounding rural areas. This is a real phenomenon (see here for a discussion of how UHI affects warming trends). Microsite influences refer to the configuration of a specific weather station - whether there are any surrounding features that might impose a non-climatic bias.

UPDATE 24/1/2010: There has been no direct response from Anthony Watts re Menne 2010. However, there was one post yesterday featuring a photo of a weather station positioned near an air-conditioner along with the data series from that particular station showing a jump in temperature. The conclusion: "Who says pictures don’t matter?"

So the sequence of events is this. Surfacestations.org publishes photos and anecdotal evidence that microsite influences inflate the warming trend but no data analysis to determine whether there's any actual effect on the overall temperature record. Menne 2010 performs data analysis to determine whether there is a warming bias in poorly position weather stations and finds overall, there is actually a cooling bias. Watts responds with another photo and single piece of anecdotal evidence.

UPDATE 28/1/2010: Anthony Watts has posted a more direct response to Menne 2010 although he admits it's not complete, presumably keeping his powder dry for a more comprehensive peer reviewed response which we all eagerly anticipate. What does this response contain?

More photos, for starters. You can never have enough photos of dodgy weather stations. He then rehashes an old critique of a previous NOAA analysis criticising the use of homogenisation of data. This is curious considering Menne 2010 makes a point of using unadjusted, raw data and in fact, it is this data that reveals the cooling bias. I'm guessing he was so enamoured with the water pollution graphics, he couldn't resist reusing them (the man does recognise the persuasive power of a strong graphic).

0 0

Printable Version  |  Link to this page

Comments

Prev  1  2  3  4  

Comments 151 to 155 out of 155:

  1. Tom @ 148 - ahhh yes, of course! 19C, thanx. So how does Menne get this bias to cooling? Thought I had figured it out..... Doug @ 149 - hmmm, yes I think I get it now, I was thinking too literally in Temperature, not thinking in energy gain/loss. note to self - temp is just a tool to help show energy changes as weight is for mass on earth! thanx again gents, will hopefully be better next time! PS - John, great site, full of respect and knowledge, you may get me off that lukewarm fence yet!
    0 0
  2. Leo G, the cool bias that Menne found was created by the replacement of one kind of instrument with another, at the same locations. The instruments don't last forever, so they must be replaced, even if by the same kind. When that is done, scientists check the new instrument's measurement against the previous one. Any discrepancies in the measurements of the two instruments must be eliminated by changing all the historic temperatures from the previous instrument, or by changing all the future temperatures from the new instrument. In this particular replacement of one kind of instrument with another kind, one specific difference between the two kinds was not detected during that calibration. So the new instruments were reporting slightly cooler temperatures than the old instruments would have, but nobody knew that. Those slightly cooler measurements started happening only recently, because that's when the instruments were replaced. The shift to cooler measurements was not obviously sudden in the average across all stations, because the instruments were not replaced all at once. As more instruments were replaced one by one, the average temperature consequently became progressively cooler. Someone probably would have noticed the pattern eventually, if they had compared the new type of instrument's measurements against the old type of instrument's measurements across a whole lot of measurements. That comparison eventually did happen, by the fluke of the new instruments being worse sited than the old instruments were. (The new instruments were tethered too close to buildings.) When Menne discovered the worse-sited instruments were slightly cooler than the better sited instruments, he tried to figure out why, by looking for characteristics common to the worse-sited instruments. He found they tended to be the new instruments. So then he did the explicit comparison of new instruments against old that I mentioned in the last sentence of my previous paragraph.
    0 0
  3. Leo G, now to relate my explanation to the light bulb analogy: The replacement of the instruments is analogous to replacing the thermometer in the room with the light bulb, when the new thermometer reports slightly cooler temperatures than the previous thermometer did. The resulting cooler measurements have nothing to do with the light bulb. The poor siting of the new instruments was not the cause of the cooling. The poor siting was merely an accidental clue to the discovery that the new instruments were cooler. And why didn't the anomaly computation compensate for this artificial coolness? Because the situation changed. An anomaly computation compensates only for a constant bias. In this case the bias changed with the instrument replacement, but the anomaly continued to be computed off of the same baseline, so of course the anomaly accurately reflected the new bias. Use of anomalies does not correct all kinds of errors. Other adjustments are carefully made to compensate for changes in instrument, instrument type, specific location, and other situations.
    0 0
  4. How would a slow urban build-up around a rural temp. station be treated via microsite and UHI adjustments? Are these adjustments historical at all, other than major events like changing instruments, or locations? Basically, if a site was rural at one time, and over time has become urban, is the UHI adjustment applied at increasing levels over the peiod of this transformation, or is it just applied all at once? Further, what about the classification of a station by type? Is that historical at all, or are stations considered to have always been the type classified when they were evaluated by surfacestations.org?
    0 0
    Response:

    "How would a slow urban build-up around a rural temp. station be treated via microsite and UHI adjustments?"

    This is a good question and is addressed in Urbanization effects in large-scale temperature records, with an emphasis on China (Jones et al 2008) - I give a summary of the paper's results here.

    Re the classification of stations, the NOAA have classified their stations also - Menne 2010 performs their analysis with the surfacestations.org classifications and their own.

  5. A bit off topic but it did make me laugh! http://wattsupwiththat.com/2010/01/29/diverging-views/#more-15833 And this line jumped out "the land based extrapolation actually turned those sea based cells more than 3C hotter." To go back to the topic - if this is the best info we have then AGW is sunk. I am learning all about PC analysis by the way - really trying to get educated!
    0 0
  6. Sorry I meant 'sunk' in terms of public opinion and policy not in terms of science.
    0 0
  7. sbarron2000 at 04:40 AM on 30 January, 2010 "Further, what about the classification of a station by type? Is that historical at all, or are stations considered to have always been the type classified when they were evaluated by surfacestations.org? " If it had been designed for scientific research, Watts' survey could have really helped with quantifying the questions you ask. Unfortunately the information solicited includes little that would have made all the effort performed by volunteers more useful. All sorts of data including development density changes, prevailing winds, etc. could have been gathered by volunteers if they had been competently directed, provided with specific and unambiguous instruction as well as a carefully crafted collection system. surfacestation.org has instructions and data collection sheets on the site. Collection sheet: http://www.surfacestations.org/downloads/StationSurvey_form.doc As you can see, normalizing the results of the questionnaire would be hugely labor intensive given the open-ended nature of the response solicitations. The whole effort appears to have been about generating embarrassing photographs. All the same, Menne was able to salvage something from Watts' disaster; photographs did allow at least a rough qualitative division of locations. So for Watts it was temporarily at least a PR win but permanently a science botch. If he had approached scientists with a proposal for collaboration instead of wasting himself flinging baseless charges of incompetence and corruption maybe he would not have wasted so many people's time. Nice that Menne was able to tease out what was useful from the wreckage.
    0 0
  8. Tom Dayton: I may be reading you incorrectly, but you appear to say that the bias due to switching from liquid thermometers to MMTS stations was recently discovered. It was not. It is mentioned as early as 1991. See Quayle et al, "Effects of Recent Thermometer Changes in the Cooperative Station Network." In that paper, it was found that the MMTS stations reported lower max temps and higher min temps, and it gave some possible reasons why. Menne (2009) revisited the issue, and Menne (2010) suggests that the adjustment may not be complete, leaving behind a slight cooling bias in the adjusted MMTS figures. That would take further work to confirm. I hope I'm correct on that myself, but hopefully that is of help.
    0 0
  9. sbarron2000: In asking about gradual changes at a site, you are asking the correct question. Gradual changes affect the trend, and require attention. I refer you to Menne, Williams and Vose (2009) in BAMS. They discuss this problem, and find that their method can handle it; they show an example for Reno, Nevada in Fig 8. This adjustment method is new, and I haven't yet digested how it works, or why it's better than the previous.
    0 0
    Response: Here's a direct link to the 2009 Menne paper - Menne 2009 - this is where they also discuss the influence of the switch from CRS to MMTS.
  10. Thanks for the correction and detail, carrot eater!
    0 0
  11. Interesting. The "difference in means test" is what we're talking about? That seems like it would work great in an area that had one urbanizing site surrounded by several (up to 10) rural sites. But what happens if 7 of the 10 neighboring sites are also seeing some urbanization? There are a lot of (Figure 1, Menne 2010) in areas that have seen rapid poplation growth over the past 30 years (the entire west coast, Arizona, Nevada, etc.). I wonder how effective the differences in mean test works in states where there has been wide spread population growth. It might make finding neighboring sites that are uneffected by their own gradual urbanization increase difficult. And since it doesn't appear there is any specific correction for that situation, gradual locality warming could go unadjusted. And given that only 71 of the 400+ sites were actually deemed "good," There aren't many good sites correcting for the bad sites differing means. Or maybe I'm totally off base? :-)
    0 0
  12. sbarron2000, you do not need to be hundreds of miles away from a even a large town to get meaningfull reading. Central Park in New York, for example, is almost free of the UHI effect. There's plenty of room in the west coast or Nevada or whatever to get meaningfull readings.
    0 0
  13. sbarron: I will refrain from commenting on the new US homogenisation method until I'm sure I understand it. I'll just say it's been updated, so if you haven't, then check out the description. This is yet another Menne et al (2009), this one in Journal of Climate. "Homogenization of Temperature Series via Pairwise Comparisons" In terms of whether there are large areas where there are no surrounding rural stations within a reasonable radius: I don't think you'll be able to find such a region. Anyway, we've seen so many analyses that would show that UHI is not contaminating the overall US mean - datasets that only include rural stations, comparisons of calm and windy nights, etc, etc. There's probably good articles on this site to refer you to other papers on that. Be careful; the station rankings here don't necessarily have anything to do with urban warming. In terms of whether there are enough 'good' sites to correct the 'bad', Menne (2010) shows that nicely. They show good and bad, unadjusted, adjusted only for TOB, and with all adjustments. You can see that the main correction in the 'good' is due to TOB, which does not use neighboring stations. For the most part, the neighbor-based correction takes the 'bad' and makes them converge with the 'good'. So that makes sense.
    0 0
  14. Watts and d'Aleo have just published this paper at Robert Ferguson's 'Science and Public Policy Institute'. It's claims are pretty wild. Apparently we can throw all temperature records out the window, because ALL of them are effectively faked. It might be worth addressing these claims in detail, if time can be found. http://scienceandpublicpolicy.org/images/stories/papers/originals/surface_temp.pdf
    0 0
  15. Riccardo, I agree with you that there is plenty of room for good readings. But are the stations in question in such locations? Because if they're not, then the difference of means adjustment appears to attempt to correct tainted measurements using other tainted measurements. That can't be a good thing, can it? Carrot eater, I'll be the first to admit that I don't fully understand what the difference in means test is doing. I have only glanced at Menne 2009, and would probably need to see the actual calcs to figure out how the test is conducted anyway. My comment is only intended as a way to consider the adjustments that Menne 2010 makes, and its possible effects on its findings. Like, what is the effect of running the difference of means test on data that you know is considered poor, because of the site rating? Like must be done when Menne 2010 seperates the good sites from the bad. Does correcting badly sited temp stations using other badly sited temp stations have some unforseen effects? The same is done to the good sites, and there are way fewer of them. So any influence might have a larger impact with the smaller sample. Just thinking out loud again.
    0 0
  16. Also, why does Menne 2010 not provide an average temperature in C anomaly chart that compares adjusted and unadjusted good sites and bad sites? Wouldn't that be the easiest way to show whether there is a difference between the two types of sites? Right now it only provides maximum and minimum anomaly comparisons. Which while interesting, and I'm sure you can learn a lot from them, isn't really the standard way which we compare temp anomaly, is it?
    0 0
  17. sbarron2000, "Fortunately, the sites with good exposure, though small in number, are reasonably well distributed across the country and, as shown by Vose and Menne [2004], are of sufficient density to obtain a robust estimate of the CONUS average (see their Fig. 7)" They have 71 good stations. In Vose and Menne 2004 they found that the coefficient of determination for both maximum and minimum temperature reaches 95% already with 25 stations. There's no reason for concern.
    0 0
  18. Philip64, not sure i'll waste my time going through it because, looking at just the table of content, they do not address the only relevant point, the impact on the temperature records. All the rest (111 pages!) is propaganda.
    0 0
  19. Philip64: The SPPI report is just a grab-bag of old nonsense. Most of it is based on simple understandings of how anomalies are used, as well as weird conspiracy theories about stations. The conspiracy theory about station-dropoff is easily dismissed by looking an openly published papers from long ago about the sources of the GHCN, and is further discussed here. http://www.yaleclimatemediaforum.org/2010/01/kusi-noaa-nasa/
    0 0
  20. sbarron: do you want to see the means, instead of just max and min? I don't quite follow.
    0 0
  21. Carrot eater: yes, the means.
    0 0
  22. sbarron2000: Take the max and min data shown, and take the average. That'll pretty much suffice. As for homogenisation: Again, I haven't taken the time to appreciate mechanics of the new pairwise algorithm yet, but as far as I'm concerned, the proof is in the pudding. After homogenisation, the 'poor' stations look just like the 'good', the liquid-in-glass look pretty much like the MMTS, and they all look like the US CRN network (which were purposefully sited ideally some time back). Seems like it's doing OK to me. And again, you'll see the major adjustment to the 'good' stations here was TOB, which is separate from the pairwise homogenisation.
    0 0
  23. A second post on D'Aleo and Watts from the Texas State Climatologist.
    0 0
  24. Tom Dayton at 11:41 AM on 31 January, 2010 "A second post on D'Aleo and Watts from the Texas State Climatologist. " Pretty clear why he's got his post. Ability plus communications skills in abundance. That was very interesting, thank you.
    0 0
  25. Hi is this on topic? http://wattsupwiththat.com/2010/01/31/uhi-is-alive-and-well/ If you live in a city as I do then you know how much warmer it is than the surrounding countryside. To be told that sitings of temp stations dont reflect this is counter intuitive and makes me very suspicious of the way Menne got his results - a bit like Mann's famous, now broken, hockey stick.
    0 0
  26. come on jpark, you know very well that when the data are homogenized ("adjusted") people (sceptics) screams out loud. This is the very reason why they show raw data only. We all know that UHI exists and indeed, before being considered for the average of their respective grid point data are corrected for UHI effect, station movement, instrument change, etc. I've never (NEVER) seen Watt do the full analysis. Given that behind Watt there is Roger Pielke Sr., they sure have the skill to do it. If they don't, the reason is clear. That post is just a confirmation that what they say is irrelevant.
    0 0
  27. jpark, this is tosh. Anybody knows there are individual stations out there that show urban heating. You don't need Watts for that; you can see it from the people who actually do published work. The question is whether those effects are contaminating the overall surface record, and by any actual analysis, they appear to not do so. It's funny that Watts chose to highlight Reno NV, without telling you that the USHCN's method removes the urban heating for that station. See Figure 8 in Menne, Williams and Vose (2009) BAMS, 90: 993-1007. Link was given above somewhere.
    0 0
  28. Thanks Ricardo - lets see if they do the analysis then. Pity Menne only used 40% of the available data tho. Bit like only using some bristlecones, like a D'Arrigo cherry picked pie. Pielke says "We will discuss the science of the analysis in a subsequent post and a paper which is being prepared for submission." so it looks like it is happening...
    0 0
  29. Carrot eater - v helpful. So the temperatures are adjusted down to counteract the UHI, yes?
    0 0
  30. jpark: You can see the result of the homogenisation for Reno yourself, in the paper I cited. A huge warming trend is significantly reduced. Where some sceptics get confused is that they think UHI is the only thing you'd ever need to adjust for, and then they get angry when they see any upwards adjustments. However, other things can require either upwards or downwards adjustments, and in the US, changes in the time of observation stand out as a requiring upwards adjustments. One thing to not forget is the US CRN network, which is entirely sited to avoid any of these problems. It's newish, but it's been up for a few years now. After adjustments, Menne (2010) showed that even the 'poor' stations matched the US CRN. That would tell you that they're doing something right.
    0 0
  31. jpark: There was no cherry picking in only using 40%. They used the 40% that was publicly available on Watt's website, and then had their own people confirm most of those ratings. They then considered whether there were enough stations in enough places to do an analysis, and they found that they did. If the stations are well-distributed, you don't need a high number of stations to compute a national average. Menne has previously published an analysis discussing how many stations you need to get an accurate idea of the overall picture. See Vose, Menne (2004), Journal of Climate 17: 2961-2971. Adding more stations would help, though you eventually reach a point where adding more stations doesn't change anything.
    0 0
  32. jpark, hint: look at fig.7 of the paper quoted by carrot eater. I'm waiting for a Pielke and Watt paper on this, for years indeed, so hopefully this story will come to an end and archived for ever (just a hope, isn't it?). Judging from their blog posts it won't add much to the subject. Here is my bet, they will focus on the raw data.
    0 0
  33. Riccardo at 02:57 AM on 2 February, 2010 "Here is my bet, they will focus on the raw data. " If you look at the data collection sheets provided for volunteers, you can see that there is little "data" beyond a photograph and geographic location information, which will never produce numerical results beyond what Menne did. The sheet includes space for anecdotal site information but coding that into some normalized form is going to be virtually impossible. If Watts had designed his survey better, he might have been able to produce something beyond Menne, but the information needed for that doing was not collected. I'm not even sure it would possible to do so; presumably adding prevailing winds at sites could help, getting some kind of quantitative readings of factors introducing errors, but in that latter case, how? Nobody can read Watts' mind, but I don't think he had a clear plan for what data he needed or for that matter even what he was trying to show, other than embarrassing photos. Who know, maybe there's something that can be done with all that effort. Hopefully.
    0 0
  34. Mr. Eater of Carrots (Love the name bytheway) - {It's funny that Watts chose to highlight Reno NV, without telling you that the USHCN's method removes the urban heating for that station. See Figure 8 in Menne, Williams and Vose (2009) BAMS, 90: 993-1007. Link was given above somewhere} The blog that jpark refered to was Anthony's response to desmogblog and another that had declared UHI a non-issue, as in the parrot skit - Dead! He shows where in peer reviewed papers the authors have corrected for UHI. Kinda like when a sceptic says that there is no basis for energy trapping from CO2, and John here, shows the absurdity of that claim. Nothing nefarious really.
    0 0
  35. Leo G: Yeah, I see that context. desmogblog had a poorly written headline, and Watts went after the low-hanging fruit of showing that UHI exists in some places. I had no carrots today, so I'm grouchy.
    0 0
  36. Leo I think he used Reno because the National Weather Service includes the UHI factor in one of it’s training course using Reno, NV. So says Watts anyway. But this is quite a shock from Pielke blog (link below) where Phil Jones (et Al) is quoted as saying "London however does not contribute to warming trends over the 20th century because the influences of the cities on surface temperatures have not changed over this time." Pielke says: 'However, how would they possibly know that? The assumption that any temperature increase in the last couple of decades in London is not attributable to an increased urban heat island effect, at least in part, needs be documented, for example, by satellite surface temperature measurements for the more recent decades when they are available.' http://pielkeclimatesci.wordpress.com/2010/02/04/the-urban-heat-island-issue-the-released-cru-e-mails-illustrate-an-inconsistency/
    0 0
  37. jpark, ironically, the question asked by Pielke Sr. and you has an answer in the very same post. When he quotes Willby paper to assess the UHI effect in London, the very same comparison can be used to check for a difference in the trends. I don't know if Jones at al. used these two stations, but for sure this is the way UHI effect on a trend is checked and corrected for, if any.
    0 0
  38. HI ys I saw that - if one has to 'correct' for it then presumably Jones was not right in saying it did not exist - which I think is the main point Pielke is making. I will see his son debate with Bob Ward this Friday in London - I hope it is enlightening.
    0 0
  39. jpark, Jones never said that the UHI didn't exist, he said it hadn't changed in London over the time period in question. Which makes sense, considering how long the city has been developed.
    0 0
  40. A bit OT, yes, but still on temperature records: Sattelite time series, like the UHA, show a much stronger El Nino peak in 1998 (which makes for a favorite source for guys like Watts). Where does the difference come from?
    0 0
  41. Alexandre, the difference is what they measure. Satellites measure the whole lower troposphere while surface stations just a few (usually two) meters above the surface.
    0 0
  42. Hello; I was trying to explain the implication of Menne2010 regarding Watts' work, and I was unable to make my point. There seemed to be ~4 issues for which I had no answer. Hopefully the experts here can help me clarify my thinking and the people around me. 1. Did Watts incorrectly apply the purported URCRN Siting Handbook criteria http://www1.ncdc.noaa.gov/pub/data/uscrn/documentation/program/X030FullDocumentD0.pdf section 2.2.1? 2. Assuming that the criteria were correctly applied by Watts, why does the handbook list estimated errors of 1C, >=2C, and >=5C for CRN classes 3,4,5? 3. How does Menne2010 address questions 1 and/or 2? 4. I'm having trouble conveying a simple explanation of how Menne2010 or anyone could prove that nearby heatsources would not create a heat bias in measuring air temperatures. I see the analysis. But I can't explain it to anyone. What is the mechanisms that apparently immunizes the CRN 3,4,5 thermometers (MMTS or LIG) from nearby heaters? Thanks, I wish I could handle this myself, but I need help. Dio
    0 0
  43. diogene, a major part of the answer to your question 4 is that for a "bias" to be a bias relevant to climate change, it must be a bias in the trend of the same station - the change in the same day's or month's temperature over years, of the same station. If Station A in the northern hemisphere is next to an air conditioner coil and Station B (also in the northern hemisphere) is not, on July 18 Station A probably will be warmer than Station B--but that's in the absolute temperature on that one day. On that same July day exactly one year later, A probably again will be warmer than B, but by the same amount as on that day the previous year. The year-to-year trend in the temperature of Station A compared to itself is the measure that is relevant to climate change. Ditto for Station B. The difference in temperature between A and B easily can be imagined to be constant from year to year, and the actual observations support that imagination. Temperature "anomaly" is what you see graphed in nearly all climate change graphs. That "anomaly" contains the information about that year-to-year difference for the same station on the same day or month, but filters out the absolute temperature that is the difference between Station A and Station B.
    0 0
  44. Uhh, does this line of logic rely on assumptions, that the thermometer heating is constant over short and long timeframes? I'm concerned that the counterargument will be that the onset of AGW might be said to be at a similar time as the onset of widespread airconditioner installation at USCRN networks. I imagine that some might say the A/C installation would have an anomalous effect on the "anomaly". Are the A/C users at CRN 3,4,5 stations directed to use the A/C unit in a consistent way to ensure the constant differential due to thermometer heating? I didn't see this treated in Menne2010. One other point; Did Watts analysis determine whether the A/C units were operable in winter as 'heat pumps'? Thanks for trying to help. I am up against some nontrivial resistance here... Dio
    0 0
  45. diogene at 12:59 PM on 15 February, 2010 Probably what is most difficult about Watts' fallacy is its fundamental simplicity. The very fact it is so -wrong- makes it easy to overshoot the basic error Watts committed and get lost in a myriad of irrelevant details. Think of it as a word problem you might have encountered in middle school. Remember all the extra information that used to be thrown in, distracting you from the actual question? Don't let the extra verbiage devoted to this topic fool you. Tom Dayton explained Watts' fallacy nicely, and there are numerous other simple explanations scattered throughout the comments in this thread. I suggest you read through and find an explanation that works for you.
    0 0
  46. diogene, no, this line of logic does not rely on assumptions, because Menne (2010) analyzed the observations. The "poorly" sited stations (one graph line) had the same trend as the "well" sited stations (a different graph line). No, airconditioner users were not given instructions about use of the airconditioner. (The stations should not have been installed there in the first place.) But that doesn't matter, as has been shown empirically by Menne. No assumptions required. Just look at the actual trends. It turns out to be a fact that any such effects are inconsequential. That was not a foregone conclusion; as you wrote, it is easy to imagine that the effects could be profound. But facts are facts.
    0 0
  47. More very helpful and thought provoking posts. My problem with the Menne et al paper is being confident in what they are measuring - Watts explanation has helped here (nice pictures!) - I am sure I posted the link before but maybe diogene has not seen it http://wattsupwiththat.com/2010/01/27/rumours-of-my-death-have-been-greatly-exaggerated/ RobM - thanks, but how does Jones know that? Is it just his opinion? London has changed hugely over the last 50, 100, 150 years. I respect what he says but what is it based on?
    0 0
  48. jpark, you're a bit late, John already posted an update on 28/1/2010 with the link to Watt's non-response, as always. As for UHI in London, it was not that difficult to find out yourself. I'd also suggest to not cast doubt and at the same time wash your hands with the (false?) premise "I respect what he says". Was it of any the data upon which a scientist based its claims you'd have look for them. Anyway, just to make your life easier, here's the first google search result i got. Just the first section on urbanization will give you an idea; should you need more details look at the scientific litterature, e.g. Jones et al. 2008, J. Geophys. Res. 113, D16122
    0 0
  49. rephrase the last sentence of second par.: Was the data upon which a scientist based its claims of any interest you'd have look for them before.
    0 0
  50. jpark at 06:16 AM on 21 February, 2010 My perspective is different than yours, but I too had a tough time retraining myself to make my comments appropriate to the tone John Cook is trying to establish here. I never realized how much snark I'd grown accustomed to radiating 'til I tried putting my oar in here. Take a another look at the "Comments Policy" is my suggestion to you.
    0 0

Prev  1  2  3  4  

You need to be logged in to post a comment. Login via the left margin or if you're new, register here.


The Consensus Project Website

THE ESCALATOR

(free to republish)


© Copyright 2024 John Cook
Home | Translations | About Us | Privacy | Contact Us