Explaining climate change science & rebutting global warming misinformation
Global warming is real and human-caused. It is leading to large-scale climate change. Under the guise of climate "skepticism", the public is bombarded with misinformation that casts doubt on the reality of human-caused global warming. This website gets skeptical about global warming "skepticism".
Our mission is simple: debunk climate misinformation by presenting peer-reviewed science and explaining the techniques of science denial, discourses of climate delay, and climate solutions denial.


Posted on 2 February 2025 by BaerbelW, Doug Bostrom
A listing of 24 news and opinion articles we found interesting and shared on social media during the past week: Sun, January 26, 2025 thru Sat, February 1, 2025.
This week's roundup is again published soleley by category. We are still interested in feedback to hone the categorization, so if you spot any clear misses and/or have suggestions for additional categories, please let us know in the comments. Thanks!
Stories we promoted this week, by category:
Climate Change Impacts
- Dangerous temperatures could kill 50% more Europeans by 2100, study finds Net increase of 80,000 deaths a year projected in hottest scenario, with milder winters failing to redress balance by Ajit Niranjan, Environment The Guardian, Jan 27, 2025
- Climate change made deadly Los Angeles wildfires 35% more likely: new attribution study The fires, likely to be the costliest in world history, were made about 35% more likely due to the 1.3°C of global warming that has occurred since preindustrial times. by Jeff Masters, Yale Climate Connections, Jan 28, 2025
- Climate triple whammy boosted risk of LA fires, study shows Hot, dry conditions, a lack of rain and a longer fire-risk season are all more likely in today’s hotter climate by Damian Carrington Environment editor, The Guardian, Jan 28, 2025
- Climate change poses 'security threat' to Irish economy and society by Irishexaminer.com, IrishExaminer.com, Jan 30, 2025
- Polar bears are struggling to get enough to eat as sea ice dwindles due to climate change, study finds by University of Toronto, Phys.org, Jan 30, 2025
Climate Policy and Politics
Climate Science and Research
- Skeptical Science New Research for Week #4 2025 A weekly survey of freshly published peer reviewed and government/NGO reports on human-caused climate change, and what we can do to fix this problem. by Doug Bostrom & Marc Kodack, Skeptical Science, Jan 23, 2025
- The AMOC is slowing, it`s stable, it`s slowing, no, yes, … There’s been a bit of media whiplash on the issue of AMOC slowing lately – ranging from the AMOC being “on the brink of collapse” to it being “more stable than previously thought”. by Stefan Rahmstorf, RealClimate, Jan 26, 2025
- Comparison Update 2024 One more dot on the graphs for our annual model-observations comparisons updates. Given how extraordinary the last two years have been, there are a few highlights to note. by Gavin Schmidt, RealClimate, Jan 27, 2025
- Skeptical Science New Research for Week #5 2025 A weekly survey of newly published climate research, including academic peer reviewed reports as well as government and NGO publications. by Doug Bostrom & Marc Kodack, Skeptical Science, Jan 30, 2025
Read more...
0 comments
Posted on 1 February 2025 by Guest Author
 Skeptical Science is partnering with Gigafact to produce fact briefs — bite-sized fact checks of trending claims. This fact brief was written by Sue Bin Park from the Gigafact team in collaboration with members from our team. You can submit claims you think need checking via the tipline.
Is global warming promoting biodiversity?
 Biodiversity is declining, and global warming is a contributing factor.
Some species can adapt to environmental change, but many cannot evolve quickly enough, or at all. As habitats degrade and migration paths are blocked, many species have already disappeared, while more face extinction.
Adaptation often requires migration to better conditions, but human-made barriers like cities and dams block these paths. Climate change also disrupts migration cues, such as air or water temperature. Many species cannot migrate fast enough, like immobile coral reefs, or survive without specific habitats, like the now-extinct golden toad, confined to high-altitude Costa Rican forests made uninhabitable by human-induced climate changes.
Since 1970, mammal, bird, fish, reptile, and amphibian populations have declined by an average of 68%. Scientists estimate current extinction rates are hundreds to thousands of times higher than natural.
Climate change, habitat destruction, pollution, and overexploitation are all driving biodiversity loss, threatening ecosystems’ balance worldwide.
Go to full rebuttal on Skeptical Science or to the fact brief on Gigafact
This fact brief is responsive to quotes such as the one highlighted here.
Sources
WWF A warning sign: where biodiversity loss is happening around the world
AKSIK Fragility of Coral Reefs in Hawaii
ifaw Golden toads
Nature Food web rewiring in a changing world
CMS Major New UN Report Finds Climate Change is Severely Impacting Migratory Species of Wild Animals
WWF What is the sixth mass extinction and what can we do about it?
NOAA Climate Change: Atmospheric Carbon Dioxide
Read more...
7 comments
Posted on 30 January 2025 by Doug Bostrom, Marc Kodack
Open access notables
Revisiting the Last Ice Area projections from a high-resolution Global Earth System Model, Fol et al., Communications Earth & Environment:
The Last Ice Area—located to the north of Greenland and the northern Canadian Arctic Archipelago—is expected to persist as the central Arctic Ocean becomes seasonally ice-free within a few decades. Projections of the Last Ice Area, however, have come from relatively low resolution Global Climate Models that do not resolve sea ice export through the waterways of the Canadian Arctic Archipelago and Nares Strait. Here we revisit Last Ice Area projections using high-resolution numerical simulations from the Community Earth System Model, which resolves these narrow waterways. Under a high-end forcing scenario, the sea ice of the Last Ice Area thins and becomes more mobile, resulting in a large export southward. Under this potentially worst-case scenario, sea ice of the Last Ice Area could disappear a little more than one decade after the central Arctic Ocean has reached seasonally ice-free conditions. This loss would have profound impacts on ice-obligate species.
Between inflated expectations and inherent distrust: How publics see the role of experts in governing climate intervention technologies, Fritz et al., Environmental Science & Policy:
Novel technologies for removing carbon dioxide from the atmosphere and proposals around solar radiation modification, known also as solar geoengineering, display key features of complex problems. These climate intervention technologies are characterized by high uncertainties, value disputes, high stakes and urgency. Such features create wicked conundrums in climate governance. Addressing questions around more effective governance of these technologies necessitates reflections on how different kinds of expertise, normative judgments and democratic decision-making (should) interact. Based on a survey (N?=?22,222) and 44 focus groups (N?=?323) in 22 countries, we show (i) who publics see as an expert in the field of climate intervention technologies, (ii) what roles they envision for experts in governing climate intervention technologies and (iii) how trust and distrust in scientists unfolds in the context of these novel, partly controversial, technologies.
A scoping review on climate change education, Muccione et al., PLOS Climate:
The growing urgency of the climate crisis necessitates innovative educational approaches to equip people with the knowledge and skills to address climate challenges and be able to influence policy effectively. Education can be a central asset to promoting climate action, yet the importance of climate change education has been underexposed in large and influential assessment reports such as those from the IPCC. This study provides a comprehensive mapping of the literature on climate change education with a particular focus on the time period 2008-2023. By combining human coding and natural language processing (NLP) techniques, we examined a diverse corpus of over 6’000 publications from the peer reviewed literature. The findings highlight the pivotal role of climate education across various disciplines and its alignment with critical climate research themes such as adaptation, mitigation, disaster risk management, and sustainability. Our analysis reveals three predominant topics within the literature which are related to effective learning methodologies, sustainable development education, and the importance of education in adaptation and resilience. Additionally, we identified emerging themes emphasizing the role of youth as change agents, the necessity of transformative educational practices and the importance of energy literacy.
Power price stability and the insurance value of renewable technologies, Navia Simon & Diaz Anadon, Nature Energy:
To understand if renewables stabilize or destabilize electricity prices, we simulate European power markets as projected by the National Energy and Climate Plans for 2030 but replicating the historical variability in electricity demand, the prices of fossil fuels and weather. We propose a β-sensitivity metric, defined as the projected increase in the average annual price of electricity when the price of natural gas increases by 1 euro. We show that annual power prices spikes would be more moderate because the β-sensitivity would fall from 1.4 euros to 1 euro. Deployment of solar photovoltaic and wind technologies exceeding 30% of the 2030 target would lower it further, below 0.5 euros. Our framework shows that this stabilization of prices would produce social welfare gains, that is, we find an insurance value of renewables. Because market mechanisms do not internalize this value, we argue that it should be explicitly considered in energy policy decisions
The polarization of energy preferences – A study on social acceptance of wind and nuclear power in Sweden, Lindvall et al., Energy Policy:
Using Sweden as a study case, this article explores the polarized opinions to wind and nuclear energy, two low carbon energy options that have been shown to be politically controversial. In a wide-scale survey (N = 5200), general attitudes to wind and nuclear energy are captured, as well as to projects in the proximity of people's homes. The study demonstrates a deep polarization of energy preferences in Sweden, finding strong associations between worldviews, political orientation, environmental concern, and support for or resistance to wind and nuclear energy. The study concludes that support for both energy options is reduced when wind or nuclear power is constructed near people's home, but also suggests that the proximity effect is particularly strong for individuals with strong TAN (traditional, authoritarian, nationalistic) values and right leaning political ideology. The article argues that politically motivated reasoning might explain the polarization of attitudes, yet this effect seems to become less relevant when people are asked to judge potential energy infrastructure located close them.
Climate change and migration dynamics in Somalia: a time series analysis of environmental displacement, Mohamed et al., Frontiers in Climate:
Climate change is a significant driver of human migration, especially in vulnerable regions like Somalia. This study investigates the relationship between climate variables—average annual precipitation, temperature, and CO? emissions—and net migration in Somalia, using time series data from 1990 to 2020. Additionally, it examines the role of population growth as a factor influencing migration. Applying the Autoregressive Distributed Lag (ARDL) model, this research captures both short- and long-term dynamics, providing insights into how environmental and demographic factors impact migration in this climate-sensitive region. The results indicate that favorable rainfall conditions positively influence net migration, as improved agricultural productivity stabilizes livelihoods, reducing pressures to migrate. In contrast, increased CO? emissions, associated with environmental degradation, negatively impact migration by limiting financial capacity, creating a “trapped population” effect. Population growth also intensifies migration pressures by increasing competition for limited resources. Interestingly, temperature variations do not significantly influence migration, possibly due to adaptive strategies or resilience to temperature fluctuations in the region. These findings underscore the need for policies focused on enhancing agricultural resilience, restoring degraded environments, and creating economic opportunities to reduce migration pressures in Somalia. Investments in sustainable land use, climate adaptation, and population management strategies are essential to address the complex challenges of climate-induced migration.
Optimal life-cycle adaptation of coastal infrastructure under climate change, Bhattacharya et al., Nature Communications:
Climate change-related risk mitigation is typically addressed using cost-benefit analysis that evaluates mitigation strategies against a wide range of simulated scenarios and identifies a static policy to be implemented, without considering future observations. Due to the substantial uncertainties inherent in climate projections, this identified policy will likely be sub-optimal with respect to the actual climate trajectory that evolves in time. In this work, we thus formulate climate risk management as a dynamic decision-making problem based on Markov Decision Processes (MDPs) and Partially Observable MDPs (POMDPs), taking real-time data into account for evaluating the evolving conditions and related model uncertainties, in order to select the best possible life-cycle actions in time, with global optimality guarantees for the formulated optimization problem.
From this week's government/NGO section:
Climate change and news audiences report 2024: Analysis of news use and attitudes in eight countries, Ejaz et al., Reuters Institute and Oxford University
The authors collected data from an online survey of people in eight countries: Brazil, France, Germany, India, Japan, Pakistan, the UK, and the USA. The data were collected in November 2024. The data collection is part of an ongoing project to explore public engagement with news and information about climate change, and how people perceive, experience, and respond to its escalating impacts. The authors found that on average across the eight countries, half (50%) see, read, or hear news or information about climate change every week – showing little change from 2022 (51%). Climate news and information consumption is highest in France (60%), with lower numbers in the USA (34%) where, against the backdrop of the presidential election, there was a 16 percentage point (pp) fall from 2023. The news media continues to be the primary way people access climate change information – ahead of documentaries, social media, and interpersonal communication – with television news (31%) and online news websites/apps (24%) as the most widely used media. Video is people’s preferred format, ahead of text.
Ho'okele Mua II, a Wargame About Climate Change and Operational Risk in INDOPACOM, Rooney et al., Rand
The authors describe the development and execution of a climate change game for the U.S. Indo-Pacific Command (USINDOPACOM). The game was intended to support planning by allowing players to explore the extent of operational risk that climate change could impose on the joint force in the Indo-Pacific region in the 2040s.
Good for your Pocket. How renewable energy helps Irish electricity consumers, Alec Granville-Willett and Mark Turner, Baringa
The development of wind and solar farms has reduced the cost burden on Irish consumers by €840 million between 2000 and 2023. This saving, equivalent to €165 per person, has been realized on the power bills of all consumers by the low cost of renewable electricity. Wind and solar farms have no fuel cost and undercut more expensive gas- and coal-fired generators, displacing them from the wholesale power market.
121 articles in 50 journals by 724 contributing authors
Physical science of climate change, effects
Characteristics and potential drivers of extreme high-temperature event frequency in Eurasia, Xie et al., Dynamics of Atmospheres and Oceans 10.1016/j.dynatmoce.2025.101536
Impact of Climate Change on the Dynamics of the Southern Senegal Upwelling Center, Ndoye et al., Geophysical Research Letters Open Access 10.1029/2024gl112582
Slowed Response of Atlantic Meridional Overturning Circulation Not a Robust Signal of Collapse, Zimmerman et al., Geophysical Research Letters Open Access 10.1029/2024gl112415
Read more...
0 comments
Posted on 29 January 2025 by Guest Author
This is a re-post from the Climate Brink by Andrew Dessler
Climate denial is dead. Renewable energy denial is here. As “alternative facts” become the norm, it’s worth looking at what actual facts tell us about how renewable energy sources like solar and wind are lowering the price of electricity.
As an example that’s close to home (for me), I’ll focus on the Texas electricity market, which is run by the Electric Reliability Council of Texas, known as ERCOT.
At all times, ERCOT must balance electricity supply and demand, while keeping costs as low as possible. Let’s walk through a simplified example of how they do this.
First, ERCOT forecasts tomorrow’s electricity demand based on factors like forecast weather, historical usage patterns, and expected industrial activity. Let’s imagine that ERCOT predicts a need for 100 megawatts (MW) of power tomorrow.
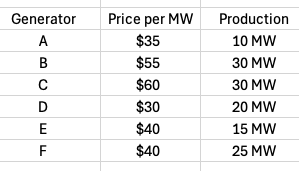
ERCOT then asks generators to make bids for how much power each one can produce and what it will cost. Let’s assume there are six different generators that bid into the market:
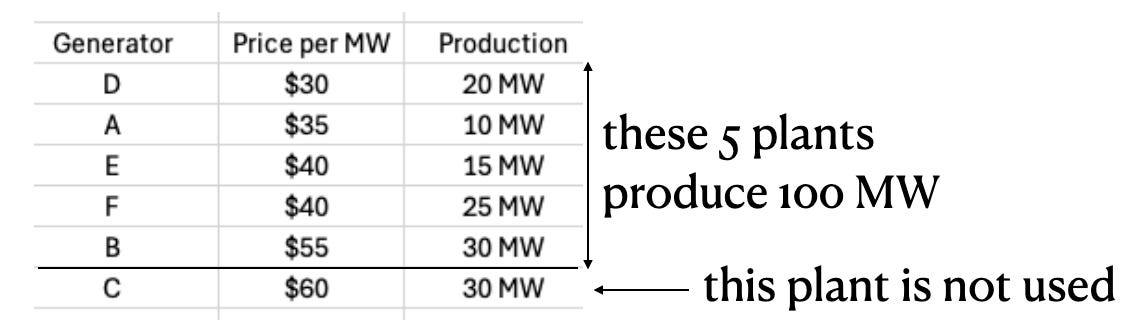
ERCOT sorts the bids by price, producing what’s known as the merit stack. ERCOT then moves down the merit stack, using generators that produce the required power (100 MW) at the lowest price.
This means generator C is out of luck — ERCOT will not be buying power from that generator.
So what is the resulting price of electricity? Rather than paying each plant a different price based on their bids, ERCOT employs what’s known as marginal pricing, in which all of the generators get paid the cost of generating the last unit of energy.
Generator B is the last generator on the stack — sometimes referred to as the marginal generator — so it produces the last unit of power. The price of that last unit is $55 per MW, so that’s what the wholesale price of electricity on this day will be. All of the generators get paid that amount regardless of how much it costs for them to produce the energy.
Read more...
0 comments
Posted on 28 January 2025 by BaerbelW
On November 1, 2024 we announced the publication of 33 rebuttals based on the report "Rebutting 33 False Claims About Solar, Wind, and Electric Vehicles" written by Matthew Eisenson, Jacob Elkin, Andy Fitch, Matthew Ard, Kaya Sittinger & Samuel Lavine and published by the Sabin Center for Climate Change Law at Columbia Law School in 2024. Below is the blog post version of rebuttal #13 based on Sabin's report.

Complete reliance on solar generation, without other sources of power generation, energy storage, long-distance transmission, or other grid flexibility resources1 (Lovins 2017), would pose intermittency challenges. However, an increasing number of planned solar projects are set to include an energy storage component2, and solar, wind, and storage together can provide the majority of the country’s electricity without compromising reliability3.
When a local service area does face diminished solar capacity, for instance during a cloudy day, wind and other renewable sources, as well as battery storage and long-distance transmission that carries power from sunnier regions can supplement energy supply, ensuring a resilient grid4 (also Jacobson 2022). As a result, increased reliance on solar energy need not require the construction of new natural gas plants for backup5. The Department of Energy’s 2021 “Solar Futures Study,” for example, outlines three distinct decarbonization scenarios, each of which assumes both a massive increase in renewable energy generation and decrease in natural gas6. Under the “business as usual” reference scenario, natural gas, oil, and steam together decrease from roughly 39% of U.S. annual electricity generation in 2020 to roughly 31% by 2035/2036 and 30% by 2049/2050; under the same scenario, solar PV increases from roughly 3.4% in 2020 to 17.6% by 2035/2036 and 27.3% by 2049/2050. Under the two non-reference decarbonization scenarios assessed in the studies, natural gas, oil, and steam shrink to roughly 4.7%-5.2% of annual electricity generation by 2035/2036 and 0% by 2049/2050; solar PV, meanwhile, increases to between 36.9% and 42.2% by 2035/2036 and to between 40.1% and 44.8% by 2049/2050. Princeton University’s Net-Zero America study, which assesses pathways to achieving net-zero GHG emissions by 2050, likewise foresees significant reductions in fossil fuel consumption and generation, even when maintaining 500-1,000 GW of firm generating capacity to ensure reliability. Across the suite of assessed net-zero scenarios, the study assumes that all thermal coal production and consumption will cease by 2030, oil production will decline between 25% to 85% by 2050, and natural gas production will decline between 20% and 90% by 2050.
California has already increased solar energy generation while decreasing natural gas utilization. In 2012, solar PV and solar thermal together accounted for only 0.9% of California’s in-state electricity generation, while natural gas accounted for roughly 70%7. By 2022, solar had increased to 19.9% of California’s in-state electricity generation, while natural gas had decreased to 47.5%8. Significantly, even with this increase in solar reliance, California’s grid reliability remains near, or above, the national average9. Elsewhere in the United States, energy experts have asserted that Texas’s widespread adoption of solar generation helped prevent outages when electricity usage spiked during a recent summer heatwave10. And although the reliability of solar and wind energy was questioned following Texas’ widespread power outages in the winter of 2021, Texas’ grid failure was primarily caused by freezing natural gas infrastructure, rather than failures at solar and wind farms, though nuclear, coal, and wind also experienced disruptions at a smaller scale11 (also Busby et al. 2021).
Energy storage also will play an important role in achieving decarbonization while improving energy reliability. The DOE’s “Solar Futures Study” forecasts that an additional 60 GW per year of storage will be needed to achieve decarbonization6. Fortunately, research on storage technologies has experienced significant breakthroughs in recent years. For example, sodium-ion batteries have emerged as a possible alternative to lithium-ion batteries, with sodium a much more abundant and less expensive material12. Researchers are likewise developing more efficient utility-scale methods for storing solar energy13.
Other researchers have highlighted energy efficiency and grid flexibility mechanisms that can complement and support solar and wind without the need for fossil fuel backup or even bulk, utility-scale energy storage (Lovins 2017). These include integrative design practices to significantly reduce the energy demands of buildings and other sectors; demand flexibility and demand response mechanisms to compensate customers for reduced energy use during peak hours; and distributed thermal and electrical storage14 (also Lovins 2018).
Finally, while solar energy is intermittent, multiple studies have shown that the panels themselves are highly reliable—with appreciably low degradation and failure rates, thus rarely requiring repair or replacement (Jordan et al. 2017, Jordan et al. 2020). A National Renewable Energy Laboratory (NREL) study found that the median failure rate for panels installed between 2000 to 2015 was five out of 10,000 annually, a rate of 0.05% (Jordan et al. 2017). Researchers have described the failure rate of residential PV inverters as “acceptable, even good,” with an inverter typically needing to be replaced only once in the lifetime of a PV system.
Read more...
1 comments
Posted on 27 January 2025 by Guest Author
This is a re-post from Yale Climate Connections by Jeff Masters
The planet was besieged by 58 billion-dollar weather disasters in 2024, ranking second-highest behind only 2023, which had 73, said insurance broker Gallagher Re in its annual report issued 17. The total damage wrought by weather disasters in 2024 was $402 billion, 20% higher than the 10-year inflation-adjusted average. (Gallagher Re’s historical database extends back to 1990.) A separate report issued January 18 by insurance broker Aon put the total damage wrought by weather disasters in 2024 at $348 billion, with 53 billion-dollar weather disasters.
Increasing numbers of billion-dollar disasters primarily driven by increases in wealth and population
Gallagher Re said that 2024 had the highest-ever number of insured billion-dollar weather disasters: 21, beating the record of 17 set in 2023 and 2020; over 40% of the insured damage was from severe thunderstorms. There has been a steep rise in the number of billion-dollar weather disasters in recent years, and most of this has been driven by increases in severe thunderstorm losses in the United States.
About 80-90% of the increase in damage resulted from factors other than climate change. This point was echoed by insurance broker Aon in a 2023 report, which found that over 80% of severe thunderstorm loss growth could be explained by factors unrelated to climate change. (Hail damage, in particular, is getting a boost from rapid growth in Texas and other Sun Belt states.) However, Gallagher Re warned that climate change amplification of weather events was leading to “weather whiplash,” with rapid shifts from one peril to another.
U.S. sees its second-highest number of billion-dollar weather disasters: 27
As discussed in our January 10 post, the inflation-adjusted tally of U.S. billion-dollar weather disasters in 2024 was 27, falling just short of the record of 28 set in 2023. The total cost of 2024’s billion-dollar weather disasters, $182.7 billion, was the fourth-highest on record in the NOAA database. The billion-dollar disasters of 2024 included 17 severe storm events, five hurricanes, one wildfire, one drought, one flood, and two winter storms. The average number of billion-dollar disasters for a full year for the most recent five years (2020–2024) is 23. Using different accounting methods, Gallagher Re tallied 33 U.S. billion-dollar weather disasters for 2024.
 Figure 1. The 27 billion-dollar U.S. weather disasters of 2024, according to NOAA.
Read more...
0 comments
Posted on 26 January 2025 by BaerbelW, Doug Bostrom
A listing of 23 news and opinion articles we found interesting and shared on social media during the past week: Sun, January 19, 2025 thru Sat, January 25, 2025.
This week's roundup is again published soleley by category. We are still interested in feedback to hone the categorization, so if you spot any clear misses and/or have suggestions for additional categories, please let us know in the comments. Thanks!
Stories we promoted this week, by category:
Climate Change Impacts
- Climate change is forcing us to rethink our sense of ‘home’ – and what it means to lose it by Talia Fell and Codie Condos Distratis , The Conversation, Jan 16, 2025
- Greenland`s lakes are getting uglier-and fast The transformation could be permanent. by Lauren Leffer, Popular Science, Jan 20, 2025
- The scariest thing about the LA fire by Simon Clark, Youtube, Jan 21, 2025
- This scientist studies climate change. Then the Los Angeles fire destroyed his home by Lauren Sommer, NPR Topics: Climate, Jan 23, 2025
- The planet had 58 billion-dollar weather disasters in 2024, the second-highest on record The world endured three of its top-20 costliest disasters on record in 2024, its fifth-deadliest wildfire, and a record three heat waves that caused more than 1,000 deaths. by Jeff Masters, Yale Climate Connections, Jan 24, 2025
Climate Policy and Politics
- Trump Targeted Scientists in His First Term. This Time, They’re Prepared. Agencies and unions have put in place new guardrails designed to limit political interference in government research. by Coral Davenport, New York Times, Jan 17, 2025
- Trump unravels US climate agenda as he promises to `drill, baby, drill` From declaring a “national energy emergency” to exiting the Paris Agreement, here is everything climate-related Trump did on Day 1. by Naveena Sadasivam, Grist, Jan 21, 2025
- Trump vows to `unleash` oil and gas drilling as he rolls back climate rules President declares energy emergency, reiterates Paris withdrawal plan and overturns emissions standards by Dharna Noor, The Guardian, Jan 21, 2025
- Sabin Center`s Online Tracking Tools Monitor Government Actions on Climate Change by Sabin Center for Climate Change Law, State of the Planet, Jan 22, 2025
- Explained: how Trump`s day one orders reveal a White House for big oil From LNG to drilling in Alaska, here’s everything you need to know about Trump’s energy and climate executive orders by Oliver Milman and Dharna Noor, The Guardian, Jan 22, 2025
- After Trump`s pullback, Bloomberg promises to fill US funding gap to UN climate body The announcement comes after Trump said the US should “immediately cease or revoke” any financial commitment made under the UNFCCC by Matteo Civillini, Climate Home News, Jan 23, 2025
- Let’s not panic by John Perona, Earthward, Jan 22, 2025
- Trump returns: Nine things to expect for the climate by Jack Marley , The Conversation, Jan 23, 2025
- Undaunted A champion for truth, science, and responsible stewardship by Jennifer Rubin, The Contrarian, Jan 24, 2025
Read more...
0 comments
Posted on 23 January 2025 by Doug Bostrom, Marc Kodack
Open access notables
Managing and mitigating future public health risks: Planetary boundaries, global catastrophic risk, and inclusive wealth, McLaughlin & Beck, Risk Analysis [perspective]:
There are two separate conceptualizations for assessing existential risks: Planetary Boundaries (PBs) and global catastrophic risks (GCRs). While these concepts are similar in principle, their underpinning literatures tend not to engage with each other. Research related to these concepts has tended to be siloed in terms of the study of specific threats and also in terms of how these are assumed to materialize; PBs attribute global catastrophes to slow-moving and potentially irreversible global changes, while GCRs focuses on cataclysmic short-term events. We argue that there is a need for a more unified approach to managing global long-term risks, which recognizes the complex and confounded nature of the interactions between PBs and GCRs. We highlight where the PB and GCR concepts overlap and outline these complexities using an example of public health, namely, pandemics and food insecurity. We also present an existing indicator that we argue can be used for monitoring and managing risk. We argue for greater emphasis on national and global ‘‘inclusive wealth’’ as a way to measure economic activity and thus to monitor and mitigate the unintended consequences of economic activity. In sum, we call for a holistic approach to stewardship aimed at preserving the integrity of natural capital in the face of a broad range of global risks and their respective regional or global manifestations.
El Niño and Sea Surface Temperature Pattern Effects Lead to Historically High Global Mean Surface Temperatures in 2023, Jiang et al., Geophysical Research Letters:
In 2023, the world experienced its highest ever global mean surface temperature (GMST). Our study underscores the pivotal significance of El Niño and sea surface temperature (SST) warming as the fundamental causes. Interannually, the increment of GMST in 2023 comprised two phases: first, gradual ocean warming associated with El Niño and the North Atlantic from January to August; second, a continued rise in land temperatures in the mid-to-high latitude regions from September onwards, influenced by SST patterns. Notably, the maturation of El Niño prolonged warming in North America through excitation of the Pacific-North American teleconnection. During the most recent 15 years, GMST has entered an accelerated warming period, primarily driven by rapid SST warming trends in the tropical Indian Ocean, tropical Atlantic, subtropical North Pacific, and North Atlantic. These decadal warming patterns, combined with El Niño, may further increase GMST, with 2023 as a particularly striking example.
Carbon emission and energy risk management in mega sporting events: challenges, strategies, and pathways, Su et al., Frontiers in Environmental Science
The study reveals that large-scale sporting events generate substantial carbon emissions and energy consumption in transportation, venue construction, and event operation. However, carbon emissions and energy usage can be significantly reduced by optimizing venue locations, promoting green transportation, and implementing energy-saving measures at all stages. This study not only provides empirical data and theoretical support for the management of carbon emissions and energy efficiency in sporting events but also proposes practical and feasible suggestions that are highly important for the sustainable development of future sporting events. The findings have reference value for policymakers and event organizers in planning and implementing energy-saving and low-carbon events, helping promote environmental governance and sustainable development in the sports sector.
Hydroclimatic extremes threaten groundwater quality and stability, Schroeter et al., Nature Communications
Heavy precipitation, drought, and other hydroclimatic extremes occur more frequently than in the past climate reference period (1961–1990). Given their strong effect on groundwater recharge dynamics, these phenomena increase the vulnerability of groundwater quantity and quality. Over the course of the past decade, we have documented changes in the composition of dissolved organic matter in groundwater. We show that fractions of ingressing surface-derived organic molecules increased significantly as groundwater levels declined, whereas concentrations of dissolved organic carbon remained constant. Molecular composition changeover was accelerated following 2018’s extreme summer drought. These findings demonstrate that hydroclimatic extremes promote rapid transport between surface ecosystems and groundwaters, thereby enabling xenobiotic substances to evade microbial processing, accrue in greater abundance in groundwater, and potentially compromise the safe nature of these potable water sources. Groundwater quality is far more vulnerable to the impact of recent climate anomalies than is currently recognized, and the molecular composition of dissolved organic matter can be used as a comprehensive indicator for groundwater quality deterioration.
Illusory implications: incidental exposure to ideas can induce beliefs, Mikell & Powell, Royal Society Open Science
Numerous psychological findings have shown that incidental exposure to ideas makes those ideas seem more true, a finding commonly referred to as the ‘illusory truth’ effect. Under many accounts of the illusory truth effect, initial exposure to a statement provides a metacognitive feeling of ‘fluency’ or familiarity that, upon subsequent exposure, leads people to infer that the statement is more likely to be true. However, genuine beliefs do not only affect truth judgements about individual statements, they also imply other beliefs and drive decision-making. Here, we consider whether exposure to ‘premise’ statements affects people’s truth ratings for novel ‘implied’ statements, a pattern of findings we call the ‘illusory implication’ effect. We argue these effects would constitute evidence for genuine belief change from incidental exposure and identify a handful of existing findings that offer preliminary support for this claim. Building upon these, we conduct three new preregistered experiments to further test this hypothesis, finding additional evidence that exposure to ‘premise’ statements affected participants’ truth ratings for novel ‘implied’ statements, including for considerably more distant implications than those previously explored. Our findings suggest that the effects of incidental exposure reach further than previously thought, with potentially consequential implications for concerns around mis- and dis-information.
Risking delay: the storylines of (bioenergy with) carbon capture and storage in Swedish parliamentary discourse, Almqvist-Ingersoll, Frontiers in Climate
Carbon Capture and Storage (CCS), along with Bioenergy with Carbon Capture and Storage (BECCS), feature heavily in climate mitigation scenarios. Nevertheless, the technologies remain controversial within the broader mitigation discourse, in part for their potential to excuse delay in more ambitious emissions reductions in the short term. Sweden has included BECCS and CCS as proposed “supplementary measures” to enable the country to meet its ambitious target of achieving net negative emissions by 2045. Hajer’s Argumentative Approach to Discourse Analysis is applied to Swedish parliamentary speeches, motions, and written questions and answers, to uncover the storylines and attendant assumptions constituting Swedish policy deliberation regarding CCS and BECCS. This study finds that by problematizing climate change as an issue of emissions, actors position CCS and BECCS within a dominant neoliberal discourse and characterize them as tools to facilitate a green transition centering on industrial and economic competitiveness. This discourse lacks detail, and risks delay by oversimplifying the needs and requirements for CCS and BECCS deployment. Meanwhile, a CCS-critical discourse acknowledges the need for negative emissions but challenges storylines portraying the technology as inexpensive or easy to deploy rapidly. If pursued, this discourse could serve to sharpen the debate about the technologies and bring planning in line with aspirations, helping to avert risks of delay.
From this week's government/NGO section:
Planetary Solvency–finding. Global risk management for human prosperity. our balance with nature, Trust et al, Institute and Faculty of Actuaries and University of Exeter
The risk of Planetary Insolvency looms unless we act decisively. Without immediate policy action to change course, catastrophic or extreme impacts are eminently plausible, which could threaten future prosperity. The global economy could face a 50% loss in GDP between 2070 and 2090 unless immediate policy action on risks posed by the climate crisis is taken. Populations are already impacted by food system shocks, water insecurity, heat stress, and infectious diseases. If unchecked, mass mortality, mass displacement, severe economic contraction, and conflict become more likely. The authors develop a framework for global risk management to address these risks and show how this approach can support future prosperity. They also show how a lack of realistic risk messaging to guide policy decisions has led to slower action than is needed. The authors propose a dashboard to provide decision-useful risk information to support policymakers to drive human activity within the finite bounds of the planet that we live on.
State of the Clean Energy Boom, Clean Power
In less than two and a half years since the passage of the Inflation Reduction Act more than 400,000 new clean energy jobs and over $422 billion in investments across 48 states and Puerto Rico have been announced. Most of the clean energy projects and jobs are located in congressional districts represented by Republicans – 405 clean energy projects and 216,322 jobs, respectively. Of the top 10 states for new clean energy jobs, half have Republican governors welcoming the local investments. The authors analyze public announcements from the private sector since the passage of the clean energy plan to demonstrate the breadth and scale of the growing clean energy economy being built across the country. It also provides a breakdown of the data by state, sector, and congressional district, as well as analyses covering projects, jobs, and investments in rural areas and disadvantaged communities across America and in districts represented by Republican members of the House of Representatives.
126 articles in 57 journals by 898 contributing authors
Physical science of climate change, effects
Atlantic overturning inferred from air-sea heat fluxes indicates no decline since the 1960s, Terhaar et al., Nature Communications Open Access 10.1038/s41467-024-55297-5
Climate Change Drives Evolution of Thermohaline Staircases in the Arctic Ocean, Lundberg & Polyakov, Journal of Geophysical Research: Oceans 10.1029/2024jc021538
Delayed onset of ocean acidification in the Gulf of Maine, Stewart et al., Scientific Reports Open Access 10.1038/s41598-024-84537-3
Dominant inflation of the Arctic Ocean’s Beaufort Gyre in a warming climate, Wang et al., Communications Earth & Environment Open Access 10.1038/s43247-025-02028-3
Read more...
0 comments
Posted on 22 January 2025 by Guest Author
This video includes personal musings and conclusions of the creator climate scientist Dr. Adam Levy. It is presented to our readers as an informed perspective. Please see video description for references (if any).
2025 has only just begun, but already climate scientists are working hard to unpick what could be in store for us. As greenhouse gas emissions continue to drive more and more climate change, the overall trend is for more global warming. But other factors - like the El Niño oscillation moving towards La Niña - will also have a major impact. So how hot will 2025 be? And how will climate change affect us in the form of extreme weather disasters? Whether that's heatwaves, floods, droughts and wildfires - like the ones ravaging Los Angeles right now?
Support ClimateAdam on patreon: https://patreon.com/climateadam
Read more...
0 comments
Posted on 21 January 2025 by BaerbelW
On November 1, 2024 we announced the publication of 33 rebuttals based on the report "Rebutting 33 False Claims About Solar, Wind, and Electric Vehicles" written by Matthew Eisenson, Jacob Elkin, Andy Fitch, Matthew Ard, Kaya Sittinger & Samuel Lavine and published by the Sabin Center for Climate Change Law at Columbia Law School in 2024. Below is the blog post version of rebuttal #12 based on Sabin's report.
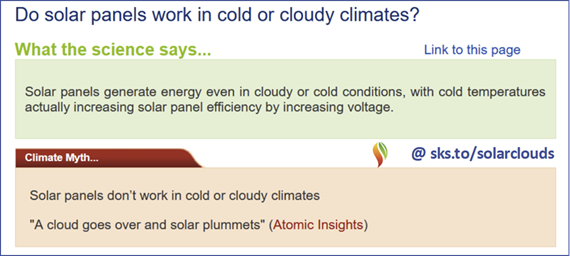
Solar panels generate energy even in cloudy or cold conditions1 (also Ramli et al. 2016). Although cloudy weather may reduce power generation by as much as 45%, substantial energy can still be generated during those conditions (Ramli et al. 2016 and Makrides et al. 2012).
Furthermore, in most instances, cold temperatures do not reduce electricity output at all—and actually increase solar panel efficiency by increasing voltage2 (also Sarmah et al. 2023). Crystalline silicon cells, which comprise approximately 84% of the U.S. market, and cadmium telluride cells, which comprise approximately 16% of the U.S. market, actually perform better in colder weather2. Only amorphous silicon cells, which represent a negligible percentage of the U.S market, experience decreased performance in colder temperatures.
Read more...
16 comments
Posted on 20 January 2025 by Zeke Hausfather
This is a re-post from the Climate Brink
I have a new paper out today in the journal Dialogues on Climate Change exploring both the range of end-of-century climate outcomes in the literature under current policies and the broader move away from high-end emissions scenarios. Current policies are defined broadly as policies in place today and a continuation of trends in technology costs, but no additional climate policy enacted for the remainder of the century.
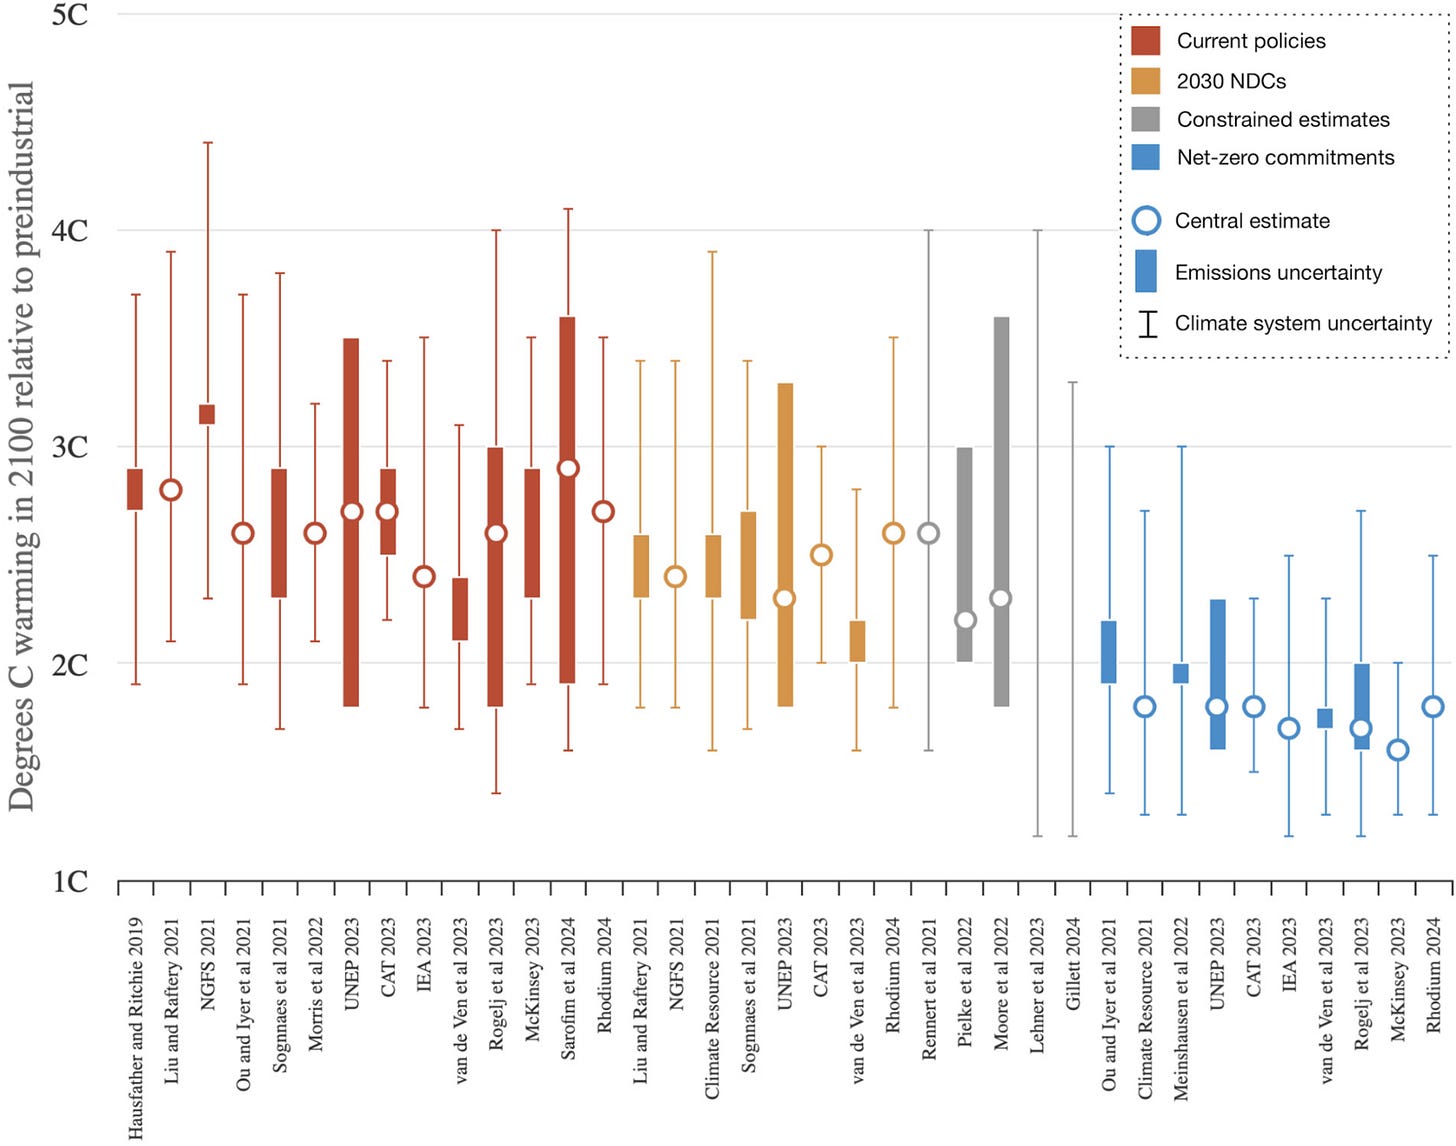
The figure below shows the literature summary I put together (as of fall 2024), which includes estimates of current policy outcomes (in red), outcomes where countries meet their 2030 Paris Agreement nationally determined contributions (in orange), constrained estimates using socioeconomic factors (or other factors) to try and estimate most likely end-of-century trajectories including future policy (in grey), and net-zero commitments made by countries (in blue).
These suggest a median estimate of future warming under current policies of 2.7C in 2100 (with a 5th-95th percentile range of central estimates spanning 2.3C to 3C). Adding in emissions uncertainties and climate system uncertainties gives a much wider range of 1.9C at the low end to 3.7C at the high end. Current policies represent something of a moving target, which complicates the interpretation of a review of recent literature; those studies from 2021 may lag behind the policy and technology environment of 2024, for example.
The push to examine the range of outcomes consistent with current policy (and a rapidly growing literature on the topic) allows us to better constrain the upper bound of plausible scenarios today. In particular, the range of current policy scenarios in the literature largely preclude emissions pathways in high-end scenarios like RCP8.5 (Riahi et al., 2011), SSP3–7.0, or SSP5–8.5 (Riahi et al., 2017) in the absence of an active reversal of current policy and current technology trends.
I’ve included a more detailed excerpt of the article below, but I’d encourage folks to read the whole (open access) piece here, as its written to be accessible to a more general audience.
Read more...
14 comments
Posted on 19 January 2025 by BaerbelW, Doug Bostrom
A listing of 25 news and opinion articles we found interesting and shared on social media during the past week: Sun, January 12, 2025 thru Sat, January 18, 2025.
This week's roundup is again published soleley by category. We are still interested in feedback to hone the categorization, so if you spot any clear misses and/or have suggestions for additional categories, please let us know in the comments. Thanks!
Stories we promoted this week, by category:
Climate Change Impacts
- Los Angeles burns: What you need to know This is terrible. This is climate change. by Andrew Dessler, The Climate Brink, Jan 13, 2025
- How Two Words from a 24-Year-Old Pasadena Climate Specialist Saved Hundreds of Lives Edgar McGregor’s timely Eaton Fire alert: ‘Get out!’ by Phil Hopkins, Local News Pasadena, Jan 11, 2025
- The Los Angeles fires won’t affect climate denial. They should. The disastrous California wildfires are another undeniable sign of the dangers of climate change. by Jennifer Rubin, Washington Post, Jan 12, 2025
- Will 2025 be the Hottest Year Ever Recorded? by Adam Levy, ClimateAdam on Youtube, Jan 13, 2025
- `Multi-year` droughts have become more frequent, drier and hotter over past 40 years Droughts spanning multiple years have become drier, hotter and more frequent over the past 40 years, according to new research. by Yanine Quiroz, Carbon Brief, Jan 16, 2025
- The media needs to show how the climate crisis is fueling the LA wildfires With few exceptions, the news has shied away from showing how the unfolding climate crisis plays a large role in the disaster by Mark Hertsgaard and Kyle Pope, The Guardian, Jan 16, 2025
- Wildfires drive record leap in global level of climate-heating CO2 Data for 2024 shows humanity is moving yet deeper into a dangerous world of supercharged extreme weather by Damian Carrington, The Guardian, Jan 17, 2025
- Los Angeles Fires Were Fueled by Climate Change Many factors, such as strong Santa Ana winds and urban planning decisions, played into the recent destructive wildfires in the Los Angeles area. But the evidence is clear that climate change contributed by Andrea Thompson , Scientific American Content: Global, Jan 17, 2025
Climate education and communication
Climate law and justice
Read more...
0 comments
Posted on 18 January 2025 by Guest Author
Skeptical Science is partnering with Gigafact to produce fact briefs — bite-sized fact checks of trending claims. This fact brief was written by Sue Bin Park from the Gigafact team in collaboration with members from our team. You can submit claims you think need checking via the tipline.
Can CO2 be ignored because it’s just a trace gas?
While carbon dioxide is a small part of the atmosphere, it has a large impact on climate as a greenhouse gas.
Nitrogen and oxygen make up around 99% of the atmosphere, but neither traps heat. Less than 0.05% of the atmosphere is made up of greenhouse gases, which do.
Without greenhouse gases, the Earth would be too cold to support most life, with average temperatures 2° F below zero (-18° C).
On the other hand, increasing greenhouse gas concentrations elevates temperatures. Human activities such as fossil fuel burning have raised CO2 concentrations from 280 parts per million in pre-industrial times to 424 parts per million in 2024. Over the same period, the planet has warmed 2° F (1.3° C) on average.
Climate scientists agree that emissions of CO2 and other greenhouse gases are responsible for this observed rise in temperature despite their relatively low concentration in the atmosphere.
Go to full rebuttal on Skeptical Science or to the fact brief on Gigafact
This fact brief is responsive to conversations such as this one.
Sources
NASA Carbon Dioxide
MIT Climate Portal How do greenhouse gases trap heat in the atmosphere?
Columbia Climate School You Asked: If CO2 Is Only 0.04% of the Atmosphere, How Does it Drive Global Warming?
NASA Steamy Relationships: How Atmospheric Water Vapor Amplifies Earth’s Greenhouse Effect
EIA Energy and the environment explained
Carbon Brief State of the climate: 2024 sets a new record as the first year above 1.5C
Read more...
12 comments
Posted on 16 January 2025 by Doug Bostrom, Marc Kodack
Open access notables
Long-term trends in heat wave gaps for the New York City metropolitan area, Lin & Colle, Urban Climate:
Heat waves occurring in close succession to one another are hazardous because of the prolonged stress on the human body and energy demand. A heat wave gap metric, the time between two adjacent heat wave events, was utilized to examine the gap length and frequency trend for several stations around New York City (NYC) during the last several decades. From 1961 to 1990 to 1991–2020, the average heat wave gap for the various stations decreased by 15–41 %, the number of short gaps (≤5 days) increased by 33–300 %, while the number of long gaps (>5 days) remained relatively constant.
Pervasive glacier retreats across Svalbard from 1985 to 2023, Li et al., Nature Communications:
A major uncertainty in predicting the behaviour of marine-terminating glaciers is ice dynamics driven by non-linear calving front retreat, which is poorly understood and modelled. Using 124919 calving front positions for 149 marine-terminating glaciers in Svalbard from 1985 to 2023, generated with deep learning, we identify pervasive calving front retreats for non-surging glaciers over the past 38 years. We observe widespread seasonal cycles in calving front position for over half of the glaciers. At the seasonal timescale, peak retreat rates exhibit a several-month phase lag, with changes on the west coast occurring before those on the east coast, coincident with regional ocean warming. This spatial variability in seasonal patterns is linked to different timings of warm ocean water inflow from the West Spitsbergen Current, demonstrating the dominant role of ice-ocean interaction in seasonal front changes. The interannual variability of calving front retreat shows a strong sensitivity to both atmospheric and oceanic warming, with immediate responses to large air and ocean temperature anomalies in 2016 and 2019, likely driven by atmospheric blocking that can influence extreme temperature variability. With more frequent blocking occurring and continued regional warming, future calving front retreats will likely intensify, leading to more significant glacier mass loss.
Profound Changes in the Seasonal Cycle of Sea Level Along the United States Mid-Atlantic Coast, Yang & Chen, Geophysical Research Letters:
The monthly mean sea level along the U.S. Mid-Atlantic Coast varies seasonally, reaching a minimum in January and a maximum in September during the 1960–2020 period. However, this seasonal cycle has changed significantly on multi-decadal timescales. In the last two decades, the annual minimum has shifted from January to February. The amplitude of seasonal changes increased by 65% from 14.16 cm in 1980–1999 to 23.16 cm in 2000–2020. Even more concerning, the maximum sea level in September rose by 82%, from 6.81 to 12.38 cm, potentially exacerbating coastal flooding over the past 20 years. A two-layer ocean model effectively replicates both the phase and magnitude of the observed changes and attributes these shifts to changes in wind stress near the coast, with relatively minor influence from deep ocean forcing. Both alongshore and cross-shore wind stress changes are found to contribute to changes in the sea level's seasonal cycle.
Compartmentalization by industry and government inhibits addressing climate denial, Hendlin & Palazzo, PLOS Climate:
The move from outright denialism by the fossil fuel and related industries to ‘soft denial’ urges reassessing the mechanisms and networks of actors involved in anti-environmentalism. One high-level tactic which harnesses evolutionary psychology and organizational self-protective tendencies to willfully overlook negative outcomes involves compartmentalization. Segmented judgment applies to multiple domains, including highlighting commitments, declarations, and philanthropy as a mask for continuing unsustainability. Selective accounting gives the impression that states and companies are doing enough on climate, that things are not as bad as they seem, and that much-touted sustainable actions compensate for continuing environmental harms–in effect reducing the impetus for responsible action and diverting attention from climate change’s primary drivers. This bait-and-switch strategy fragments climate accounting by avoiding including both sustainable and unsustainable initiatives in the same ledger. This study categorizes strategies of compartmentalization according to sectoral, narrative, political, behavioral, and structural perspectives, with examples among agrochemical, fossil, and mining industries. Each of these facets is evaluated through examples of actions undertaken by corporations and public agents, often exploiting Global North-South dynamics. In spite of these aspects having different spheres of influence, acts of compartmentalization are interconnected and represent a core background frame enabling the climate denial machine.
Networks of climate obstruction: Discourses of denial and delay in US fossil energy, plastic, and agrichemical industries, Kinol et al., PLOS Climate:
The use of fossil-derived hydrocarbons in fossil energy, plastic production, and agriculture makes these three sectors mutually reinforcing and reliant on sustained fossil fuel extraction. In this paper, we examine the ways the fossil fuel energy, plastics, and agrichemicals industries interact on social media using Twitter (renamed X as of 2023) data analysis, and we explore the implications of these interactions for policy. Content analysis of the text of tweets from the two largest US corporations and a major trade association for each sector (three discrete social media accounts for each sector) reveals coordinated messaging and identifies synergistic themes among these three sectors. Network analysis shows substantial engagement among the three sectors and identifies common external entities frequently mentioned in each sector. To understand the discursive strategies of the twitter networks of these three petrochemical derivative and fuel sectors, we propose the discourses of climate obstruction framework, adapted from and expanding on Lamb et al.’s (2020) discourses of climate delay framework. Our framework integrates both discourses of delay and discourses of denial because an integration of both were found in our analysis suggesting coordinated efforts to obstruct climate action. Our analysis suggests that discourses to deny and delay climate policy are aligned and coordinated across the three sectors to reinforce existing infrastructure and inhibit change. Exceptions in this alignment emerge for a few distinct sector-specific goals, including contrasting messages about biofuel. Despite some disparate views and different policy priorities among these three sectors, similar efforts to reinforce existing extractive petrochemical hegemony and undermine climate policy are clearly evident in each sector. These findings suggest that more research is needed to understand collaborative efforts among fossil energy, plastic, and agrichemical producers to influence climate and energy policy.
From this week's government/NGO section:
Climate Myth Debunking for Broadcast Meteorologist, Orr, George Mason University Center for Climate Change Communication, Climate Central, AMS Station Scientist Committee, AMS Committee on Hispanic and Latinx Advancement, Monash University, Bristol University
Broadcast meteorologists are in a unique position to communicate with the public about climate change. They are a highly trusted source of scientific information, and studies have shown that when broadcast meteorologists educate their audiences about climate change, their audiences gain new knowledge. However, efforts to communicate about climate change can be canceled out by misinformation. This means addressing misinformation is an important part of engaging the public about climate change. To improve effectiveness, addressing misinformation and misconceptions should be approached as a positive, educational opportunity rather than a negative, confrontational exercise. This toolkit provides interested broadcast meteorologists with evidence-based guidance on how to address climate change misinformation.
Global Climate Highlights 2024, Copernicus Climate Change Service
2024 saw unprecedented global temperatures, following on from the remarkable warmth of 2023. It also became the first year with an average temperature exceeding 1.5°C above the pre-industrial level – a threshold set by the Paris Agreement to significantly reduce the risks and impacts of climate change. Multiple global records were broken, for greenhouse gas levels, and for both air temperature and sea surface temperature, contributing to extreme events, including floods, heatwaves, and wildfires. These data highlight the accelerating impacts of human-caused climate change.
Climate Change A Factor In Unprecedented LA Fires, Madakumbura et al., Sustainable LA Grand Challenge, University of California, Los Angeles
Climate change may be linked to roughly a quarter of the extreme fuel moisture deficit when the fires began. The fires would still have been extreme without climate change, but probably somewhat smaller and less intense. Given the inevitability of continued climate change, wildfire mitigation should be oriented around (1) aggressive suppression of human ignitions when extreme fire weather is predicted, (2) home hardening strategies, and (3) urban development in low wildfire risk zones.
132 articles in 56 journals by 862 contributing authors
Physical science of climate change, effects
State Dependency of Dynamic and Thermodynamic Contributions to Effective Precipitation Changes, Braschoss et al., Journal of Climate Open Access 10.1175/jcli-d-24-0355.1
The Cloud Radiative Response to Surface Warming Weakens Hydrological Sensitivity, McGraw et al., Geophysical Research Letters Open Access 10.1029/2024gl112368
Why have extreme low-temperature events in northern Asia strengthened since the turn of the 21st century?, Hu et al., Atmospheric Research 10.1016/j.atmosres.2025.107919
Read more...
0 comments
Posted on 15 January 2025 by dana1981
This is a re-post from Yale Climate Connections
Asheville, North Carolina, was once widely considered a climate haven thanks to its elevated, inland location and cooler temperatures than much of the Southeast. Then came the catastrophic floods of Hurricane Helene in September 2024.
It was a stark reminder that nowhere is safe from climate-worsened extreme weather risks: Hurricanes arriving from the Gulf of Mexico and Atlantic seaboard. Hail in the Midwest. Floods in the East. Sea level rise along the coasts. Wildfires in the West, most recently exemplified by the devastating and costly fires around Los Angeles.
And worsening extreme weather translates into more expensive property damages, growing insurance claims, and rising insurance rates. Somebody has to pay for the costs to repair, rebuild, and replace damaged homes and vehicles, but with insurance companies raising rates and dropping customers, the situation is quickly threatening to trigger an insurance crisis.
Despite rapidly rising policy rates, the homeowner’s insurance market lost money in 18 states in 2023. As a recent Senate Budget Committee staff report concluded, climate-worsened extreme weather is “destabilizing insurance markets.”
And the problem extends beyond insurance policy costs.
“If home values fall, governments take in less tax revenue. That means less money for schools and police,” said New York Times climate change reporter Christopher Flavelle on The Daily podcast. “Maybe instead of climate change wrecking communities in the form of a big storm or a wildfire or a flood, maybe even before those things happen, climate change can wreck communities by something as seemingly mundane and even boring as insurance.”
There are no easy solutions to the problem, but there are measures individuals and governments can take to reduce risks and try to avert a widespread insurance crisis.
Insurance rates rising everywhere, especially in areas of high risk
Insurance generally operates by pooling risks. Most property owners buy home and vehicle insurance policies, and from that large pool of customers, insurance companies only have to make payouts to the few who experience costly damages. When climate change increases the frequency and intensity of disasters, insurance companies will spread the costs across the customer pool in the form of higher rates.
So even if you haven’t been directly harmed by extreme weather, you’re paying for some of the costs of those climate-worsened disasters. According to realtor.com, average U.S. home insurance rates rose nearly 34% from 2018 to 2023 – and over 11% in 2023 alone.
Some of those higher prices are related to rising inflation because repairing damaged homes has become more costly. But both home and auto insurance rates have consistently risen much faster than the rate of inflation over the past 15 years.
 How much faster than inflation average U.S. home (green) and automobile (red) insurance premiums have risen from 2008 through 2024. (Insurance premium data: Federal Reserve Bank of St. Louis. Graphic: Dana Nuccitelli.)
Read more...
5 comments
Posted on 14 January 2025 by BaerbelW
On November 1, 2024 we announced the publication of 33 rebuttals based on the report "Rebutting 33 False Claims About Solar, Wind, and Electric Vehicles" written by Matthew Eisenson, Jacob Elkin, Andy Fitch, Matthew Ard, Kaya Sittinger & Samuel Lavine and published by the Sabin Center for Climate Change Law at Columbia Law School in 2024. Below is the blog post version of rebuttal #11 based on Sabin's report.

Unsubsidized solar energy is now generally cheaper than fossil fuels. According to the International Energy Agency’s 2020 World Energy Outlook, photovoltaic solar power is “the cheapest source of new electricity generation in most parts of the world,” and “[f]or projects with low cost financing that tap high quality resources, solar PV is now the cheapest source of electricity in history1.”
Solar energy compares favorably to fossil fuels in terms of levelized cost (i.e., lifetime costs divided by lifetime energy output). According to Lazard’s April 2023 Levelized Cost of Energy Analysis, the mean unsubsidized levelized cost of utility-scale solar PV is $60/MWh2. By comparison, the mean unsubsidized levelized cost of gas combined cycle is $70/MWh, the mean unsubsidized levelized cost of coal is $117/MWh, and the mean unsubsidized levelized cost of gas peaking is $168/MWh. The figure below from Lazard shows historical mean unsubsidized LCOE values for different types of utility-scale energy generation.
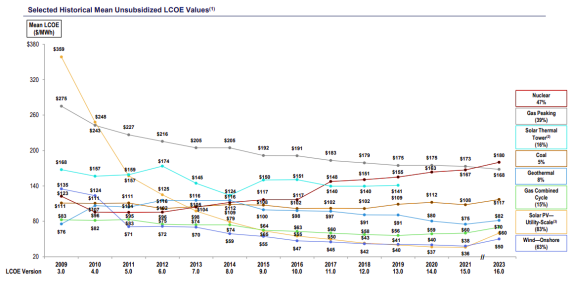
Figure 1: Selected historical mean unsubsidized LCOE values. This graph reflects the average of the high and low LCOE for each technology in each year. The percentages on the right of the figure represent the decrease in average LCOE since 2009. Source: Lazard (reproduced with permission)2.
Lazard attributes the significant historical cost declines for utility-scale renewable energy generation to decreasing capital costs, improving technologies, and increased competition, among other factors. For solar energy, as with onshore wind energy and electric vehicle batteries, historical decreases in costs have correlated with increases in cumulative capacity and sales3. As one example of decreasing costs of solar generation, the figure below from Inside Climate News shows a roughly 90% decline in solar module prices from 2011 to 20234.
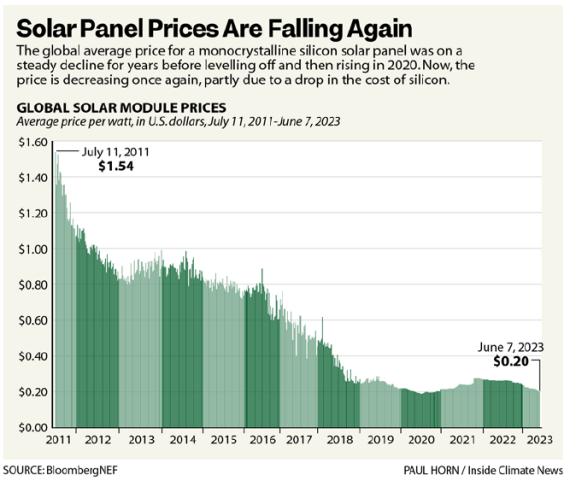
Figure 2: Solar price from 2011 to 2023. Source: BloombergNEF/Paul Horn/Inside Climate News.
In addition to the many factors reducing solar’s unsubsidized LCOE, there are substantial subsidies that will further reduce cost on a subsidized basis. In particular, the Inflation Reduction Act is predicted to reduce the subsidized LCOE for solar by 20%–35% by 20305.
Fossil fuels also receive subsidies, albeit smaller subsidies than renewable energy currently received6. In fiscal year 2022, the federal government’s tax expenditures for natural gas and petroleum subsidies were $2.1 billion.
Read more...
0 comments
Posted on 13 January 2025 by Guest Author
This is a re-post from Yale Climate Connections by Jeff Masters and Bob Henson
 Flames from the Palisades Fire burn a building at Sunset Boulevard amid a powerful windstorm on January 8, 2025 in the Pacific Palisades neighborhood of Los Angeles, California. The fast-moving wildfire had destroyed thousands of structures and burned more than 15,000 acres by Thursday, January 9. (Photo by Apu Gomes/Getty Images)
[Haz clic aquí para leer en español]
The New Year has rung in with one of the most horrific wildfire events in world history: an urban firestorm in the Los Angeles metro area that has killed at least five people and reduced thousands of homes to smoking rubble. Two major fires in excess of 10,000 acres – the Palisades fire in the western suburbs of Los Angeles, and the Eaton fire in the northern suburbs – were intensified by severe drought and driven by winds gusting up to 100 mph (161 km/hr) from a severe Santa Ana wind event.
Climate scientist Daniel Swain said on CNN that the Pacific Palisades fire alone may end up as the most expensive wildfire in history, and that he expected that collectively, the fires ravaging the region will be the costliest wildfire event in history. According to NOAA, the most expensive wildfire season on record (in 2024 USD, to account for inflation) was the $30 billion 2018 season, mostly because of severe fires in California. This included the most destructive wildfire on record – the November Camp Fire, which devastated Paradise, California, killing 85 and destroying over 18,800 buildings. That fire cost $20 billion (2024 USD), according to EM-DAT, making it the most expensive single fire in world history.
Read more...
0 comments
Posted on 12 January 2025 by BaerbelW, Doug Bostrom
A listing of 23 news and opinion articles we found interesting and shared on social media during the past week: Sun, January 5, 2025 thru Sat, January 11, 2025.
This week's roundup is again published soleley by category. We are still interested in feedback to hone the categorization, so if you spot any clear misses and/or have suggestions for additional categories, please let us know in the comments. Thanks!
Stories we promoted this week, by category:
Climate Change Impacts
- The Risks of Climate Change to the United States in the 21st Century CBO assesses how climate change will pose risks to the United States through its effects on economic activity, real estate and financial markets, human health, biodiversity, immigration, and national security. by Congressional Budget Office, Congressional Budget Office, December 19, 2024
- Climate crisis `wreaking havoc` on Earth`s water cycle, report finds Global heating is supercharging storms, floods and droughts, affecting entire ecosystems and billions of people by Damian Carrington, The Guardian, Jan 06, 2025
- Climate Change Is Making Plants Less Nutritious by Ellen Welti, New Hampshire Bulletin, Jan 02, 2025
- From Snow to Heat, Extreme Weather Events Pose Outsized Risks for Food Delivery Workers As climate change worsens, the people delivering your food are increasingly exposed to heat, wildfire smoke and other dangerous weather events. by Kiley Price, Inside Climate News, Jan 07, 2025
- The Unusually Strong Force Behind the Apocalyptic Fires in Los Angeles “This is not a typical Santa Ana.” by Umair Irfan, Vox, Inside Climate News, Jan 08, 2025
- Where have all the species gone? Understanding climate change`s toll on nature Why land protection and climate action are both vital to the future of plants and animals. by James Arnott and Kaitlin Sullivan, Yale Climate Connections, Jan 09, 2025
- Hottest year on record sent planet past 1.5C of heating for first time in 2024 Highest recorded temperatures supercharged extreme weather – with worse to come, EU data shows by Damian Carrington, The Guardian, Jan 10, 2025
- State of the climate: 2024 sets a new record as the first year above 1.5C Last year was the hottest the Earth has experienced since the start of global temperature records in the mid-1800s – and likely for many thousands of years before. by Zeke Hausfather, Carbon Brief, Jan 10, 2025
- Climate change, not endangered species protection, is a big culprit in Los Angeles fires Recent drought has left the state vulnerable to wildfires. by Johani Carolina Ponce, Yale Climate Connections, Jan 10, 2025
- ‘We’re in a New Era’: How Climate Change Is Supercharging Disasters Extreme weather events — deadly heat waves, floods, fires and hurricanes — are the consequences of a warming planet, scientists say. by David Gelles and Austyn Gaffney, New York Times, Jan 10, 2025
- 2024 Hindsight To no-one’s surprise 2024 was the warmest year on record – and by quite a clear margin. by Gavin Schmidt, RealClimate, Jan 11, 2025
- How the climate crisis fuels devastating wildfires: `We have tweaked nature and pissed it off` John Vaillant, the author of Fire Weather, explains why fires such as those in Los Angeles are different from those before by Victoria Namkung, Environment The Guardian, Jan 11, 2025
Climate Change Mitigation and Adaptation
Read more...
0 comments
Posted on 9 January 2025 by Doug Bostrom, Marc Kodack
Open access notables
Large emissions of CO2 and CH4 due to active-layer warming in Arctic tundra, Torn et al., Nature Communications:
Climate warming may accelerate decomposition of Arctic soil carbon, but few controlled experiments have manipulated the entire active layer. To determine surface-atmosphere fluxes of carbon dioxide and methane under anticipated end-of-century warming, here we used heating rods to warm (by 3.8 °C) to the depth of permafrost in polygonal tundra in Utqia?vik (formerly Barrow), Alaska and measured fluxes over two growing seasons. We show that ecosystem respiration is ~30% higher in warmed plots than in control plots (0.99 μmol m−2 s−1 versus 0.67 μmol m−2 s−1, p < 0.0001, n = 79). Additionally, the observed temperature sensitivity (Q10 of 2.8) is higher than that imposed for soil in Earth system models or reported by arctic experiments warming only the surface. A shoulder-season warming experiment revealed that rapid snow melt, which is becoming a more common event, can result in large methane emissions that may have otherwise been oxidized to carbon dioxide. Thus, warming promotes greenhouse gas emissions from the whole, deepening active layer and may contribute to climate change amplification.
Accelerated Permafrost Thaw Linked to Rising River Temperature and Widening Channels, Zhao & Li, Geophysical Research Letters:
River-controlled permafrost dynamics are crucial for sediment transport, infrastructure stability, and carbon cycle, yet are not well understood under climate change. Leveraging remotely sensed datasets, in-situ hydrological observations, and physics-based models, we reveal overall warming and widening rivers across the Tibetan Plateau in recent decades, driving accelerated sub-river permafrost thaw. River temperature of a representative section (Tuotuohe River) on the central Tibetan Plateau, has increased notably (0.39°C/decade) from 1985 to 2017, facilitating heat transfer into the underlying permafrost via both convection and conduction. Consequently, the permafrost beneath rivers warms faster (0.37°C–0.66°C/decade) and has a ∼0.5 m thicker active layer than non-inundated permafrost (0.17°C–0.49°C/decade). With increasing river discharge, the inundated area expands laterally along the riverbed (16.4 m/decade), further accelerating permafrost thaw for previously non-inundated bars. Under future warmer and wetter climate, the anticipated intensification of sub-river permafrost degradation will pose risks to riverine infrastructure and amplify permafrost carbon release.
On the economic feasibility of tidal range power plants, Pappas et al., Proceedings of the Royal Society A: Mathematical, Physical and Engineering Science:
The potential energy associated with tides presents a sustainable energy resource that remains largely untapped. Uncertainties on the economic case of tidal range power plants are a known obstacle. Research on tidal range structures suggests energy yield may be maximized through operation strategy optimization, and that impacts can be mitigated through design optimization. While instructive, these perspectives alone are insufficient to support the feasibility of individual projects. We integrate operation optimization and hydrodynamic impact analyses within a cost evaluation framework for tidal range structures focusing on capital costs (CAPEX) and levelized cost of energy (LCOE). Once benchmarked against 11 historic proposal cost projections, we perform a redesign of 18 tidal power plants to deliver a comprehensive comparative basis across a diverse range of sites in the UK. Tidal power plant operation is simulated in regional shallow-water equation models, acknowledging tide variability. The cost evaluation framework demonstrates the impact of geospatial variations on key cost components. The redesign process indicates transformative implications in that equivalent and lower LCOE values can be achieved for designs at a substantially lower CAPEX. Given how the latter hinder development, we show how tidal range schemes could be far more economically feasible than commonly perceived.
Rethinking the “Levelized Cost of Energy”: A critical review and evaluation of the concept, Emblemsvåg, Energy Research & Social Science:
The Levelized Cost of Energy (LCOE) is frequently used for policymaking worldwide, modeling and in assessing the cost competitiveness of technologies, but its formulation is deceptively simple. The result is that many caveats are obscured, but they are important to understand so that LCOE calculations can become more accurate and communicated more correctly to avoid misleading policymakers and decisionmakers. The paper discusses the approach, and how a handful of influential and reputable organizations calculate and communicate the LCOE. The conclusion is that the introduction of variable renewable energy sources into the grid has made the LCOE questionable towards it initial purpose of providing a sound basis for comparison, and most reputed organizations fail to address the issues both computationally and in their communication. However, significant improvements to regain relevance can be made by using realistic assumptions as shown by presenting a reconceptualized version of LCOE and communicate the unsolved shortcomings to stakeholders.
The changing language and sentiment of conversations about climate change in Reddit posts over sixteen years, Fariello & Jemielniak, Communications Earth & Environment:
Here, we analyze 16 years of Reddit discussions, encompassing 11.5 billion posts, to examine how language surrounding climate change has evolved over time from 2005 to 2021. We applied sentiment analysis, polarity, subjectivity, and readability metrics to discussions of “global warming” and “climate change”. We found that the use of “climate change” surpassed “global warming” in 2013, with “climate change” associated with more negative sentiment and higher subjectivity. Additionally, we observed a decline in the proportion of climate-related discussions over time despite the increasing total number of posts. These findings suggest that public engagement with climate topics on Reddit is waning, and the choice of terminology significantly influences the tone and complexity of the discourse. Our results have important implications for how climate issues are communicated and perceived by the public.
Reversal of the impact chain for actionable climate information, Pfleiderer et al., Nature Geoscience:
Escalating impacts of climate change underscore the risks posed by crossing potentially irreversible Earth and socioecological system thresholds and adaptation limits. However, limitations in the provision of actionable climate information may hinder an anticipatory response. Here we suggest a reversal of the traditional impact chain methodology as an end-user focused approach linking specific climate risk thresholds, including at the local level, to emissions pathways. We outline the socioeconomic and value judgement dimensions that can inform the identification of such risk thresholds. The applicability of the approach is highlighted by three examples that estimate the required CO2 emissions constraints to avoid critical levels of health-related heat risks in Berlin, fire weather in Portugal and glacier mass loss in High Mountain Asia. We argue that linking risk threshold exceedance directly to global emissions benchmarks can aid the understanding of the benefits of stringent emissions reductions for societies and local decision-makers.
From this week's government/NGO section:
Fueling the crisis. Climate consequences of the 2021 infrastructure law, Salerno et al., Transporation for America
In November 15, 2021, President Joe Biden signed the bipartisan Infrastructure Investment and Jobs Act (IIJA) into law. The IIJA included a five-year transportation authorization for U.S. Department of Transportation (USDOT) programs, plus a standalone infrastructure law representing the largest-ever infusion ($643 billion over five years) of federal funding for surface transportation, including highways, roads, and bridges. The White House hailed the IIJA as “a once-in-a-generation investment in our nation’s infrastructure and competitiveness,” along with making lofty promises that it would “repair and rebuild our roads and bridges with a focus on climate change mitigation, resilience, equity, and safety for all users.” Three years into this investment of infrastructure dollars, has that turned out to be the case? The authors extrapolate that states’ federal formula-funded investments made over the course of the IIJA could cumulatively increase emissions by nearly 190 million metric tonnes of emissions over baseline levels through 2040 from added driving. This is the emission equivalent of 500 natural gas-fired power plants or nearly 50 coal-fired power plants running for a year.“
Europe's state of water 2024. The need for improved water resilience, European Environment Agency
Europe's water is under significant pressure, presenting serious challenges to water security, now and in the future. As such, Europe urgently needs to improve its resilience and ensure sustainable freshwater supplies for people and the environment. Water stress is already occurring in Europe. It affects 20% of Europe's territory and 30% of the population every year, figures that are likely to increase in the future due to climate change. As climate change unfolds in Europe, managing flood risk affordably and sustainably will become increasingly important. Intense rainfall has already increased in parts of Europe, leading to floods and growing flood risks. Flooding affects human well-being and ecosystems, with potential loss of life and significant economic losses.
148 articles in 51 journals by 1047 contributing authors
Physical science of climate change, effects
Changes in Teleconnection Patterns and Land–Atmosphere Coupling Amplify the Spring–Early Summer Heatwaves Over Southwestern China, Zheng et al., International Journal of Climatology 10.1002/joc.8732
Changes in urban heat island intensity with background temperature and humidity and their associations with near-surface thermodynamic processes, Park et al., Urban Climate Open Access 10.1016/j.uclim.2024.102191
Read more...
0 comments
Posted on 8 January 2025 by Zeke Hausfather
This is a re-post from the Climate Brink
Global surface temperatures have risen around 1.3C since the preindustrial (1850-1900) period as a result of human activity. However, this aggregate number masks a lot of underlying factors that contribute to global surface temperature changes over time.
These include CO2, which is the primary driver of long-term warming, as well as non-CO2 greenhouse gases like CH4, N2O, and halocarbons. But it also includes planet-cooling aerosols that have masked a sizable portion of the warming of our greenhouse gas emissions to-date. Rounding out the list are other anthropogenic factors (tropospheric ozone, albedo changes due to land use change), and natural forcings (primarily volcanic eruptions and variations in solar output).
To disentangle the respective contributions of each of these requires a climate model. Here I will be using the latest version of FaIR, a reduced complexity climate model that has been used extensively by the community for assessing global-level changes. The implementation of FaIR used here is specifically designed to reproduce both observed climate change since pre-industrial and assessed climate metrics from the IPCC Sixth Assessment Report (AR6). This approach has the advantage of providing robust uncertainties that reflect the range of relevant parameters (e.g. climate sensitivity, carbon cycle feedback strength, ocean heat uptake rates, etc.) in-line with the ranges in the AR6.
However, unlike the climate simulations featured in the AR6, which only use climate forcings based on real-world observations through 2014 and explore different scenarios (SSPs) thereafter, these simulations use observationally-informed forcing estimate through the end of 2023 from Forster et al 2024. This has the advantage of allowing us to explore how actual changes in real-world emissions (e.g. including factors like rapid Chinese aerosol declines and low-sulfur shipping rules) have impacted global temperatures.
The figure below shows the output of 841 different emission-driven FaIR model runs across the range of constrained parameter values. It simulates both the global surface temperature response to all forcings (in yellow), as well as estimates of each forcing in isolation (calculated by comparing the difference between runs containing all forcings and those excluding one type of forcing).
Observed global surface temperatures since 1850 (black), along with modeled temperatures (yellow) and separate temperature components (other colors).
Read more...
2 comments


 Arguments