


 Arguments
Software
Resources
Comments
The Consensus Project
Translations
About
Support
Arguments
Software
Resources
Comments
The Consensus Project
Translations
About
Support
![]()
![]()
![]()
![]()
![]()
![]()
![]()
![]()
![]()
![]()


![]()


Latest Posts
- 2026 SkS Weekly Climate Change & Global Warming News Roundup #27
- Skeptical Science New Research for Week #27 2026
- Climate Adam - Is Climate Change Ramping Up El Niño Risks?
- Fact brief - Are injuries from wind turbines common?
- How bad is AI for the environment?
- 2026 SkS Weekly Climate Change & Global Warming News Roundup #26
- Skeptical Science New Research for Week #26 2026
- What Americans can learn from London’s war on cars
- New Publication: Identifying Flawed Reasoning in Contrarian Claims about Climate Change
- The Merchants of Doubt are coming for Extreme Event Attribution science
- 2026 SkS Weekly Climate Change & Global Warming News Roundup #25
- Cooking up the Climate Stripes, with Ed Hawkins
- Skeptical Science New Research for Week #25 2026
- How ‘balcony solar’ could help fight rising utility costs
- Fact brief - Does solar energy need subsidies to compete with fossil fuels?
- Plateauing CO2 emissions have slowed atmospheric growth
- 2026 SkS Weekly Climate Change & Global Warming News Roundup #24
- Skeptical Science New Research for Week #24 2026
- June update: Help still needed to get translations prepared for our website relaunch!
- How many people does heat actually kill?
- Check out the brand-new hurricane ‘cone of uncertainty’ graphics arriving this season
- 2026 SkS Weekly Climate Change & Global Warming News Roundup #23
- SkS Housekeeping: Updating the Comments Policy
- Skeptical Science New Research for Week #23 2026
- Nobody knows the future of energy
- Fact brief - Do electric vehicles almost always have a lower carbon footprint than gasoline-powered cars?
- Solar, wind, and EVs have knocked out a doomsday climate scenario
- 2026 SkS Weekly Climate Change & Global Warming News Roundup #22
- Skeptical Science New Research for Week #22 2026
- The next era of Atlantic hurricanes could be far more destructive
Comment Search Results
Search for climate model accuracy
Comments matching the search climate model accuracy:
- At a glance - Is the CO2 effect saturated?
Charlie_Brown at 09:11 AM on 4 January, 2025The paper by Kubicki, Kopczyński, and Młyńczak., “Climatic consequence of the process of saturation of radiation absorption in gases,” Applications in Engineering Science, Vol. 17, March 2024 has been retracted by Elsevier. “After review by additional expert referees, the Editor-in-Chief has lost confidence in the validity of the paper and has decided to retract.”
www.sciencedirect.com/science/article/pii/S2666496823000456
Not explained in the retraction, but according to my interpretation in addition to the previous posts, Kubicki, et al., describe the emitted intensity for one monochromatic transmittance line for methane at 3.39 microns. However, when they describe absorptance for CO2, the description changes from a single line to a spectrum. They do not integrate the intensity of single lines for all lines in the full spectrum, which is the straightforward approach used in atmospheric radiation models and climate models. Rigorous models use line-by-line calculations while simple models utilize narrow bands for calculation efficiency with minimal loss of accuracy. Instead, Kubicki, et al., introduce a definition of “saturation mass” that reaches 95% of maximum value of absorptance for a large band for an unspecified wavelength range. They support their concept by describing experiments for a detected value at the end of a tube. This experimental design does not account for re-radiation in any direction apart from a straight line.
- Climate - the Movie: a hot mess of (c)old myths!
scaddenp at 06:38 AM on 3 April, 2024Two dog. The OHC content data in red comes from the Argo array. You can find reasonable description here. The old pentadecadal data is ship-based and has much bigger error bars. I cant immediately find the paper that determined the accuracy of the Argo data but if interested I am sure I dig it out.
On interannual and to some extent the decadal scales, variations in surface temperature are strongly influenced by ocean-atmosphere heat exchange, but I think you would agree that the increasing OHC rules that out as cause of global warming?
"I did also read that the warming effect of CO2 decreases as its concentration increases so the warming is expected to reduce over time. Is there any truth in that?"
Sort of - there is a square law. If radiation increase from 200-400 is say 4W/m2, then you have to increase from CO2 from 400 to 800ppm to get 8W/m2. However, that doesnt translate directly into "warming" because of feedbacks. Water vapour is powerful greenhouse gas and its concentration in the atmosphere is directly related to temperature. Also as temperature rises, albedo from ice decreases so less radiation is reflected back. Worse, over century level scales, all that ocean heat reduces the ability of the ocean to absorb CO2. From memory, half of emissions are currently being absorbed there. Hot enough and the oceans de-gas. These are the calculation which have to go into those climate models.
Which brings us to natural sources. Geothermal heat and waste heat are insignificant so would you agree that the only natural source of that extra heat would be the sun? Now impact of sun on temperature has multiple components that climate models take into account. These are:
1/ variations in energy emitted from the sun.
2/ screening by aerosols (natural or manmade). Important in 20th century variations you see.
3/ changes in albedo (especially ice and high cloud)
4/ The concentration of greenhouse gases in the atmosphere.
Now climate scientist would say that changes to all of those can account for all past natural climate change using known physics. They would also say very high confidence that 1/ to 3/ are not a significant part of current climate change (you can see the exact amount for each calculated in the IPCC report). Why are they confident? If you were climate scientist investigating those factors, what would you want to measure to investigate there effects? Seriously, think about that and how you might do such investigations.
Is it possible there is something we dont understand at play? Of course, but there is no evidence for other factors. You can explain past and present climate change with known figures so trying to invoke the unknown seems to be clutching at straws.
- Climate - the Movie: a hot mess of (c)old myths!
diff01 at 19:38 PM on 1 April, 2024Will changing one small ingredient (0.04%) of the earth's greenhouse gases (CO2) arrest gloabal warming (if that is what is happening)?
If the scientists(?) believe this to be the case, how will it be regulated to adjust the climate to maintain an average that is not too hot or cold?
If all anti-carbon emitting policies were implemented, what says the climate will not be too cool?
The other, obvious hole in the argument for drastic economic change in the name of cooling the planet, is that the sun is not factored into the equation (by the way, I am all for increasing efficiency and reducing waste). How will the climate be regulated (say changing one greenhouse gas does the trick) if the sun's intensity changes (sun spots), the reduction in carbon emission works, and it cools too much?
Another question I have is about other factor's, such as the recent eruption at Hunga Tonga. Apparently water vapor increased by 10% in the stratosphere.
Won't that affect the climate? How do the 'models' account for nature not doing what the computers predict?
There are a myriad of other questions. I haven't watched the movie yet, but will, with interest.
When I searched for the movie, this website popped up right under the movie heading.
It's always interesting to hear from the 'true believers'.
The whole thing is a sham of biblical proportions. You need just a modicum of reasoned thought to tell you so.
Just had a quick look at your response regarding 'the sun'.
You say the 'irradiation level' has been measured with accuracy for the last 40 years, and shown little variation.
The sun has been influencing weather on earth for 4 and a half billion years. What about the earth's orbit, and it's distance from the sun?
- Water vapor is the most powerful greenhouse gas
Charlie_Brown at 07:47 AM on 16 June, 2023Actually, I think that Vidar2032 @383 is correct. When he/she says GHGs emit at a fixed temperature, I believe he/she means at the temperature of the atmosphere as fixed by the atmospheric temperature profile. The 1976 U.S. Std Atmosphere for the tropopause, where CO2 emits to space, is close to 220K, while the emitting layer of H2O vapor in the troposphere is about 240-270 K. When he/she says that the effect of increased concentration is to broaden the band, that also is correct when considering that increasing concentration strengthens weak absorption lines. Look at the Figure in Bob Loblaw @7 in his linked thread to Beer’s Law above, which Bob kindly produced for me at that time. The weak absorption lines on the wings get stronger as concentration increases. There is sufficient path length in the tropopause to bring most of the absorption lines for the CO2 band between 14-16 microns close to 1.0, which means that the emittance is close to 1.0. Stacking the strong absorption lines in the middle of the band, which means increasing the path length and bringing an emittance of close to 1.0 even closer to 1.0, is not how increasing CO2 increases the emittance. Note that increasing emittance means more energy is emitted from a colder temperature which has less intensity than the energy emitted from a lower altitude at a warmer temperature. This is in accordance with the Planck black body distribution curves that Bob presents. The difference between a black body and a gas is that a black body absorbs/emits at all wavelengths while gases absorb/emit only at wavelengths specific to their molecular structure. What would be interesting, if only I could post my own Figure, would be the HITRAN absorption lines for CO2 at conditions of the tropopause and H2O for the troposphere.
Meanwhile, Vidar’s question is an excellent opportunity to use the Univ of Chicago link to MODTRAN Infrared Light in the Atmosphere. Choose the 1976 U.S. Std Atmosphere. All one has to do is increase the water vapor scalar to 1.07 to show a 7% increase, then adjust the temperature offset until the original value is matched. It turns out to be about 0.25 C. Better, to see if 7 % is about right, set CO2 to 280, CH4 to 0.7, and Freon to 0 to get pre-industrial conditions. Save the run to background. Then change CO2 to 415, CH4 to 1.8, and Freon to 1.0 to get current conditions, adjust the temperature offset to match the starting value, and choose holding fixed relative humidity. The raw model output shows that it changes the water vapor by about 6%, and the temperature offset is about 1.0 C. It's a very good approximation, but be careful not to place too high of an expectation on the accuracy and precision of this model. Realize that it is designed to be an educational tool with high computational speed and limited flexibility that provides good results, but better models exist for professional use.
- Skeptical Science New Research for Week #50 2022
peterklein at 07:12 AM on 16 December, 2022I mostly became mostly aware of the climate and global warming issue about the time that Al Gore began beating the drum (even while he continued to fly globally in his private jet). Since then, I've read about climate change and climate modeling from many sources, including ones taking the position that ‘it is not a question if it is a big-time issue, but what to do about it now, ASAP?’.
In the past few weeks, it appeared to me there has been a of articles, issued reports, and federal government activity, including recently approved legislation, related to this topic. While it obviously has been one of the major global topics for the past 3+ decades, the amount of public domain ‘heightened activity’ seems (to me) to come in waves every 4-6 months. That said, I decided to write on the topic based on what I learned and observed over time from articles, research reports, and TV/newspaper interviews.
There clearly are folks, associations, formal and informal groups, and even governments on both sides of the topic (issue). I also have seen over the decades how the need for and the flow of money sometimes (many times?) taints the results of what appear to be ‘expert-driven and expert-executed’ quantitative research. For example, in medical research some of the top 5% of researchers have been found altering their data and conclusions because of the source of their research funding, peer ‘industry’ pressure and/or pressure from senior academic administrators.
Many climate and weather-related articles state that 95+% of researchers agree on major climate changes; however (at least to me) many appear to disagree on the short-medium-longer term implications and timeframes.
What I conclude (as of now)
1. This as a very complex subject about which few experts have been correct.
2. We are learning more and more every day about this subject, and most of what we learn suggests that what we thought we knew isn't really correct or at least as perfectly accurate as many believe.
3. The U.S. alone cannot solve whatever problem exists. If we want to do something constructive, build lots of nuclear power plants ASAP (more on that to follow)!
4. Any rapid reduction in the use of fossil fuels will devastate many economies, especially those like China, India, Africa and most of Asia. Interestingly, the U.S. can probably survive a 3 or 4% reduction in carbon footprint annually over the next 15 years better than almost any country in the world, but this requires the aforementioned construction of multiple nuclear electrical generating facilities. In the rest of the world, especially the developing world, their economies will crash, and famine would ensue; not a pretty picture.
5. I am NOT a reflexive “climate denier” but rather a real-time skeptic that humans will be rendered into bacon crisps sometime in the next 50, 100 or 500+ years!
6. One reason I'm not nearly as concerned as others is my belief in the concept of ‘progress’. Look at what we accomplished as a society over the last century, over the last 50, 10, 5 and 3 years (e.g., Moore’s Law is the observation that the number of transistors on integrated circuits doubles about every two years!). It is easy to conclude that we will develop better storage batteries and better, more efficient electrical grids that will reduce our carbon footprint. I'm not so sure about China, India and the developing world!
7. So, don't put me down as a climate denier even though I do not believe that the climate is rapidly deteriorating or will rapidly deteriorate as a result of CO2 upload. Part of my calm on this subject is because I have read a lot about the ‘coefficient of correlation of CO2 and global warming, and I really don't think it's that high. I won't be around to know if I was right in being relaxed on this subject, but then I have more important things to worry about (including whether the NY Yankees can beat Houston in the ACLS playoffs, assuming they meet!).
My Net/Net (As of Now!)
I am not a researcher or a scientist, and I recognize I know far less than all there is to know on this very complex topic, and I am not a ‘climate change denier’… but, after
also reading a lot of material over the years from ‘the other side’ on this topic, I conclude it is monumentally blown out of proportion relative to those claiming: ‘the sky is falling and fast’!
• Read or skim the book by Steven Koonin: Unsettled: What Climate Science Tells Us, What It Doesn't, and Why It Matters /April 27, 2021; https://www.amazon.com/Unsettled-Climate-Science-Doesnt-Matters/dp/1950665798
• Google ‘satellite measures of temperature’; also, very revealing… see one attachment as an example.
• Look at what is happening in the Netherlands and Sri Lanka! Adherence to UN and ESG mandates are starving countries; and it appears Canada is about to go over the edge!
• None of the climate models are accurate for a whole range of reasons; the most accurate oddly enough is the Russian model but that one is even wrong by orders of magnitude!
• My absolute favorite fact is that based on data from our own governmental observation satellites: the oceans have been rising over the last 15 years at the astonishing rate of 1/8th of an inch annually; and my elementary mathematics suggests that if this rate continues, the sea will rise by an inch sometime around 2030 and by a foot in the year 2118… so, no need to buy a lifeboat if you live in Miami, Manhattan, Boston, Los Angeles, or San Francisco!
• Attached is a recent article and a Research Report summary.
Probably the most damning is the Research Report comparison of the climate model predictions from 2000, pointing to 2020 versus the actual increase in temperature that has taken place in that timeframe (Pages 9-13). It's tough going and I suggest you just read the yellow areas on Page 9 (the Abstract and Introduction, very short) and the 2 Conclusions on Page 12. But the point is someone is going to the trouble to actually analyze this data on global warming coefficients!
My Observations and Thinking
In the 1970s Time Magazine ran a cover story about our entering a new Ice Age. Sometime in the early 1990s, I recall a climate scientist sounding the first warning about global warming and the potentially disastrous consequences. He specifically predicted high temperatures and massive floods in the early 2000’s. Of course, that did not occur; however, others picked up on his concern and began to drive it forward, with Al Gore being one of the primary voices of climate concern. He often cited the work in the 1990’s of a climate scientist at Penn State University who predicted a rapid increase in temperature, supposedly occurring in 2010 and, of course, this also did not occur.
Nonetheless many scientists from various disciplines also began to warn about global warming starting in the early 2000’s. It was this growing body of ‘scientific’ concern that stimulated Al Gore's concern and his subsequent movie. It would be useful for you to go back to that and review the apocalyptic pronouncements from that time; most of which predicted dire consequences, high temperatures, massive flooding, etc. which were to occur in 10 or 12 years, certainly by 2020. None of this even closely occurred to the extent they predicted.
That said, I was still generally aware of the calamities predicted by a large and diverse body of global researchers and scientists, even though their specific predictions did not take place in the time frame or to the extent that they predicted. As a result, I become a ‘very casual student’ of climate modeling.
Over the past 15 years climate modeling has become a popular practice in universities, think-tanks and governmental organizations around the globe. Similar to medical and other research (e.g., think-tanks, etc.) I recognized that some of the work may have been driven by folks looking for grants and money to keep them and their staff busy.
A climate model is basically a multi-variate model in which the dependent variable is global temperature. All of these models try to identify the independent variables which drive change in global temperature. These independent variables range from parts per million of carbon dioxide in the atmosphere to sunspot activity, the distance of the earth from the sun, ocean temperatures, cloud cover, etc. The challenge of a multi-variant model is first to identify all of the various independent variables affecting the climate and then to estimate the percent contribution to global warming made by a change in any of these independent variables. For example, what would be the coefficient of correlation for an increase in carbon dioxide parts per million to global warming?
You might find that an interesting cocktail party question to ask your friends “what is the coefficient of correlation between the increase in carbon dioxide parts per million and the effect on global warming?” I would be shocked if any of them even understood what you were saying and flabbergasted if they could give you an intelligent answer! There are dozens of these climate models. You might be surprised that none of them has been particularly accurate if we go back 12 years to 2010, for example, and look at the prediction that the models made for global warming in ten years, by 2020, and how accurate any given model would be.
An enterprising scientist did go back and collected the predictions from a score of climate models and found that a model by scientists from Moscow University was actually closer to being accurate than any of the other models. But the point is none were accurate! They all were wrong on the high side, dramatically over predicting the actual temperature in 2020. Part of the problem was that in several of those years, there was no increase in the global temperature at all. This caused great consternation among global warming believers and the scientific community!
A particularly interesting metric relates to the rise in the level of the ocean. Several different departments in the U.S. government actually measures this important number. You might be surprised to know, as stated earlier, that over the past 15 or so years the oceans have risen at the dramatic rate of 1/8th of an inch annually. This means that if the oceans continued to rise at that level, we would see a rise of an inch in about 8 years, sometime around 2030, and a rise of a foot sometime around the year 2118. I suspect Barack Obama had seen this data and that's why he was comfortable in buying an oceanfront estate on Martha's Vineyard when his presidency ended!
The ‘Milankovitch Theory’ (a Serbian astrophysicist Milutin Milankovitch, after whom the Milankovitch Climate Theory is named, proposed about how the seasonal and latitudinal variations of solar radiation that hit the earth in different and at different times have the greatest impact on earth's changing climate patterns) states that as the earth proceeds on its orbit, and as the axis shifts, the earth warms and cools depending on where it is relative to the sun over a 100,000-year, and 40,000-year cycle. Milankovitch cycles are involved in long-term changes to Earth's climate as the cycles operate over timescales of tens of thousands or hundreds of thousands of years.
So, consider this: we did not suddenly get a lot more CO2 in the atmosphere this year than we had in 2019 (or other years!), but maybe the planet has shifted slightly as the Milankovitch Theory states, and is now a little closer to the sun, which is why we have the massive drought. Nothing man has done would suddenly make the drought so severe, but a shift in the axis or orbit bringing the planet a bit closer to the sun would. It just seems logical to me. NASA publicly says that the theory is accurate, so it seems that is the real cause; but the press and politicians will claim it is all man caused! You can shut down all oil production and junk all the vehicles, and it will not matter per the Theory! Before the mid-1800’s there were no factories or cars, but the earth cooled and warmed, glaciers formed and melted, and droughts and massive floods happened. The public is up against the education industrial complex of immense corruption!
In the various and universally wrong ‘climate models’, one of the ‘independent’ variables is similar to the Milankovitch Theory. Unfortunately, it is not to the advantage of the climate cabal to admit this or more importantly give it the importance it probably deserves.
People who are concerned about the climate often cite an ‘increase in forest fires, hurricanes, heat waves, etc. as proof of global warming’. And many climate deniers point out that most forest fires are proven to be caused by careless humans tossing cigarettes into a pile of leaves or leaving their campfire unattended, and that there has been a dramatic decrease globally on deaths caused by various climate factors. I often read from climate alarmists (journalists, politicians, friends, etc.), what I believe are ‘knee-jerk’ responses since they are not supported by meaningful and relevant data/facts, see typical comments below:
• “The skeptical climate change deniers remind me of the doctors hired by the tobacco industry to refute the charges by the lung cancer physicians that tobacco smoke causes lung cancer. The planet is experiencing unprecedented extreme climate events: droughts, fires, floods etc. and the once in 500-year catastrophic climate event seems to be happening every other year. Slow motion disasters are very difficult to deal with politically. When a 200-mph hurricane hits the east coast and causes a trillion dollars in losses then will deal with it and then climate deniers will throw in the towel!”
These above comments may be right, but to date the forecasts on timing implications across all the models are wrong! It just ‘may be’ in 3, 10 or 50 years… or in 500-5000+ before the ‘sky is falling’ devastating events directly linked to climate occur. If some of the forecasts, models were even close to accuracy to date I would feel differently.
I do not deny there are climate related changes I just don’t see any evidence their impact is anywhere near the professional researchers’ forecasts/models on their impact as well as being ‘off the charts’ different than has happened in the past 100-1000+ years.
But a larger question is “suppose various anthropogenetic actions (e.g., chiefly environmental pollution and pollutants originating in human activity like anthropogenic emissions of sulfur dioxide) are causing global warming?”. What are they, who is doing it, and what do we do about it? The first thing one must do is recognize that this is a global problem and that therefore the actions of any one country has an effect on the overall climate depending upon its population and actions. Many in the United States focus intensely upon reducing carbon emissions in the U.S. when of course the U.S. is only 5% of the world population. We are however responsible for a disproportionate part of the global carbon footprint; we contribute about 12%. The good news is that the U.S. has dramatically reduced its share of the global carbon footprint over the past 20 years and doing so while dramatically increasing our GDP (up until the 1st Half of 2022).
Many factors have contributed to the relative reduction of the U.S. carbon footprint. Chief among these are much more efficient automobiles and the switch from coal-driven electric generation plants to those driven by natural gas, a much cleaner fossil fuel.
While the U.S. is reducing its carbon footprint more than any other country in the world, China has dramatically increased its carbon footprint and now contributes about 30% of the carbon expelled into the atmosphere. China is also building 100 coal-fired plants!
Additional facts, verified by multiple sources including SNOPES, the U.,S. government, engineering firms, etc.:
• No big signatories to the Paris Accord are now complying; the U.S. is out-performing all of them.
• EU is building 28 new coal plants; Germany gets 40% of its power from 84 coal plants; Turkey is building 93 new coal plants, India 446, South Korea 26, Japan 45, China has 2363 coal plants and is building 1174 new ones; the U.S. has 15 and is building no new ones and will close about 15 coal plants.
• Real cost example: Windmills need power plants run on gas for backup; building one windmill needs 1100 tons of concrete & rebar, 370 tons of steel, 1000 lbs of mined minerals (e.g., rare earths, iron and copper) + very long transmission lines (lots of copper & rubber covering for those) + many transmission towers… rare earths come from the Uighur areas of China (who use slave labor), cobalt comes from places using child labor and use lots of oil to run required rock crushers... all to build one windmill! One windmill also has a back-up, inefficient, partially running, gas-powered generating plant to keep the grid functioning! To make enough power to really matter, we need millions of acres of land & water, filled with windmills which consume habitats & generate light distortions and some noise, which can create health issues for humans and animals living near a windmill (this leaves out thousands of dead eagles and other birds).
• So, if we want to decrease the carbon footprint on the assumption that this is what is driving the rise in the sea levels (see POV that sea levels are not rising at: www.tiktok.com/t/ZTRChoNTg) and any increase in global temperature, we need to figure out how to convince China, India and the rest of the world from fouling the air with fossil fuels. In fact, if the U.S. wanted to dramatically reduce its own carbon footprint, we would immediately begin building 30 new nuclear electrical generating plants around the country! France produces about 85% of its electrical power from its nuclear-driven generators. Separately, but related, do your own homework on fossil fuels (e.g., oil) versus electric; especially on the big-time move to electric and hybrid vehicles. Engineering analyses show you need to drive an electric car about 22 years (a hybrid car about 15-18 years) to breakeven on the savings versus the cost involved in using fossil fuels needed to manufacture, distribute and maintain an electric car! Also, see page 14 on the availability inside the U.S. of oil to offset what the U.S. purchases from the middle east and elsewhere, without building the Keystone pipeline from Canada.
Two 4-5-minute videos* on the climate change/C02/new green deal issue, in my opinion, should be required viewing in every high school and college; minimally because it provides perspective and data on the ‘other’ side of the issue while the public gets bombarded almost daily by the ‘sky is falling now or soon’ side on climate change!
* https://www.prageru.com/video/is-there-really-a-climate-emergency and
https://www.prageru.com/video/climate-change-whats-so-alarming - Models are unreliable
One Planet Only Forever at 14:26 PM on 5 December, 2022This is new information related to the video by Spencer mentioned by EddieEvans @1312 and comments about it since then.
Roy Spencer has a November 19th 2022 blog posting titled "Canadian Summer Urban Heat Island Effects: Some Results in Alberta".
In the conclusion Spencer says:
"The issue is important because rational energy policy should be based upon reality, not perception. To the extent that global warming estimates are exaggerated, so will be energy policy decisions. As it is, there is evidence (e.g. here) that the climate models used to guide policy produce more warming than observed, especially in the summer when excess heat is of concern. If that observed warming is even less than being reported, then the climate models become increasingly irrelevant to energy policy decisions."
That is very similar to the wording by Spencer included in the comment by MA Rodger @1316. It appears to be Spencer's "New Trick" - seeking any bits of data evaluation to make-up a claim about model inaccuracy that is then claimed to mean that "Energy Policy" should be less aggressively ending fossil fuel use.
And the introduction of this blog post by Spencer makes it pretty clear he has made this line of investigation, evaluation and claim-making regarding "Energy Policy" his new focus.
- Models are unreliable
Bob Loblaw at 05:02 AM on 5 September, 2022JohnCalvinNYU:
I"m really not sure just what definition of "accurate" you are using. If you are expecting it to be "perfect", then prepare to be disappointed. Science (and life in general) does not produce perfect results. Any scientific prediction, projection, estimate, etc. comes with some sort of range for the expected results - either implicitly, or explicitly.
You will often see this expressed as an indication of the "level of confidence" in a result. (This applies to any analysis, not just models.) In the most recent IPCC Summary for Policymakers, the state that they use the following terms (footnote 4, page 4):
Each finding is grounded in an evaluation of underlying evidence and agreement. A level of confidence is expressed using five qualifiers: very low, low, medium, high and very high, and typeset in italics, for example, medium confidence. The following terms have been used to indicate the assessed likelihood of an outcome or result: virtually certain 99–100% probability; very likely 90–100%; likely 66–100%; about as likely as not 33–66%; unlikely 0–33%; very unlikely 0–10%; and exceptionally unlikely 0–1%. Additional terms (extremely likely 95–100%; more likely than not >50–100%; and extremely unlikely 0–5%) are also used when appropriate. Assessed likelihood is typeset in italics, for example, very likely. This is consistent with AR5. In this Report, unless stated otherwise, square brackets [x to y] are used to provide the assessed very likely range, or 90% interval.
So, the logical answer to your question of why models are constantly being updated or improved is so that we can increase the accuracy of the models and increase our confidence in the results. Since nothing is perfect, there is always room for improvement - even if the current accuracy is good enough for a specific practical purpose.
Models also have a huge number of different outputs - temperature, precipitation, winds, pressure - basically if it is measured as "weather" then you can analysis the model output in the same way that you can analyze weather. A model can be very accurate for some outputs, and less accurate for others. It can be very accurate for some regions, and less accurate for others. It can be very accurate for some periods of geological time, and less accurate for others. The things it is accurate for can be used to guide policy, while the things we have less confidence in we may want to hedge our bets on.
Saying "none of the climate catastrophes predicted in the last 50 years" is such a vague claim. If you want to be at all convincing in your claim, you are going to have to actually provide specific examples of what predictions you are talking about, and provide links to accurate analyses that show these predictions to be in error. Climate models have long track records of accurate predictions.
Here at SkS, you can use the search box (upper left" to search for "lessons from past climate predictions" and find quite a few posts here that look at a variety of specific predictions. (Spoiler alert: you'll find a few posts in there that show some pretty inaccurate predictions from some of the key "contrarians" you might be a fan of.)
As for Lomborg: very little he says is accurate. Or if it is accurate, it omits other important variables to such an extent that his conclusions are inaccurate. I have no idea where I would find the article of his that you mention, and no desire to spend time trying to find it. If that is your source of your "none of the climate catastrophes" claim, then I repeat: you need to provide specific examples and something better than a link to a Lomborg opinion piece.
There have been reviews, etc. posted here of previous efforts by Lomborg, such as:
https://skepticalscience.com/open-letter-to-wsj-scientist-response-to-misleading-lomborg.html
https://skepticalscience.com/lomborg-WSJ-debunk-CSRRT.html
https://skepticalscience.com/lomborg-detailed-citation-analysis.html
...and Lomborg has a page over at DesmogBlog.
In short, you're going to have to do a lot better if you expect to make a convincing argument.
- Climate's changed before
HK at 04:47 AM on 29 January, 2022How valid is the claim, in refuting man-made climate change, that the Earth's climate has changed before?
Your honor, I can’t be convicted of murder.
You see, people have been dying since before I was born.
So death is a natural thing, not caused by me. And probably nothing to worry about.
Plus, you can’t prove that I killed that guy.
Sure, I stabbed him, but all you can prove is that this caused localized cell death at the micro scale, not that it caused him to die.
People survive stabbings all the time, in fact, stabbing a scalpel in people is often healthy, doctors do it all the time!
I only stabbed 0.4% of his body, so it can’t be an issue, my stab is barely 3% of his body cavities.
And the models are so unreliable.
Doctors can’t even predict with 100% accuracy if someone will survive a surgery or not, how can they claim to suddenly know that this particular stab was bad?
Science has been wrong before!
So you see, I can’t be convicted of murder.
Now stop trying to push this radical anti-stabbing agenda.
- Models are unreliable
Bob Loblaw at 00:54 AM on 7 July, 2021MAR:
This all hinges on what is meant by "calibration", and whether or not the parameters in a model are arbitrary.
Wiktionary defines "calibrate" as "To check or adjust by comparison with a standard." When discussing climate models, this implies that there is some adjustable parameter (or seven) or input that can be varied at will to create a desired output.
There are many problems with this argument [that climate models are "calibrated" to create a result]:
- What are we calibrating for? A global 3-d climate model has thousands (if not millions) of outputs. Global mean surface temperature is one simple statistical summary of model output, but the model has temperatures that vary spatially (in 3-d) and temporally. It also has precipitation, humidity, wind speed, pressure, cloud cover, surface evaporation rates, etc. There are seasonal patterns, and patterns over longer periods of time such as El Nino. All of these are inter-related, and they cannot be "calibrated" independently. Analyzing the output of a GCM is as complex as analyzing weather observations to determine climate.
- How many input parameters are devoid of physical meaning and can be changed arbitrariiy? The more physcially-based the model is, the fewer arbitrary parameters there are. You can't simply decide that fresh snow will have an albedo of 0.4, or open water will evaporate at 30% of the potential evapotranspiration rate, just because it makes one output look better. So much of the input information is highly constrained by the need to use realistic values. All these have uncertainties, and part of the modelling process is to look at the effect of those uncertainties, but the value to use can be determined independently through measurement. It is not a case of choosing whatever you want.
So, robnyc987's claim that you can achieve 100% accuracy by "calibrating" a small set of parameters is bunkum. If climate models are so easy to "calibrate", then why do they show variations depending on who's model it is? Or depending on what the initial conditions are? That variability amongst models and model runs indicates uncertainty in the parameters, physics, and independent measurements of input variables - not "calibration".
Perhaps robnyc987 will return to provide more explanation of his claim, but I somehow doubt it.
- How much has nuclear testing contributed to global warming?
boston745 at 18:02 PM on 27 October, 2020You failed to address a single observation Ive made. You completely dismiss qualified scientists who disagree with the mainstream. And you put your faith in climate models that do not factor in things like clouds nor weakening magnetosphere. I'm sorry but it doesn't seem like you're after honest dialog.
Atmospheric scientists have learned a great deal in the past many decades about how clouds form and move in Earth's atmospheric circulation. Investigators now realize that traditional computer models of global climate have taken a rather simple view of clouds and their effects, partly because detailed global descriptions of clouds have been lacking, and partly because in the past the focus has been on short-term regional weather prediction rather than on long-term global climate prediction. To address today's concerns, we need to accumulate and analyze more and better data to improve our understanding of cloud processes and to increase the accuracy of our weather and climate models.
- The Trump EPA is vastly underestimating the cost of carbon dioxide pollution to society, new research finds
Postkey at 19:37 PM on 3 August, 2020“If the predictions of Nordhaus’s Damage Function were true, then everyone—including Climate Change Believers (CCBs)—should just relax. An 8.5 percent fall in GDP is twice as bad as the “Great Recession”, as Americans call the 2008 crisis, which reduced real GDP by 4.2% peak to trough. But that happened in just under two years, so the annual decline in GDP was a very noticeable 2%. The 8.5% decline that Nordhaus predicts from a 6 degree increase in average global temperature (here CCDs will have to pretend that AGW is real) would take 130 years if nothing were done to attenuate Climate Change, according to Nordhaus’s model (see Figure 1). Spread over more than a century, that 8.5% fall would mean a decline in GDP growth of less than 0.1% per year. At the accuracy with which change in GDP is measured, that’s little better than rounding error. We should all just sit back and enjoy the extra warmth. . . .
In this post, Keen delves into DICE (“Dynamic Integrated model of Climate and the Economy”)—the mathematical model underpinning Nordhaus’ work and the flaws in Nordhaus’ methodologies.”
- Models are unreliable
ClimateDemon at 08:12 AM on 6 July, 2020Tom Dayton @1224 and 1244
Thanks for your responses, and please understand that I am not trying to tear down the general integrity or accuracy of the current models. I do have serious concerns, however, as to how the climate science community is applying these models to conclude that humans are well on the way to toasting the entire earth with their CO2 emissions. Over the last 5-10 years, however, the only analysis I have been able to find that at least indirectly blames humans for the warming trend during the last two decades of the 20th century is the CO2 control-knob theory as explained on the Lacis et. al. paper. I did find several different authors, including John Cook, but they all said pretty much the same thing.
Now, in your statement 1224, you claimed that this was not the only model and paper that predicts the CO2 control knob and AGW. So, what I need to know is what models and papers are out there that do predict AGW, and specifically who or what the AGW community (including politicians as well as scientist) is referring to when they make swooping claims such as "scientists say that humans are causing global warming".
- Models are unreliable
scaddenp at 08:26 AM on 2 July, 2020Deplore_This: Not exactly sure what you mean by "climate temperature models referenced by the IPCC" but I assume you mean the GCMs used by CMIP to predict future climate (of which temperature is but variable that can be extracted). If this is the case, then note that these are the best means we have available to predict future climate, but by themselves say nothing about the validity of anthropogenic climate change. They could be completely wrong do to some fundimental algorithmic error which would affect their ability to infer the future, but say nothing about the accuracy of the physic of anthopogenic climate change.
The science does depend on other models (but not necessarily computer models), especially the radiative properties of gases and the Radiative Transfer Equations in particular. These have real-world applications and the detailed work was initially done by USAF because laser-guided bombs depend on them.
There are rather more direct ways of checking validity of science (eg empirical evidence). You can also directly measure the increase in surface irradiation. I rather suspect that you would agree that an increase in surface irradation because sun increased its output would warm the planet. The GHE can do that too. - Climate sensitivity is low
RedBaron at 06:52 AM on 14 May, 2020@381 Deplore This. Everyone has seen this argument. It was a well known published "merchant of doubt" argument full of logic fallicies and false premises designed to mislead people like you... which unfortunately it seems to have worked so far. However, if you are honestly seeking a University level course, I suggest you change your google search terms to "statistical modeling" and /or "statistical modeling of climate change" and you will find a whole lot of universities in the world can help you.
And yes sensitivity is a factor in all of them. In some as a constant and in a few papers there are calls for sensitivity as a variable to fine tune accuracy.
However, the statement, "The theory is based upon modeling climate sensitivity to CO2" is false. Called a false premise logic fallacy.
Actually global warming is based on empirical evidence.
- The never-ending RCP8.5 debate
nigelj at 07:35 AM on 12 January, 2020Nick Palmer @53, yes we see at least some issues the same way, and I respect your views as well.
I looked at the video, and read Barlows comment and your comment, and your debate between yourselves.
Overall I find your views the most credible. Thats the short answer.
I don't see that you were being overly insulting. You called him a fanatic just to get his attention, perhaps borderline insulting. Having got his attention, you could have been clever and then said sorry didn't mean to be too abrasive :)
But Barlow made some good points as well. Like a lot of issues the truth looks like it maybe somewhere in the middle between you guys, on some of this at least.
The thing is Barlow is an ecologist and I've noticed these sorts of people catastrophise about climate change a lot, probably to be expected as they fall in love with nature a bit. I actually respect that, but the risk is they loose objectivity and Barlow has.
Barlow is confused about the state of the science way back then. The state of the science in the 1970's and 1980's was definitely too uncertain for us to conclude we were warming the climate and should do something. The AGW signal was only confirmed in the early 1990's and even then it was not clear what the hell we should do. We had to have some real world evidence of some actual warming like this, plus detection of AGW, to confirm the theories.
But by the mid 1990s it was very clear we had a problem, and that it was serious enough to justify robust mitigation, and that we had some good mitigation options.
It's absurd of Barlow to say models in the 1970s were accurate, so action should have been taken back then. We only know they were accurate with the passing of time since then.
Regarding Barlow claiming the risks were downplayed for decades and hes claiming virtually a cover up. This is a thorny issue. I dont really think they have been on the whole. We just didn't know enough back then. It's not like the link between smoking and cancer which was quite compelling at even an early stage, so using scare tactics did make some sense.
However I do think the IPCC reports "lowball" some things a bit in recent years as I've mentioned. Whether this is political pressure or scientists being conservative is an interesting question.
Maybe I sit a little bit between you and Barlow on the whole thing. But my bottom line is if scientists put scary scenarios in front of the public, and they should, these scenarios need some pretty good evidential basis. They cannot just be speculation full of endless "what ifs".
Regarding the Australian bushfires. I dont think Climate Adam was hyping things. They definitely look very concerning. Yes more area was burned in the past but this latest fire seaon has just started. Its not unreasonable to suspect we are heading towards an absolute record setter, and climate change is a factor in it (which you did mention).
Of course your area calcs look robust to me and it was useful to mention those.
This is a tough one for me. I've sometimes done the same sort of thing as you. The hyper alarmists have sometimes made wild, exaggerated hand waving claims on various things and I have criticised their views and been labelled a luke warmer as a result which is so frustrating.
However in these posts I always mention that I think climate change is deadly serious and why, to try and get across that I'm not minimising the problem, but that we just need accuracy. I also make a point of posting alarmist science where I think it does actually have a robust basis.
Sorry for a rather nuanced reply but I'm just being honest. Hope it helps a bit.
- The five corrupt pillars of climate change denial
nigelj at 06:00 AM on 25 December, 2019blub @1
"The models are not robust at all between about 2000-2015, but have been recalibrated because of the heating hiatus during this time. This is far from settled science, but only a handful of "real" climatologists not self proclaimed climate scientists even understand climate modeling correctly."
Adding a few things. Climate models can never be 100% robust over short time frames of about 15 years, because these timeframes are modulated by ocean variability, and this does not follow a completely regular cycle. For blubs information, you cant ever accurately predict something that is partly random. Climate models are intended to model long terms trends of 30 years and more, and do this well. Scientists are aware of natural variability and the very first IPCC reports stated there would be flat periods within a longer term warming trend. The slowdown after 1998 was such a flat period.
Blub claims models have been recalibrated, but provides no evidence of this.
Blubs claims about a handful of so called real climate scientists are totally unsubstantiated arm waving.
Regarding the rest of his screed on natural variability. Cherrypicking a couple of scientific papers does not demonstrate anything. Nothing is provided to show there has been wide acceptance of these specific papers, and they do not falsify any of the models.
Models do reproduce ocean cycles, although not perfectly. However models have proven to have good accuracy at predicting multiple trends including temperatures here and here. Clearly although ocean cycles are not perfectly understood, their affects are overwhelmed by CO2.
- Climate denier scientists think these 5 arguments will persuade EU and UN leaders
Postkey at 08:17 AM on 14 September, 2019If?
“If the predictions of Nordhaus’s Damage Function were true, then everyone—including Climate Change Believers (CCBs)—should just relax. An 8.5 percent fall in GDP is twice as bad as the “Great Recession”, as Americans call the 2008 crisis, which reduced real GDP by 4.2% peak to trough. But that happened in just under two years, so the annual decline in GDP was a very noticeable 2%. The 8.5% decline that Nordhaus predicts from a 6 degree increase in average global temperature (here CCDs will have to pretend that AGW is real) would take 130 years if nothing were done to attenuate Climate Change, according to Nordhaus’s model (see Figure 1). Spread over more than a century, that 8.5% fall would mean a decline in GDP growth of less than 0.1% per year. At the accuracy with which change in GDP is measured, that’s little better than rounding error. We should all just sit back and enjoy the extra warmth.”
- The human fingerprint in the daily cycle
scaddenp at 07:13 AM on 19 July, 2019Schmidt is merely building on a long line of other papers and the paper is effectively a "quick a dirty" for the purposes of informing public discussion. From abstract:
"Much of the interest in these values is however due to an implicit
assumption that these contributions are directly relevant for the question of climate sensitivity."ie. it doesnt have a lot of relevance to the practise of climate science. Actual model codes are integrate over all gases and all absorbtion bands simultaneously. They reproduce observations of the radiation spectra with exquisite accuracy. Climate depends on how the system plays as a whole and the individual contributions of the gases in any particular atmospheric composition is of little practical interest.
- CO2 effect is saturated
jjworld at 15:09 PM on 1 July, 2019I re-read my post to make sure I didn't misstate anything and you've proven one of my points regarding proponents being less reasonable. In your third sentence of a two post response you call my comments ignorant and worthless. So you didn't even bother to follow my statements to the conclusion. That makes you unreasonable.
My initial response was to the statement from michael sweet that readers should not "waste" time trying to "understand" the science. Seriously? What about that premise is not directly on topic with this or any thread? And what part of my critique about using the scientific method are you calling ignorant and worthless?
My second portion is precise and accurate if you were willing to process it before calling my efforts ignorant and worthless. The math can be accurate and weak. Those adjectives are not mutually exclusive. Taking time to explain the language to you is far more off topic than my original post. For example, if f(x) = ax + bx and both a and b are assumptions derived from estimates, the math is potentially correct but definitely weak. Before you attack someone who is trying to learn and instruct, perhaps you should be more REASONABLE and consider the position first. My advice is to research, be skeptical and prove each point. I was responding to another poster's advice to ignore the science and trust a group of people that are still learning and evolving their positions as much as any other research group. I don't need any examples to recommend that readers not follow bad advice.
This post relates to saturation. The argument in this post is that saturation is not the issue since heat is being transferred to CO2 by convection. I'm not making up the topic, the 11 pages of comments brought up the topic as it relates to saturation. I'm directly on the topic if you cared enough to process my comments.
Since there is no mention of convection in the IPCC summary, I had to try and explain some of the details from the supporting references, all of which are already mentioned in this and other posts. So, I don't need to re-reference material here. I tried to be pithy since the post was getting long and you picked apart the abbreviated supporting points while leaving the premise untouched.
Thus far, this response is completely off topic since I'm having to defend my language which you chose to attack rather than consider. In an effort to get back on topic and honor the spirit of this site, I'll summarize as follows:
This topic suggests that the ONLY reason that the saturation argument doesn't hold is because of CO2 heat transfer via convection. For reference, read the post and the comments. I'm not arguing the math or the physics related to CO2 convection. I'm familiar with the calculations in a controlled environment. And despite your incorrect statement, the last several decades DO NOT correlate temperature and CO2. CO2 has steadily increased while the temperature spiked, leveled, and spiked again. Convection does not exhibit this pattern and cannot explain the temperature changes. In order for the convection argument to trump the saturation argument, the convection would need to involve something OTHER THAN CO2. Since the anthropogenic portion of CO2 in the atmosphere is less than 20ppm, there is no way CO2 can explain the temperature. I'm not arguing about the totality of climate change. I'm simply stating the physical limitations with the argument that CO2 convection can adequately explain the storage of IR heat in the atmosphere. The theory (and it is still a theory since the scientific method has not proven it), is that other GHGs are also contributing to convective heating. That discussion is off-topic for this post. But the IPCC math makes huge assumptions regarding the contribution of CO2 in the convective process. Are you suggesting that isn't true? And since the anthropogenic portion of CO2 is extremely small it cannot explain the totality of the temperature anomaly. The IPCC reports do cover this topic, but it goes beyond this thread's subject.
In summary, the convection story does NOT invalidate the saturation argument. This is the statement I was trying to make and encourage readers to research the topic and NOT trust the IPCC report just because one poster recommended it. Convection only explains the heat differential with one or more of the following:
1) Non CO2 GHGs are contributing more heat via convection than CO2. If this is true, than what are the ratios of those GHGs? The question remains unanswered without using a model to guesstimate the ratios. I'm a mathemetician and don't support guesstimates as scientific. (the non CO2 GHG question is beyond the scope of this thread)
2) More CO2 is coming from natural sources or indirectly caused by temperature change (thawing tundra, etc). If this is true, the CO2 is coming from temperature changes and not causing temperature changes. (the CO2 is leading or following temperature change is beyond the scope of this thread)
Regardless, the IPCC reports support my statements. My conclusion is simple. Since the source of the heat cannot be explained without assumptions on CO2 sources that cannot yet be proven, the math is unable to accurately predict future temperatures with any reasonable accuracy. From a mathematical scenario, a range of 1.5C to 4.5C is not reasonable accuracy. In the lower range, we have little change to worry about. If the upper range, we have dramatic regional climate changes. The math has a 50% error range and cannot be relied upon to divert trillions of dollars.
Other than my last sentence, I don't think many would disagree with any of my assertions. This thread is titled "Is the CO2 effect saturated?". The response to the question is YES, CO2 is saturated as it relates to radiant heat, but convection provides the difference.
To the readers, research the IPCC reports in detail since the IPCC summary does NOT mention convection. Convective heat transfer is a linear temperature model unless pressure or concentrations change. The temperature changes do not follow the path of a convection heat transfer based on the current CO2 concentrations without additional interference. There is plenty of support for this statement on this site.
Consider this article:
https://www.pnas.org/content/111/30/10943
In order to explain the current temperature trajectory, assumptions have to be made for time of year, location, and concentration. Those variables create the huge range of error in the climate models that predict 1.5C to 4.5C over a doubling of CO2. In other words, the models that predict these temperature changes still need dramatic improvements since we simply do not know how to treat all these variables under so many different conditions.
I say again, the math is not necessarily flawed, but it is weak. It relies on huge assumptions that no applied mathematician would support since each assumption adds more room for error. In other words, we don't know! CO2 does appear to be saturated for radiated IR and trapped convection doesn't explain the temperature anomaly.
But I'm "ignorant" and my comments are "worthless" according to the "reasonable" Philippe Chantreau. If only we had a scientific method to help us formulate, test, and MODIFY our hypotheses.
- Models are unreliable
AFT17170 at 07:38 AM on 31 December, 2018As I've stated in other posts, I am a non-scientist layman. I've gone through thousands of comments on this site and several articles on RealClimate. I just got done reading the article and comments over there on "30 years after Hansen’s testimony" here
Based on everything I've read so far, this is what I've internalized (please correct me as needed) — all climate models are obviously dependent upon the assumed inputs of both man-driven forcings and natural forcings, which the models use in physics-based simulations of the resulting outputs. Such models do not pretend to have intradecadal accuracy, rather the target is skill in projecting 30 year trends. Hansen was obviously required to guess those forcings, which he incorporated into 3 different scenarios. His man-driven forcings included not only CO2, but also N2O, CH4 and CFC. His CO2 forcings, in retrospect, were "pretty close" for Scenario B but he overshot on the others because humans actually tackled those other emissions. Gavin at RealClimate took a stab at adjusting Hansen's Scenario B and concluded that the adjusted results indicated a quite skillful model.
So my (perhaps dumb) question is — why not re-run the actual models with the actual man-made forcings that happened in those 3 decades, to see exactly how close the projections got for Scenario B? It seems like they might be "pretty darn close" and bolster the cause?
- Climate's changed before
Eclectic at 19:24 PM on 3 November, 2018Waterguy13 @ #614 ,
What source do you base your comment on? The earlier mainstream climate models have done a fairly good job with their projections during the past 30 years or so. They can be criticized for minor inaccuracy, in that they A) somewhat overestimated the tropical mid-trospheric "hot spot" , and B) underestimated arctic warming, and C) underestimated sealevel rise.
But on the whole, they have done quite well. In comparison, Dr Lindzen's model has done appallingly badly [he predicted cooling!] . . . and Lindzen still has difficulty acknowledging the reality of the actual ongoing global warming.
Waterguy13 , you very much need to explain your strange comment.
- Climate impacts
nigelj at 06:50 AM on 2 November, 2018Economics does not have the tools to make reliable long term predictions. Its history of prediction is poor, gdp estimates even a couple of years ahead lack accuracy, they never predicted the 2008 financial crash, or any crash really. This is because economics assumes people behave in simplistic ways when they don't, and because they take a narrow view of climate costs. This is not to say their work is useless of course, but it suggests a risk that climate costs will more likely be underestimates, and that we need to be wary.
Economics measures things in terms of profits and gdp growth. Very little attention is given to measuring happiness or human well being. The mines will keep extracting minerals even in a heatwave, to an extent and at a cost, so gdp output might march on, but its a miserable thing to live with heatwaves especially in countries that are already hot. Evidence suggests heatwaves may make parts of the world uninhabitable.
What projections are the economic models based on? The IPCC predict a worst case scenario of 10 degrees by 2100 if we go on burning fossil fuels. Economics has to consider worst case scenarios. Have they considered this, because my reading is they don't.
You don't even need an economic analysis to know worst case scenarios of 10 degrees will cost significantly.
How do you price climate tipping points? Its hard to even evaluate climate outcomes from those other than to say all the evidence suggests they will be mostly negative.
You have species loss potentially on a huge scale in worst case scenarios. How do you price this? A study I saw threw a rather arbitrary and small sum of money at this issue, but clearly many people consider loss of species a serious issue. Perhaps its an emotional thing, but this is not unimportant, and the natural world supplies approximately 50% of our pharmaceutical drugs.
Have they considered the costs of climate refugees? Causation would include heatwaves, crop losses, and loss of coastline just for starters. Look at the problem we have right now with political refugees, and you can triple that. It's not just the economic cost either, its the anxiety and tension.
Then theres the potential of refugeess leading to global conflict. Of course economists aren't bothered by wars, because gdp typically increases, but the rest of us might be bothered.
Economics is a useful tool, but a very crude too in evaluating the climate problem, and imho almost certainly underestimates the impacts.
- Human CO2 is a tiny % of CO2 emissions
lonegull at 02:19 AM on 15 October, 2018CO2 is .04% of the atmosphere, humans are 3.5% of that which comes out to be .0014% of CO2 is man made. CO2 lags temperature change in ice core samples by 800 years. Yet it is believed that man can emit a .0014% of CO2 for a mere 150 years and cause a 1.5+ degree change in climate temperature.
The weather cannot be predicted beyond several days with any accuracy, due to the complexity of the atmosphere. But we are told to believe that climate modeling can predictions 50+ years into the future is science fact.
- Models are unreliable
michael sweet at 08:54 AM on 22 April, 2018Your "luke warmers" used to argue that there was no warming. They changed their hats when it became impossible to continue with their past lies. They continue to lie to the public about the changes expected from warming. Look at the briefs submitted to the court by deniers in the case of young people suing the government. You cannot concede the possibility of sea level rise contained in the US Climate Change report which is described by its author as "very conservative".
The real difference between warmists and luke warmers is that the luke warmers are deliberately lying to the public about the dangers we face.
The models can be falsified in myriad ways. You are just making excuses. The problem is that you are listening to oil company lobbyists and not scientists. There is much more than temperature modeled. We can compare the models to ocean heat, atmospheric humidity, rainfall patterns, drought predictions, extreme storm predictions, floods, temperature changes in different areas, river flow, and many more. All these data points give us evidence of the accuracy of the models.
We already see the stronger storms, drought, flooding and sea level rise. You want to wait and see if it really gets as much worse as scientists have projected? You realize the it will continue to get worse after 2100 in any case? You want to wait until civilization collapses before you take any action?
The fact that Arhennius in 1896 made projections that are still in the range of what is expected tells us that scientists are close to the mark. How long do you need to wait? It has already been 120 years, why would we need to wait another 30? James Hansen testified to congfress in 1989, 30 years ago. Fossil fuel intrests used exactly your argument 30 years ago. Now that the future has realized we see that Hansens projections were very accurate and you say we need another 50 years to wait? Does that make sense?
You are making excuses so that you can make money while everyone younger than you will suffer. 10 years ago scientists did not use the term carastrophic global warming and the deniers (luke warmers do not exist) used that term to insult scientists. Today scientists warn of catastrophic damages and deniers say it will not be too bad. The consequences have gotton so much worse in the past ten years that it is no longer extreme for scientists to warn of castrophe.
Scientists work for 150 years to develop the knowledge to project the future climate. You do not like the projections because it means you will make less money. You say we will just have to wait and see if it is really that bad. There is a consensus that warming over 2C could threaten the collapse of civilization and you say we should wait and see what happens at 4C? That is insane.
You produce no peer reviewed papers to support you absurd claims. You dismiss Stern, Hansen and Jacobson with a handwave. You have only the opinion of a lawyer who invests heavily in fossil fuels. You ignore the evidence you are presented. Why do you waste our time here when you do not care about the evidence?
Arguing that you do not understand the consequences of material that you refuse to read is not rational.
Please do not insult us here again with your comparisons of "luke warmers" and scientists.
- Consensus on consensus
robert test at 07:45 AM on 21 January, 2018A few thoughts about the importance of consensus.
1. William – it seems to me that your comment is self-contradictory. You say
a. Consensus has little to do with science.
b. Evidence is essential to science.
c. We should base our arguments on the evidence.The use of the term ‘we’ indicates consensus concerning the evidence. Without this consensus there is no we who, you say, are to base arguments on the evidence.
The essence of science is the process of correction. As experiments are performed or as more data are gathered by a community of scientists, our understanding of physical processes increases, our instruments are improved and our measurements and our theories (i.e., models) become more precise.
Science is a communal enterprise. If you fail to get colleagues in your field to understand your experiments and theories you are failing as a scientist. If your colleagues, assuming they have reputations as capable experimentalists, are unable to replicate your findings you are failing as a scientist. It doesn’t mean that, in the end, their judgments will not be revised. It does mean, however, that the judgments of the scientific community— i.e., the consensus judgments of that community are important to the process of the scientific enterprise.
A certain measure of disagreement within the scientific community is sometimes helpful. Not all consensus or agreement is important. But deviate too far from the consensus views of this community : reject the importance of things such as measurements, experiments, data, and the use of mathematics and your ability to interact with the scientific community will come to an end. Science could not exist as an enterprise without shared views of the value of evidence, data, and instrumentation.
BBHY –
I am with you here. Evidence is only convincing if it is understood. I am not a scientist. I cannot claim to understand much at all beyond the introductory sentences of a science journal article.
I am no more capable of looking at the evidence for warming and arguing that this evidence is sufficient warrant to show that humans are causing warming than I can look at my x-rays and other medical evidence and claim that I need xyz surgery. I leave it to the scientific and medical experts to come to their conclusions. I would be a fool to disagree with the consensus of the scientific or the medical community.
William –
I agree with you on your views about rationality, mental short-cuts, biases etc. But the problem runs deeper. It affects scientists too. You say our scientific consensus is soundly based. How to we ever know this? There is no simple instrument that registers positively when consensus is soundly based.
How would we verify the accuracy of such an instrument?Right now, the scientific consensus on AGW is meeting very little opposition from credible sources. All objections to the consensus are coming from opponents based on their political and economic interests. None of the objections are coming from credible scientific sources.
So, I would argue that we think that our scientific consensus is soundly based because we have a consensus concerning how to conduct scientific inquiry – we agree on the use of data, the use of various instruments to collect that data, the use of various mathematical methods to evaluate that data, and we agree on the importance of open inquiry. Based on this consensus concerning how the scientific enterprise to to be conducted we can form a meta-consensus about the well founded basis of climate science.
Its not quite like turtles all the way down but it is turtles down a bit further than you suggest.
My point is no more than consensus is important and perhaps more important than its been treated in the comments.
- 2018 SkS Weekly Climate Change & Global Warming Digest #1
rkrolph at 04:21 AM on 8 January, 2018There was an article a couple days from someone named Brandon Morse. Sorry I don't have a link. The title was "New Study Shows Alarmist Climate Data Based Off Faulty Science...Sorry Bill Nye"
It discussed a study by Geoscientist Jeff Severinghaus at Scripps Institution of Oceanography, that claimed a new way to measure ocean heat content measuring gases trapped in ice cores. They claim that the study shows oceans have warmed much less than previously thought, which puts all the alarmist climate models in doubt. It also quotes a scientist named William Happer, who criticizes the alarmist climate models accuracy. The article seems full of denier type talk, as it makes continuous jabs at Al Gore and Bill Nye as being non-scientists, but doesn't bother to provide any real climate scientists take on the study.
But I am just wondering if anyone has any information on the validity of the study itself.
- Temp record is unreliable
randman at 08:42 AM on 25 September, 2017Tom, this is the paper by Hansen with 288 Kelvin as the mean. I think you've already seen the press comments by Hansen and Jones in 1988 of 59 degrees F and "roughly 59 degrees" respectively, right?
LINK
Obviously regardless of looking at anomalies, there is a reason they believed the mean was 59 degrees. The fact climatologists like to look at anomalies does not change that, does it? Not seeing your point.
On a wider note, this appears to be a pattern. 15 degrees was later adjusted down to 14 degrees, which had the effect of making the then present temps appear warmer, whether correctly so or not.
More recently, we've seen satellite data that showed no sea level rise to speak of "adjusted", perhaps correctly so or not, to now show sea level rise.
http://www.nature.com/news/satellite-snafu-masked-true-sea-level-rise-for-decades-1.22312
Prior to that we saw the posited warming hiatus changed by some, which changes including lowering the past means among other things. One climatologists somewhat famously has complained about this, Judith Curry. Some of her comments here:
""This short paper in Science is not adequate to explain and explore the very large changes that have been made to the NOAA data set," she wrote. "The global surface temperature data sets are clearly a moving target. So while I'm sure this latest analysis from NOAA will be regarded as politically useful for the Obama Administration, I don't regard it as a particularly useful contribution to our scientific understanding of what is going on.""
http://news.nationalgeographic.com/2015/06/150604-hiatus-climate-warming-temperature-denier-NOAA/
https://judithcurry.com/2015/07/09/recent-hiatus-caused-by-decadal-shift-in-indo-pacific-heating-2/
As I understand it, Curry was a proponent of AGW and perhaps still is in some respect, but has had problems with the way the data has been adjusted and the accuracy of the models among other things.
She's not the only scientist raises these questions. So it's not just laymen like myself who wonder why there appears to be a pattern of data that does not line up with predictions simply being "adjusted." These adjustments are not just one-off things either but a fairly consistent feature here. - Climate scientists just debunked deniers' favorite argument
nigelj at 08:38 AM on 29 June, 2017The models diverge from reality after about 2005, but only slightly. This is short term, so is most likely short term natural variation. As you say its not climate sensitivity and could be volcanic activity etc.
I would add natural variation like enso or pdo cycles could be difficult to 100% accurately incorporate into into models , as it's not perfectly regular, so you cannot read anything much into a divergence of temperatures over relatively short terms up to about 25 years.
In contrast sea level rise is slightly ahead of model estimates. Nothing from Christie on this. Again there's so much going on its hard to make completely 100% accurate predictions, but things can be more than predicted as well.
Do we do nothing on climate change because we don't as yet have 100% accuracy? It's like saying lets not treat this very sick patient, because we dont 100% understand how the body works, and can't 100% accurately predict outcomes of surgery or drugs. We would obviously treat the patient.
- Explainer: Dealing with the ‘loss and damage’ caused by climate change
nigelj at 11:15 AM on 21 June, 2017WatrWise @11, your post is a very long list of rhetorical questions. I find such long lists of questions to be by definition content free, and extremely irritating, reminding me of aggressive lawyers, so it just gets my back up, and is not conducive to open and useful discussion.
One or two perceptive rhetorical questions can clarify, but your list of over 10 is just ridiculous. We are not your students, Mr / Mss Waterwse.
It's especially frustrating because I know a simple google search would answer many of your questions, so why didn't you just do that first?
And most of your questions are off topic.
One point is worth comment because it demonstrates what I'm getting at. You say "Over 120 years and science cannot accurately predict climate change, even with evolving technology; why?"
If you had done a simple google search, or taken a more relaxed approach to your writing, instead of trying to intimidate people with long lists, you would know that some climate influences are known to be chaotic or variable (like el nino cycles) and so models will probably never be 100% accurate, no matter what technology is available, same issue as predicting outcomes of illness. But climate models have shown useful and reasonable levels of accuracy.
Sceptics like have been told this a million times, and still dont get it. I mean it gets to a point that you are just exasperating, and I dont want to know you people any more.
- 2017 SkS Weekly Climate Change & Global Warming News Roundup #18
scaddenp at 07:41 AM on 11 May, 2017SCE - tried looking for some answers by say reading the IPCC WG1 report? Or even the summary for policy makers?
"Much of the climate change debate" - not much "debate" in published science - only attempts to seed doubt by misinformation sources.
"usually in favor of spending money" - when facing a potential threat what do you expect peoples response to be? The belief that scientists must be motivated by some money-making scheme appears to be a case of projection to me. Where do you see the science being influenced by money?
"keep hearing about these glacial air bubbles that show CO2 levels increasing by 50% in the last 65 years." Wonder where you "keep hearing" that? CO2 levels are measured directly at multiple stations all round the globe - the continuous Mauna loa record goes back to 1958 - spot measurements much longer. Ice core is a way to extend that record back nearly 800,000 years and funnily enough most ice cores are from Greenland or Antarctic. Furthermore cores from diametrically opposite position deliver the same gas composition record.
Again if you read the IPCC report you would find the numerous papers that have quantified the effect of land-use change and it contribution to AGW. (small, negative, but not insignificant compared to GHG).
Does it seem to fair to you that the cost of fixing the problem should by borne by those who created the problem? If you dont fix it, then those who have contributed the least to problem are those who will bear brunt of its effects. (eg see here).
"A mathmatical model is not evidence of anything unless all the assumptions made are correct and the parameters can be measured and predicted with 100% accuracy." No parameter can be measured with 100% accuracy but yet we find mathematical models in physics extremely useful. The modern world relies on them every single day.
However, GCMs are not proof of climate theory, but they are the best we have for predicting what the consequences of various policy options will be - far ahead of examining entrails or assuming nothing will change. The question to ask is "are they skillful at predicting climate - ie the the 30 year average" and yes they are - remarkably so.
I can suggest you do a lot more reading of the actual science before leaping to unwarrented conclusions.
- 2017 SkS Weekly Climate Change & Global Warming News Roundup #18
SkepticalCivilEngineer at 05:16 AM on 11 May, 2017My first post is skeptical.
Much of the climate change debate is wheather man made CO2 is the main culprit for rising tides, melting glaceres, and higher acidity in the ocean. Coincidentally proponents of this cheering squad are usually in favor of spending money on new electrical cars, new solar pannels, and alternative energies. This changing of the energy guard ushers in new money and new profits. Unfortunately I believe their arguments are more about the money than the environment. Furthermore I don't believe they really seem cite specific sientific evidence.
For example I keep hearing about these glacial air bubbles that show CO2 levels increasing by 50% in the last 65 years. What is not clear about this information is how many data sets are there that show this phenominon and is the air trapped in the bubbles being compared to air at the same location today on a really good air quality day or a particularly bad air quality day.....or is it being compared to air above a poluted city like Beijing China? The air bubble arguments just seem very lacking to me right now..... I vow to look more at this evidence.
Whcih brings me to what concerns me. Why aren't more people talking about the changes in coastal lands and metropolitan areas have undergone in the last 2 centuries? California's Central valley used to be a swamp until it was dredged and sent out to the ocean. All the water that used to rain on the LA basin used to be absorbed into the ground. Now becasue of farming, manmade development, impervious hardscapeing, and storm facilities much more rain water water goes directy into the ocean than ever before in history. That rain water takes with it the fats, oils, greases, and fertalizers that might also be the cause the higher acidity in the oceans. This has happend in costal lands and metropolitan areas all over the world. Why isn't man made develoment, farming hydromodifcation, and storm water facilities given more of the blame for global warming?
My therory to this question is that because the cost to fix these problems will be borne by the wealthiest 2% of people who are the land owners and future land developers. It is much easier for them to sell electric cars for a profit then invest in groundwater replenishment systems which have no profit other than environmental.
I would like to finish this comment by making a statment about climate change models . A mathmatical model is not evidence of anything unless all the assumptions made are correct and the parameters can be measured and predicted with 100% accuracy. I don't see how this is possible with any climate model predicting weather, cloud patterns, development, and other naturally occuring phenominons that have changed the earth many times in the past.
When someone says the model predicts "such and such" I immedeatly want to ask does the model take into account
"this, this, this, and this?" - Increasing CO2 has little to no effect
Tom Curtis at 11:04 AM on 20 April, 2017DrBill @301, the formula for radiative forcing was not directly derived from fundamental physics. Rather, the change in Outgoing Long Wave Radiation at the tropopause, as corrected for radiation from the stratosphere after a stratospheric adjustment (which is technically what the formula determines), was calculated across a wide range of representative conditions for the Earth using a variety of radiation models, for different CO2 concentrations. Ideally, the conditions include calculations for each cell in a 2.5o x 2.5o grid (or equivalent) on an hourly basis, with a representative distribution and type of cloud cover, although a very close approximationg can be made using a restricted number of latituded bands and seasonal conditions. The results are then have a curve fitted to it, which provides the formula. The same thing can be done with less accuracy with Global Circulation Models (ie, climate models).
The basic result was first stated in the IPCC FAR 1990. That the CO2 temperature response (and hence forcing) has followed basically a logarithmic function was determined in 1896 by Arrhenius from empirical data. The current version of the formula (which uses a different constant) was determined by Myhre et al (1998). They showed this graph:

The formula breaks down at very low and very high CO2 concentrations.
- Science of Climate Change online class starting next week on Coursera
Tom Curtis at 20:24 PM on 17 April, 2017curiousd @various, it was established in 1997 by Myhre and Stordal that using a single atmospheric profile in LBL and broadband radiative models will introduce inaccuracies to the calculation. That result was confirmed by Freckelton et al (1998). Myhre and Stordal state:
"The averaging in time and space reduce the radiative forcing in the clear sky case by up to 2%. This is due to the fact that blackbody emissions are proportional to T4 and that averaging reduce or remove spatial or temporal variations."
It follows that if you really want to test Modtran for bias, you would need to use (ideally) 2.5o x 2.5o cells based on weekly averages, and take the means. Failing to do so will introduce a bias, which based in Myhre and Stordal, is approximately equal to 50% of the bias you claim to have detected.
The University of Chicago version of Modtran does not permit that, restricting choices of atmospheric profiles to a Tropical zone, two Mid Latitude zones (summer and winter) and two Subarctic zones (summer and winter). Using default values for a clear sky, and with no GHG I found the difference between the OLWR at 70 km for each case, and for a areal and temporally weighted zonal means, and for the US standard atmosphere at default temperatures, and at a temperature adjusted to match OLWR to the average incoming radiation to have a mean bias of 5.35 +/- 3.69%. Tellingly, the least bias (2.33%) was found with the weighted means. The US standard atmosphere with surface temperature set to 254.5 K showed a bias of 4.19%. Given this, the case for any significant bias in the calculation of OLWR over the range of wave numbers covered by the model is unproven. Given the wide range of biases in different scenarios, it is not clear a single correction factor would work in any case.
Further, the idea that Modtran should be adjusted to determine a single OLWR value seems wrongheaded. Modtran is intended to predict observed IR spectrums given a knowledge of surface conditions, and trace gas and temperature profiles. Here is an example of such a prediction (strictly a retrodiction):

Clearly the University of Chicago version of Modtran is capable of reasonable but imperfect predictions of such observed spectrums. Given the limited ability to reproduce actual conditions (ie, site specific surface emissivity, specific temperature profiles, density profiles, etc) we do not expect anything else, in what is simply a teaching tool. Nor is any explicit bias obvious from the example above, with OLWR at specific wave numbers sometimes being over estimated and sometimes under estimated by the model. If you trully wanted to test Modtran 6 for bias (or for error margin), you would need to compare by wavenumber across a large, but representative range of such site specific profiles.
I have not been following the technical discussion above at any depth, but it seems to me that before you get to that discussion, you need to allow for the known constraints on any radiative transfer model, regadless of its accuracy line by line. Further, you would be better directing the technica discussion to the actual use of radiative transfer models rather than their use (and potential misuse) in testing zero dimensional first approximations of the greenhouse effect.
- A Perfect (Twitter) Storm
MA Rodger at 00:50 AM on 6 April, 2017JohnFornaro @87.
The question you pose is:-
"At what point can we measure sea level rise and point to that rise as incontrovertible evidence that one or more of these models is accurately predicting sea level rise?"
We can measure sea level with enough accuracy to plot a global value for Sea Level Rise. We can therefore check whether the SLR projected by "these models" are consistent with the measured values. I would assume that when you talk of "these models" you refer to the graphical representations of SLR presented @40 and @39. Note that these projections of SLR derive from work carried out in 2012 or 2013. That is, the graph presented @40 is sourced from Horton et al (2014), a paper submitted in 2013. And that presented @39 derives from Bamber & Aspinall (2013) submitted in 2012. This means SLR data measured after "these models" were completed includes data beginning from mid-2013. Thus the SLR data as graphed @73 already includes three years of such data, a length of period you have suggested would be adequate.
Assuming all this conforms to the intention of your question, the only part of the question remaining outstanding is whether 3 years of SLR data would be adequate for the establishment of "incontovertible evidence" that "these models" are "accurate." As I made plain @77, I'm not sure what it is you are attempting to establish 'incontrovertibly', what particular aspect of "these models" you hope to estabish as "accurate" but 3 years doesn't seem long enough for anything useful to be learned given the lumpy nature of global SLR data.
- Models are unreliable
Leto at 22:30 PM on 1 April, 2017David @1039... You appear to misunderstand the nature of medical testing and medical prognostication.
You pregnancy example misses the point. Pregnancy is unusual in medicine, because it is an almost pefect binary condition - someone cannot usually be "a little bit pregnant" (ambiguous cases can actually occur, but they are rare). And of course, that binary nature partly reflects that pregnancy is not even a disease, but is instead a highly evolved biologically programmed physiological state. With pregnancy, there is little of the conceptual messiness that is usually associated with defining a disease and deciding which cases to lump together under the same categorical label. Pregnancy testing is also unusually accurate compared to nearly any other medical test you could have named.
Most medical conditions are less well-defined, and cannot be modelled with any accuracy. Although it is often known that, say, treatment A will be more effective than placebo, it is often not even known whether treatment A will be better than treatment B. Moreover, it is rarely the case that the precise disease course for an individual patient can be plotted predictively. For most cancers, for instance, a specialist will often quote an approximate median survival, which is no more than the time interval within which they expect half the patients with that cancer to die. For the individual patient, the actual surivival time is likely to diverge substantially from that median. Other times, the specialist may quote the expected 5-year survival as a percentage, but for an individual patient, 5-year survival will either be 100% or 0%, so the crude 5-year survival model does not apply.
Insisting on perfect prognostication before acting would be foolish in a medical context. If even one oncologist reported that a lung mass was an early-stage cancer, and that removing it would be associated with greatly improved median survival, then most people would have the mass removed. If a second, third and subsequent opinion is concordant, then it would be crazy to leave the mass in place, refusing to cooperate until the oncologist provides an accurate chart of its projected growth. It would be crazy to wait and confirm that the cancer really was capable of spreading to other organs, etc.
For climate science, we have the added problem that there is only one planet, and this is the first time that AGW has occurred, so we have to act before fine-tuning the prognostic model.
Don't confuse uncertainties in the fine points of prognostication with uncertainties in the diagnosis. There is no serious doubt about the planetary diagnosis at this point, and it is obvious what we need to do to fix it.
- Models are unreliable
DavidShawver at 10:01 AM on 31 March, 2017Skeptical questions from a lay person: What if the accuracy of climate models does not continue to improve as is claimed, and the current error rates in predictions of global temperature each year continue at their current rate? Is it possible that the aggregative upshot of serial errors in temperature prediction could lead to a very different result than that which is currently being predicted by the present day models? And isn't the only relevant question for members of the public whether the climate models can accurately predict what happens in the future?
I am not denying that the physical science and math and statistics that goes into climate models are not scientifically valid and independently accurate in other applications. What I am questioning is whether they have ever been demonstrated to have the level of predictive value which would be necessary to project policy 50 years into the future and beyond.
An analogy: In the realm of medicine, prior to a treatment or test being administered it must be shown that the treatment or test is effective. When we are talking about a particular method which is in essence a test (to predict increased planetary temperature) the test must be capable of predicting what it is meant to predict. For example, the law does not allow pregnancy tests to be placed on the market, when such tests have not been consistently shown effective at predicting that a woman will eventually have a baby in actual real world clinical trials.
In my mind, climate science is similar. Climate science is an amalgum of scientific techniques and human judgments that can be thought of as a particular test (albeit much more complex than a pregnancy test) which is being used in order to predict the planet's future temperature. The lay people of the world are being asked to make serious policy changes with far-reaching negative economic ramifications on the basis of this particular "test" or methodology. Therefore it stands to reason that this "test" of climate change must be able to demonstrate that it has a record of being successful in predicting global temperature changes. Can we really say that? The discrepancy in the above graph between predicted and actual seems to belie that the "test" is really there yet. By the way, the same problem of lack of sufficient demonstrated predictive value for the purposes asked also exists in the political world, where everyone was wrong about Trump's chances.
- Models are unreliable
SemiChemE at 13:39 PM on 23 March, 2017Tom Curtis @1034, Thanks for understanding the point I was trying to make and giving a better explanation than I could have (see post #1035) for why paleoclimate data from >30million years ago may not be useful for predicting the earth's climate sensitivity to CO2 in modern times.
As for my conclusion, your post suggests I was not clear in stating my conclusion, since your argument appears to be about the likely range of climate sensitivities. I did cite a paper (or papers) that reflect a lower climate sensitivity, but my point in doing so was to highlight potential flaws in the models that might cause them to make improper predictions about future climate trends.
My intended conclusion was that climate models are still quite crude and unreliable for predicting the future climate. I do have hope that the models will get better over time, especially in light of modern data collection techniques (eg. Satellites, Argo sensors, etc...), which will enable modellers to reduce the acceptable ranges of the parameters that are currently used to adjust the model outputs.
I also argued that paleoclimate data is not sufficient to completely validate any given model due to
1. Limitted accuracy and precision
2. Poor temporal resolution
3. Significant gaps in global coverage
4. Limited visibility to important historical factors, including cloud behavior, aerosol and particulate variations, Ocean Currents, etc...Finally, while I believe my statements about Paleoclimate data to be true, I am certain there is a literal army of climate scientists working to address these shortcomings and I would welcome any suggestions for a good summary on the latest state of the art in understanding our planet's climate history.
- Models are unreliable
SemiChemE at 13:42 PM on 22 March, 2017Glenn Tamblyn @1021 & 1023 and scaddenp @1028
The paleoclimate data is interesting, but I have concerns about how relevant it is for our world today and for predicting climate dynamics into the future. My biggest concern is that climate sensitivity is likely highly dependent on the prevailing ocean circulation patterns, since these dominate the heat exchange between the atmosphere and the oceans, thus amplifying or moderating greenhouse gas effects. For this reason I would be very skeptical of any conclusions based on data older than ~30 million years, since at that time the modern continents were still forming and ocean circulation must have been different. Presumably, there are other such factors that would make even more recent data of questionable value, though I'm no expert on the topic and would be interest to hear from anyone with such knowledge. Specifically, how relevant is paleoclimate data to today's world and how far back do we still have a modern climate system (eg. modern ocean and jetstream circulation patterns)?
My next concern is the accuracy and precision of the available climate record. During the instrument era (~200 years), we have daily, monthly, and yearly data, accurate to within tenths of a degree. By contrast, the error bars for paleo reconstructions are surely much larger, probably on the order of degrees or even tens of degrees. Furthermore, depending on the particular proxies, they often represent annual or at best seasonal averages. Thus, it becomes hard to distinguish a short-term period of extreme temperatures from a longer bout of moderate temperatures.
Finally, as I mentioned before, the paleo data is somewhat geographically sparse. So, what is interpreted as a large gobal climate shift may simply be a local, temporary abberation.
Now, I'll shift back to the topic at hand, which is"How reliable are climate models?". The problem is that if the data set against which you are validating the model has large error bars, significant uncertainties in the temporal resolution, and large spacial gaps, it becomes too easy to tweak the model such that it fits the data, but for the wrong reasons. For example, one of the biggest challenges for the models is handling cloud coverage. The unit cells are often much larger than individual clouds, so parameterizations must be used to represent cloud coverage. This means the entire cell has some "average cloud effect", which may or may not reflect reality. The result is that the model includes a "fudge factor" of cloud coverage, which cannot be independently verified.Another such factor involves aerosols and particulates (think Sea-spray or Dust storms). In these cases, you need to know both the variation in the particle and aerosol densities, as well as the sensitivity of the climate to these densities. Clouds, particulates, and aerosols are important phenomena, which are known to impact global temperature and climate, so you can't ignore them, but we are just beginning to understand the factors that drive them, so by necessity our current models are quite crude. This means, we can probably "fit" many models to match paleo data, but it doesn't mean we are doing it correctly or that those models will be able to predict the future climate.
Only in the satellite era are we beginning to get the proper instrumentation, so that we can monitor cloud, aerosol, and particulate densities so as to verify that the assumptions that are put into the models are reasonable. Because of this, I would say that our current models are not very reliable, but there is hope that within the coming decades they will become much better.
- Models are unreliable
SemiChemE at 14:22 PM on 14 March, 2017Rob Honeycutt @1016 - My understanding is that one of the largest sources of natural climate variability is the Pacific Decadal Oscillation. I am by no means an expert, but my understanding is that this phenomenon has a period of 50-70 years (see wikipedia). As stated before, we are roughly 40 years into the satellite era, so presumably we have observed roughly 2/3's of one cycle with a relatively dense data set (eg. the satellite record). I believe that once we have observed a complete cycle (or perhaps even a bit sooner), our understanding of this major natural process will greatly improve and as a result, our ability to model it properly will also improve. Thus, I'm anticipating a significant advance in the modeling accuracy within the next two decades. Presumably, this will lead to significant improvements in the precision and accuracy of model-based ECS estimates.
Note, I'm not saying that the satellite data set is perfect or the best temperature measurement, but it is the only set with nearly complete coverage of the earth's atmosphere. Thus it is the natural data set for use in calibration and validation of models designed to cover the atmosphere.
- Models are unreliable
SemiChemE at 15:00 PM on 13 March, 2017I'm new here, but here's a quick intro, I'm a chemical engineer with approximately 20 years experience in the semiconductor industry. A significant portion of that time involved computational fluid dynamics (CFD) modeling of reacting flows. Thus, I'm quite familiar with the capabilities and limitations of CFD models. All GCMs are at heart, large-scale CFD models.
@1003 - The video gives a nice overview of the climate models for the layman, but I can't help but think the scientists are downplaying many of the model limitations.
Yes, for most of the phenomena of interest the basic physics are pretty well understood, but to model them on a planetary scale, gross simplifying assumptions must be made due to computational limitations. The skill of the model is intimately tied to the accuracy of these assumptions and that is where the model can easily go astray.
Dr. Judith Curry gives a pretty good summary for the layman of some of the most salient model limitations in an article linked here:
https://wattsupwiththat.com/2017/02/21/curry-computer-predictions-of-climate-alarm-are-flawed/
The bottom line is that while some of the approximations are extremely accurate, by necessity the models for some processes are quite crude. This latter set, varies from model to model depending on the specific model purpose and is one reason for the spread in reported model results. It is these crude approximations that ultimately must be tuned to fit the available data, but with such tuning comes the ever present risk of getting the right answer for the wrong reason, in which case there is no guarantee that the model will be useful for future predictions.
If we had several earths to experiment on, we could run multiple experiments with different forcing conditions and sort out the various contributions of different effects, but since we have only one earth, we don't have any way to completely distinguish the impact of the various forcings (eg. CO2 levels, solar radiation, cloud formation, SO2 and aerosols, Natural variability, etc...) from each other. This means we have to make educated guesses about the various sensitivities. Over time, these guesses will get better, as we get more data to compare them to and we better understand the various sources of natural variaton (eg El Nino/La Nina).
However, at the moment, we really only have about 40 years of reliable, high-density data (the satellite era) and we're trying to decouple the impact of increasing CO2 from a natural variability signal that also seems to have a 30-60 year period. Dr. Curry contends that the due to such factors, the IPCC has over-estimated the sensitivity of the climate to CO2, possibly by as much as a factor of two.
If true, this means that climate change will happen much more slowly and to a lesser degree than originally predicted.
- There's no empirical evidence
Tom Curtis at 09:15 AM on 20 December, 2016Jeff18 @315, the temperature response to increased CO2 in the atmosphere approximates to a linear increase for each doubling of CO2. Thus, you will get the same temperature response for increasing the CO2 concentration from 140 ppmv to 280 ppmv (ie, from half the industrial to the industrial concentration) as you would for increasing it from 280 to 560 ppmv.
Clearly this relationship does not hold across all concentrations of CO2, for if it did, there would be an infinite temperature increase from 0 ppmv to any finite value. Checking with modtran, the relationship holds from approximately from 16 to 4000 ppmv, ie, the full range of reasonable expectations of past and future CO2 concentrations on Earth - but it is not straighforwardly transferable to the situation on Venus.
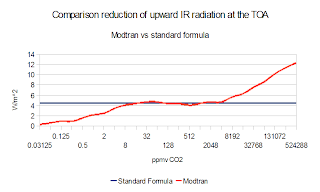
Further complicating things, temperature varies with the fourth root of energy, so that a linear increase in forcing (W/m^2) will be associated with a less than linear increase in temperature, particularly when there is not fluid H2O on the planet as with Venus. Consequently no simple rule of thumb formula will give very accurate results for the effect in changes in CO2 concentration for Venus. This is important because applying the loglinear (linear increase with each doubling) mentioned by Tristan as a best approximation would lead us to expect a surface temperature on Venus elevated by only 80oK, which is far to small. Better results can be obtained by using the formula that surface temperature equals the lapse rate times the effective altitude or radiation to space of IR radiation from the atmosphere, where that altitude is determined by radiation models of Venus' atmosphere. Better still is the application of the full theory of the greenhouse in the form of climate models, which can predict with reasonable accuracy the actual surface temperature (and have done so since 1980).
Finally, I suggest you read this post by Chris Colose, and that we conduct any further discussion on this in that thread (where it is on topic).
- There's no correlation between CO2 and temperature
Tom Curtis at 22:14 PM on 11 December, 2016john warner @139:
1)
"If you do a runs test on carbon dioxide you get all positive changes from one data point to the next. If you do a runs test on changes in carbon dioxide you get a nice scatter of pluses and minuses."
The claim here is that, for each data point in a time series of CO2 concentration, the next data point is higher (all positive changes); but that the series x = CO2(i) - CO2(i-1) gives a variety of positive and negative values ("a nice scatter of pluses and minuses"). I hope I am not alone in seeing the straight forward contradiction in that claim. Perhaps john warner means to claim that ΔCO2 is always positive, while Δ(ΔCO2) provides a scatter of positive and negative values. If so, the point is irrelevant to autocorrelation, which is not a function of slope.
2) Here is the energy budget to which john warner refers:
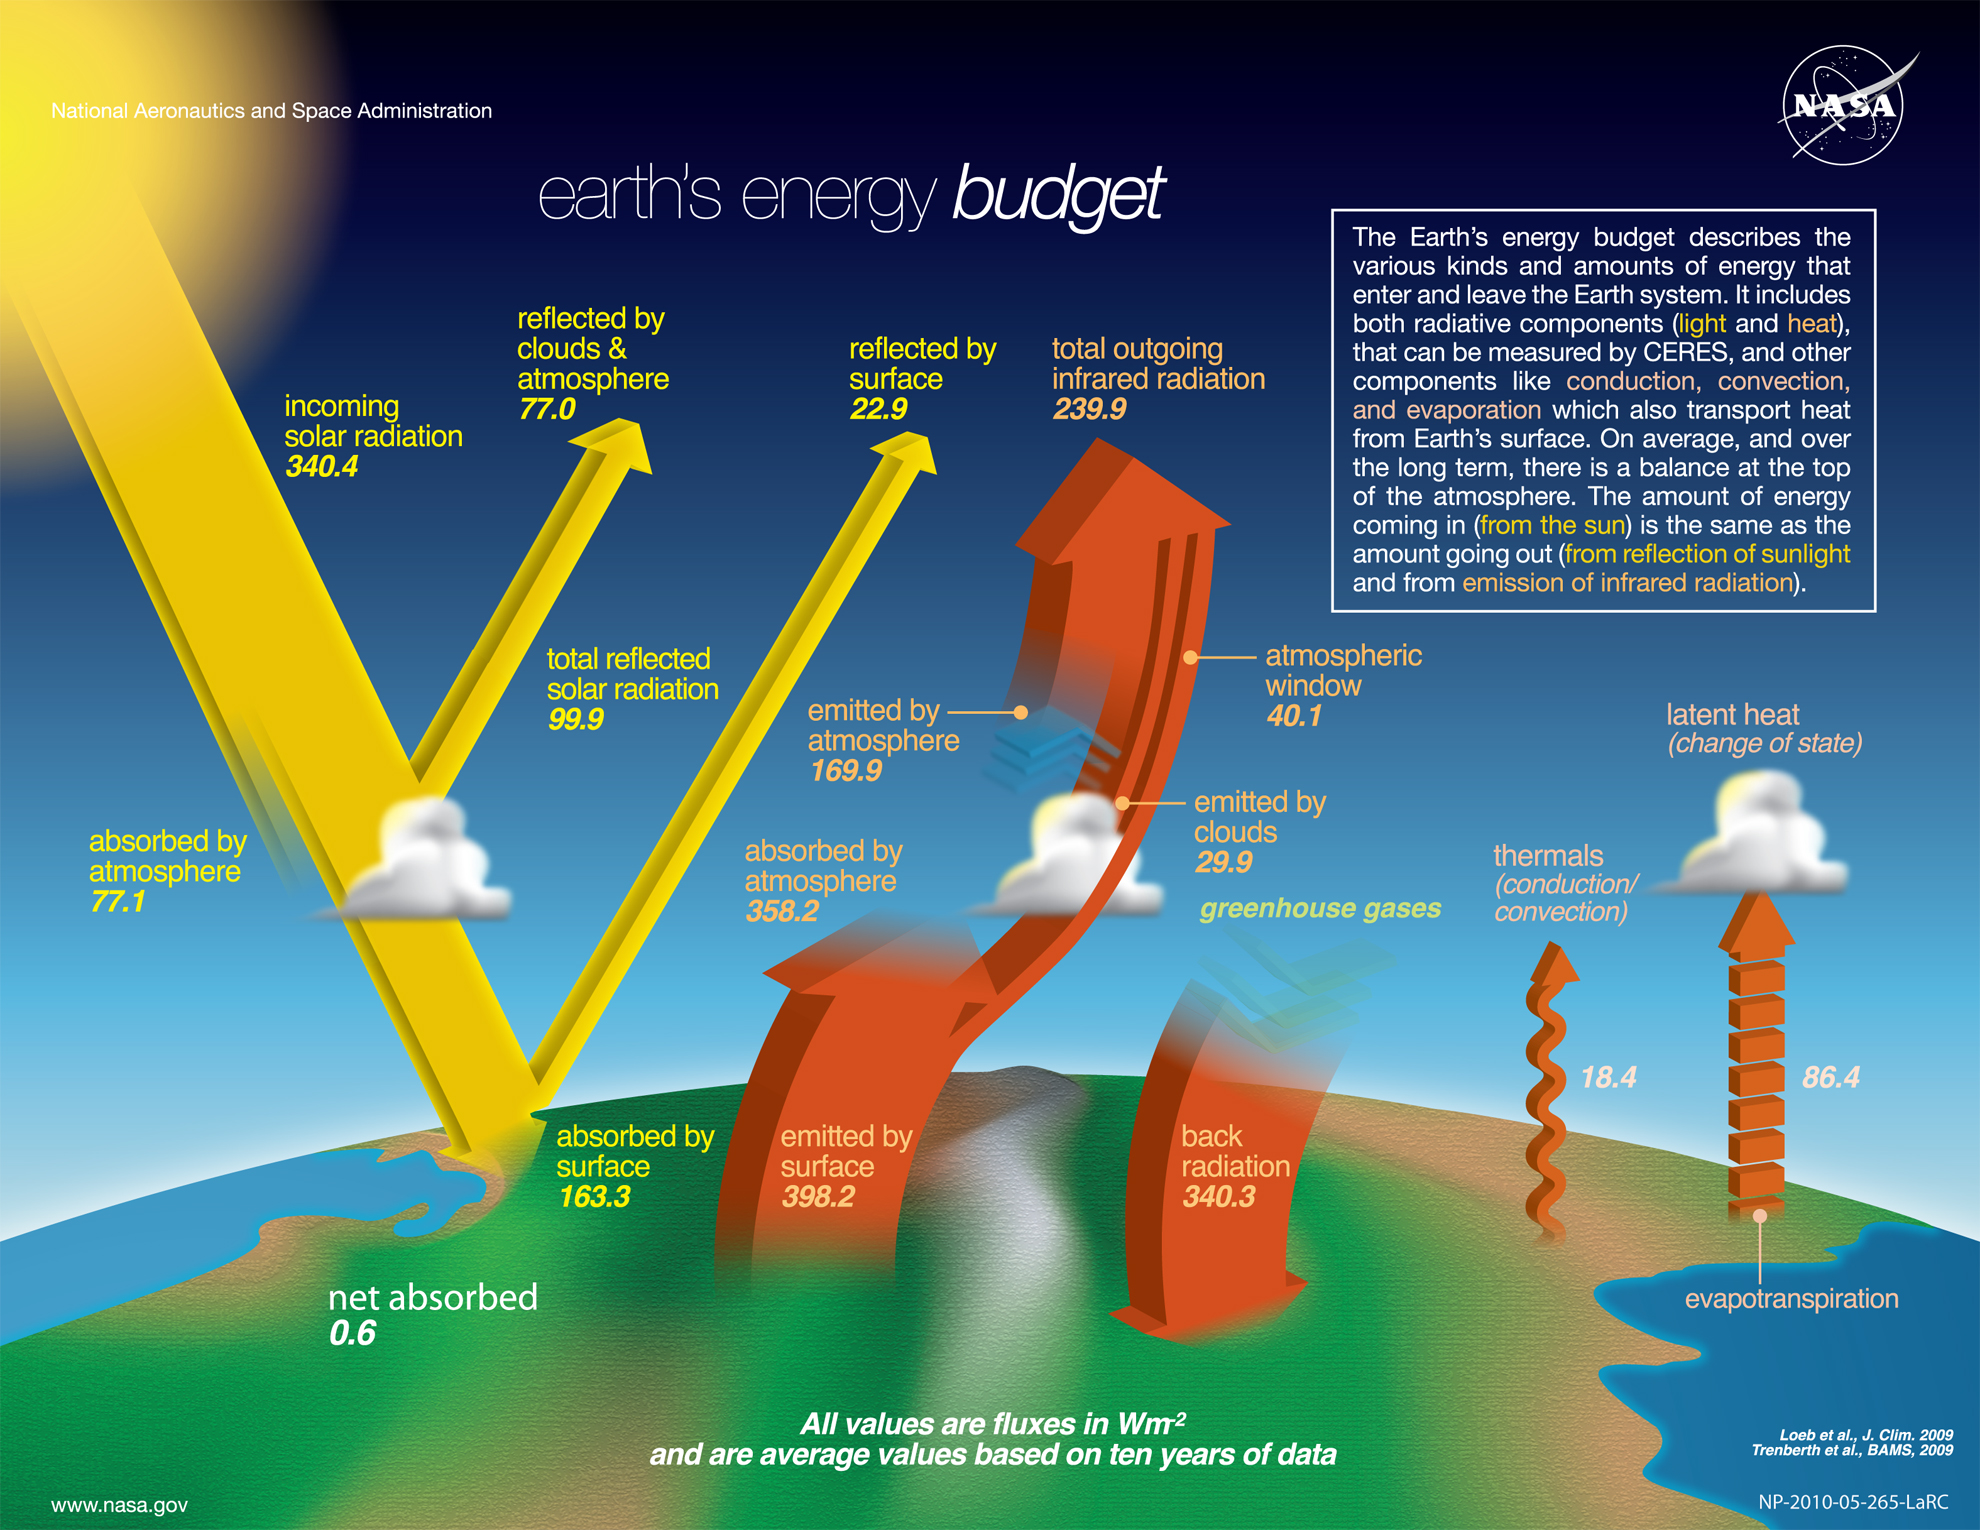
It is NASA's own estimate comparison of the peer reviewed estimates by Loeb et al, and Trenberth et al, (2009). Of this, john warner says, "The back radiation 340.3 has no corresponding physical scientific meaning" despite the back radiation being an observed quantity from many locations around the Earth.
The back radiation is IR radiation from greenhouse gases (including water vapour) and the cloud base. It's flux is less than that of the surface because it comes on average from a slightly higher altitude than the surface, and hence (because of the lapse rate) a slightly cooler layer than the surface. john warner's decomposition is a fiction.
3) With regard to the energy balance and GMST, because the energy flux is a function of the fourth power or temperature, the mean value of the energy flux does not directly correspond to the mean value of temperature unless the temperature at all points is identical. Trenberth, Fasullo and Khiel (2009) discuss this issue in the special section on "Spatial and temporal sampling" (page 315). Deriving the Global Mean Surface Temperature from the Stefan-Boltzmann Law and the known upward flux is, therefore, a basic mathematical error. Thus, if the Earth had two equal parts, each being isothermal, with the temperature of one being 283 K, and the other 295.6 K, for a mean temperature of 289.3, the net upward flux would average at 398.2 W/m^2. Using that to estimate surface temperature would yield a mean of 289.5 K. The variation in surface temperatures is much larger than the +/- 6 K used in my example, which accounts for the larger discrepancy found by john warner.
I should note that Trenberth et al derived their value from a reanalusis product (NRA), ie, a climate model run constrained to match observational data (ie, weather stations, among other sources). That is, he is using a result obtained premised on the accuracy of weather stations to "show" that the weather stations are inaccurate - while making a mathematical blunder in the process.
- Models are unreliable
scaddenp at 12:45 PM on 25 February, 2016I just had a quick look at Mann 2015 where this all started and at CMIP5 website. According to website, the runs were originally done in 2011. The CMIP5 graph is Mann, is the model ensemble but run with updated forcings. To my mind, this is indeed the correct way to evaluate the predictive power of a model, though the internal variability makes difference fom 2011 to 2015 insignificant. The continued predictive accuracy of even primitive models like Manabe and Weatherall, and FAR suggests to me that climate models are a very long way ahead of reading entrails as means of predicting future climate.
I wonder if Sks should publish a big list of the performance of the alternative "skeptic" models like David Evans, Scafetta, :"the Stadium wave" and other cycle-fitting exercises for comparison.
- Models are unreliable
KR at 23:40 PM on 24 February, 2016FrankShann - That's the entire reason for the various Representative Concentration Pathways (RCPs) evaluated in the models, to bracket potential emissions. Shorter term variations (which include emergent ENSO type events), volcanic activity, solar cycle, etc, are also incorporated, but as those aren't predictable they are estimates.
Which doesn't matter WRT the 30 year projections from the models, as the natural variability is less than the effects of thirty year climate change trends, and the GCMs aren't intended for year to year accuracy anyway - rather, they are intended to probe long term changes in weather statistics, in the climate.
- Models are unreliable
KR at 11:44 AM on 23 February, 2016FrankShann - As Tom Curtis points out, conditional predictions are indeed part of the definition (a basic part of physics, as it happens), and that's exactly what climate models provide. Trying to focus on only a single one of the multiple definitions in common usage is pedantry.
As to validation, the fact is that GCMs can reproduce not just a single thread of historic GMSTs, but in fact regional temperatures, precipitation, and even to some extent clouds (although with less accuracy at finer and finer details, and clouds are quite challenging). Those details are not inputs, but rather predictions of outcomes conditional on the forcings. _That_ validates their physics - and justifies taking the projections seriously.
We certainly do not need to wait decades before acting on what these models tell us.
- Models are unreliable
Tom Curtis at 10:03 AM on 23 February, 2016FrankShann @960, you quote as your source the Oxford English Dictionary but my print version of the Shorter Oxford gives an additional meaning of predict as "to mention previously" ie, to have said it all before. That is equally justified as a meaning of 'predict' by its Latin roots which are never determinative of the meaning of words (although they may be explanatory of how they were coined). The actual meaning of words is given by how they are in fact used. On that basis, the mere fact that there is a "jargon" use of the word, means that 'predict' has a meaning distinct from 'forecast' in modern usage. Your point three refutes your first point.
For what it is worth, the online Oxford defines predict as to "Say or estimate that (a specified thing) will happen in the future or will be a consequence of something". That second clause allows that there can be predictions which do not temporally precede the outcomes. An example of the later use is that it could be said that "being in an open network instead of a closed one is the best predictor of career success". In similar manner, it could be said that forcings plus basic physics is the best predictor of climate trends. This is not a 'jargon usage'. The phrase 'best predictor of' turns up over 20 million hits on google, including in popular articles (as above). And by standard rules of English, if x is a good predictor of y, then x predicts y.
As it happens, CMIP5 models with accurate forcing data are a good predictor of GMST. Given that fact, and that the CMIP5 experiments involved running the models on historical forcings up to 2005, it is perfectly acceptable English to say that CMIP5 models predict GMST up to 2005 (and shortly after with less accuracy based on thermal inertia). On this usage, however, we must say they project future temperatures, however, as they do not predict that a particular forcing history will occur.
As a side note, if any term is a jargon term in this discussion, it is 'retrodict', which only has 15,000 hits on google.
As a further sidenote, you would do well to learn the difference between prescriptive and descriptive grammar. Parallel to that distinction is a difference between prescriptive and descriptive lexicographers. The curious thing is that only descriptive lexicographers are actually invited to compose dictionaries - while those dictionaries are then used by amateur prescriptive lexicographers to berate people about language of which they know little.
The only real issue with Dana's using 'prediction' is if it would cause readers to be confused as to whether the CMIP5 output on GMST was composed prior to the first date in the series or not. No such confusion is likely so the criticism of the term amounts to empty pedantry.
- Republicans' favorite climate chart has some serious problems
Tom Curtis at 13:50 PM on 21 February, 2016FrankShann @3, in logical terms, a set of propositions, x, predicts another set of propositions, y, if and only if y can be logically deduced from x. This is the fundamental relationship that underlies all explanation. Of course, sometimes we are not able to predict events from a set of propositions, but only the statistical distribution in which the event lies, or in other words, the probability of its occurence. Being human, we will often claim that something "explains" something else, when it only explains why the event is highly probable - but that does not alter the fact that fundamentally, explanation is logical deduction.
The sole difference between prediction and retrodiction is that the former is explanation before the event, and the later is explanation after the event. Logically, this is irrelevant to how impressive the explanation is. One explanation is superior to the other based on simplicity (ie, the number of entities and relationships invoked), the preciseness of the conclusion of the successful deduction, and a priori probability of the premises. Nothing else, including the time it was made, enters into the fact. We are not less impressed by Newton's deduction of Galilean kinematics from his laws of motion, nor of Keppler's laws of planetary motion from his laws of motion plus the law of universal gravitation because they were after the event - and nor should we be.
The reason we are suspicious of retrodiction is the suspicion that they are ad hoc, ie, that they relly on premises added after the event to make the prediction fit, and at the cost of the simplicity of the premises used. However, the inclussion of ad hoc premises can be tested for either before or after the event. Therefore, provided we exclude ad hoc premises, prediction is no better in a scientific theory than retrodiction. Indeed, that is necessarilly the case in science. Otherwise we would need to preffer a theory that made correct predictions into the future but entirely failed to retrodict past observations over a theory that both predicted and retrodicted past and future observations with a very high degree of accuracy but occasional failures. Indeed, as we cannot know in advance future success, science is built on the principle that successful retrodiction in the best guide to successful prediction.
Given the above, your suspicions of CMIP5 models is based on an assumption that the change between them and earlier models is from the addition of ad hoc premises. That is in fact contrary to the case. The earliest climate models, due to lacking perfect resolution, needed ad hoc adjustments to close the energy budget. They needed ad hoc values for the rate of heat absorption by the ocean because they did not model the ocean. The very earliest models required ad hoc assumptions about the ratio of increase of different GHG because they did not have the capacity to model all GHG. As computer power has been improved, these ad hoc assumptions have been progressively removed. In terms of the elegance of prediction, CMIP5 models are vastly preferrable to the older models - but that is the crucial criteria.
If we prefer the predictions of Hansen (88) as a test of the validity of climate science - we are being unscientific. The model used in Hansen (88) did not include aerosols, did not include all GHGs, used a swamp ocean, did not include a stratosphere, and was not able to be run enough to generate an ensemble of predictions (a necessary feature for generating the probabilistic predictions of climate). In short, it was a massively ad hoc model, especially when compared to its modern incarnation. Therefore, if we are interested in science rather than rhetoric, the successful retrodiction by CMIP 5 models should impress us more than successful (or unsuccessful) predictions of Hansen (88).
Nor is the development from more use of ad hoc premises to less either unusual or a problem in science. In fact it is typical. Newton started predicting the motion of planets using the ad hoc premise that planets were point masses. Later that was improved upon by the ad hoc premise that planets were empty shells with all their mass distributed evenly at their surface. Only as computational power and mathematical techniques have improved has it become possible to model planets as genuine 3-D objects with variable mass concentrations in Newton's theory. This was not a basis of rational criticism of Newton's theory, and nor is the primitive nature of the model used in Hansen (88) a valid criticism of climate science. But just as we would not prefer continuing to use point masses in prediction in gravitation, nor should we preffer the predictions of Hansen (88) over the retrodictions of CMIP5.
- They predicted an ice age in the 70's
Tom Curtis at 10:11 AM on 4 February, 2016Moderator inline @44, I do not think the 1972 comment by Schneider and Rasool to which you link is a retraction of the 1971 paper. It is certainly not the 1974 retraction mentioned in wikipedia. However, in 2009, Schneider wrote in an email to Peter Chylek:
"all good scientists are skeptics and should be challenging every aspect
of what we do that has plausible alternative hypotheses. I personally
published what was wrong (with) my own original 1971 cooling hypothesis
a few years later when more data and better models came along and
further analysis showed [anthropogenic global warming] as the much
more likely…In fact, for me that is a very proud event—to have discovered
with colleagues why our initial assumptions were unlikely and better
ones reversed the conclusions—an early example of scientific skepticism
in action in climatology."How early Schneider discovered his 1971 paper to be in error is unclear. Certainly by 1972 he was stating that the model was inadequate, while not precluding the possibility of the accuracy of the predictions. He wrote:
"Recent numerical models studying the effect of particles on climate are often based on multiple scattering radiative transfer calculations, and use global averages for particle concentrations and optical properties. By contrasting certain existing models, some major problems in modeling studies that attempt to answer the question of the effects of increased atmospheric particles on climate can be illustrated. It will also be apparent that another uncertainty in the results of such studies arises from a lack of adequate observed input data on the geographic and vertical distributions of particle concentrations and their optical properties. Furthermore, a model that could realistically simulate the impact of increasing atmospheric particle concentration on climate must eventually include the simultaneous coupled effects of all the important atmospheric processes, such as fluid motions and cloud microphysics, in addition to the radiative transfer effects."
And by 1978, he was convinced that the warming effect of CO2 was the dominant anthropogenic influence on climate.
- Joseph E. Postma and the Greenhouse Effect
Tom Curtis at 16:17 PM on 3 February, 2016JPostma @148 (2nd point):
In the PDF you show the following diagram, commenting:

"A 5-layer de Saussure IPCC greenhouse device would result in a back-surface energy flux of 6,000 W/m2, which is 5700K or 2970C or 5660F via the Stefan-Boltzmann Law. This seems to be a very practically useful result as it indicates that a primary radiant heating source (1000 W/m2 of solar energy in this case) can be concentrated or amplified to temperatures far warmer than the equivalent temperature of the primary initial radiant heat source itself. Indeed, in theory it would work better than even a magnifying glass or focusing mirror and would not be limited by the effective temperature of the source spectrum since there is no limitation in these mechanics on the thermal properties of the primary heat source. The device de Saussure used was said to have multiple panes of glass, and so the effect predicted by the modern IPCC greenhouse effect should have been readily apparent."
What is obvious from this is that you completely fail to recognize that no glass has perfect transmittance of visible light, and thatn no box is perfectly insulated. You are like some creationist pseudoscientist criticizing Newton's three laws of motions as false because (as it happens) in the real world there is friction, air resistance and uneven forces, all of which lead to divergence between experimental and predicted results in the simple models that ignore those complications.
How much of a problem these factors can actually be is seen by looking at the transmitance of modern, 1/4 inch clear glass:

(Source)
Note that while the diagram shows the example for an angle of incidence of 30 degrees, at 0 degrees (ie, perpendicular to the glass) the transmittance is not appreciably better.
Using a spreadsheet I modelled a 5 pane de Saussure Hotbox with 2% reflectance and 2% absorption. The result showed a backplate temperature of 532 K (258oC), with radiances given in the table below:
Layer SW Down SW Absorbed SW Up SW Up SW Down
5 980 20 179 801 801
4 941 19 140 1582 1582
3 904 18 103 2344 2344
2 868 17 67 3088 3088
1 834 17 33 3815 3815
0 0 801 0 4525 0(* Note that for convenience of calculation, I ignored reflected shortwave radiation going upward. Any inaccuracy of the calculation thereby introduce is more than compensated by the very low values of reflectance and transmittance relative to the actual case.)
That still ignores heat losses, the two primary sources of which will be heat loss from the backplate zone (as the hottest region of the box) and from the top pane (due to ambient airflow cooling the glass). Introducing just a 50 W/m^2 heat loss for just the second factor drops the backplate temperature to 423 K (150oC), with radiances as follows:
Level SW Down SW Absorbed SW Up SW Up SW Down
5 980 20 179 350 350
4 941 19 140 681 681
3 904 18 103 993 993
2 868 17 67 1287 1287
1 834 17 33 1563 1563
0 0 801 0 1823 0Note carefully that these results were obtained with reflectances just 29% of, and absorptions just 12% of the actual case with commercial glass. Further, the glass available in 1767 to de Saussure and in 1830 to Herschell would have been much worse than even standard glass available today.
From this analysis it is obvious that adding additonal panes of glass will suffer from a severe case of diminishing returns. With commercial grade glass, it is likely that only the first two or three panels will appreciably improve performance.It also begs the question as to what sort of "scientist" attempts analysis of experimental results by treating them as ideal cases when there are very well known inefficiencies in the actual processes? IMO only pseudoscientists are so intellectually vacuous.
If you are at all honest, you will redo your analyses including transmittance, reflectance and absorption figures for modern glass, and including reasonable estimates of heat loss other than by radiance. Alternatively you will admit your entire analysis has been specious from the get-go.
- Surface Temperature or Satellite Brightness?
Tom Curtis at 13:43 PM on 16 January, 2016Some of you are undoubtedly already aware of the excellent video on satellite temperatures recently released by Peter Sinclair:
There is now some denier pushback against that video, led by the infamous James Delingpole, ;at Breitbart.
Some of the pushback (typically of Delingpole) is breathtaking in its dishonesty. For instance, he claims:
"This accuracy [of the satellite record] was acknowledged 25 years ago by NASA, which said that “satellite analysis of the upper atmosphere is more accurate, and should be adopted as the standard way to monitor temperature change.”
It turns out the basis of this claim, is not, however, a NASA report. Rather it was a report in the The Canberra Times on April 1st, 1990. Desite the date, it appears to be a serious account, but mistaken. That is because the only information published on the satellite record to that date was not a NASA report, but "Precise Monitoring of Global Temperature Trends" by Spencer and Christy, published, March 30th, 1990. That paper claims that:
"Our data suggest that high-precision atmospheric temperature monitoring is possible from satellite microwave radiometers. Because of their demonstrated stability and the global
coverage they provide, these radiometers should be made the standard for the monitoring of global atmospheric temperature anomalies since 1979."A scientific paper is not a "NASA report", and two scientists bignoting their own research does not constitute an endorsement by NASA. Citing that erronious newspaper column does, however, effectively launder the fact that Delingpole is merely citing Spencer and Christy to endorse Spencer and Christy.
Given the history of found inaccurracies in the UAH record since 1990 (see below), even if the newspaper column had been accurate, the "endorsement" would be tragically out of date. Indeed, given that history, the original claim by Spencer and Christy is shown to be mere hubris, and wildly in error.
Delingpole goes on to speak of "the alarmists’ preference for the land- and sea-based temperature datasets which do show a warming trend – especially after the raw data has been adjusted in the right direction". What he carefully glosses over is that the combined land-ocean temperature adjustments reduce the trend relative to the raw data, and have minimal effect on the 1979 to current trend.
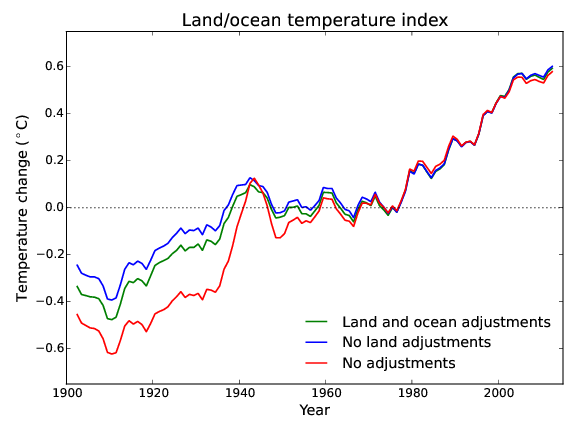
He then accuses the video of taking the line that "...the satellite records too have been subject to dishonest adjustments and that the satellites have given a misleading impression of global temperature because of the way their orbital position changes over time." That is odd given that the final, and longest say in the video is given to satellite temperature specialist Carl Mears, author of the RSS satellite temperature series, whose concluding point is that we should not ignore the satellite data, nor the surface data, but rather look at all the evidence (Not just at satellite data from 1998 onwards). With regard to Spencer and Christy, Andrew Dessler says (4:00):
"I don't want to bash them because everybody makes mistakes, and I presume everybody is being honest..."
Yet Delingpole finds contrary to this direct statement that the attempt is to portray the adjutments as dishonest.
Delingpoles claim is a bit like saying silent movies depict the keystone cops as being corrupt. The history of adjustments at UAH show Spencer and Christy to be often overconfident in their product, and to have made a series of errors in their calculations, but not to be dishonest.
The nest cannard is that satellites are confirmed by independent data, in balloons - a claim effectively punctured by Tamino:

Finally, Delingpole gives an extensive quote from John Christy:
"There are too many problems with the video on which to comment, but here are a few.
First, the satellite problems mentioned here were dealt with 10 to 20 years ago. Second, the main product we use now for greenhouse model validation is the temperature of the Mid-Troposphere (TMT) which was not erroneously impacted by these problems.
The vertical “fall” and east-west “drift” of the spacecraft are two aspects of the same phenomenon – orbital decay.
The real confirmation bias brought up by these folks to smear us is held by them. They are the ones ignoring information to suit their world view. Do they ever say that, unlike the surface data, the satellite datasets can be checked by a completely independent system – balloons? Do they ever say that one of the main corrections for time-of-day (east-west) drift is to remove spurious WARMING after 2000? Do they ever say that the important adjustment to address the variations caused by solar-shadowing effects on the spacecraft is to remove a spurious WARMING? Do they ever say that the adjustments were within the margin of error?"
Here is the history of UAH satellite temperature adjustments to 2005:
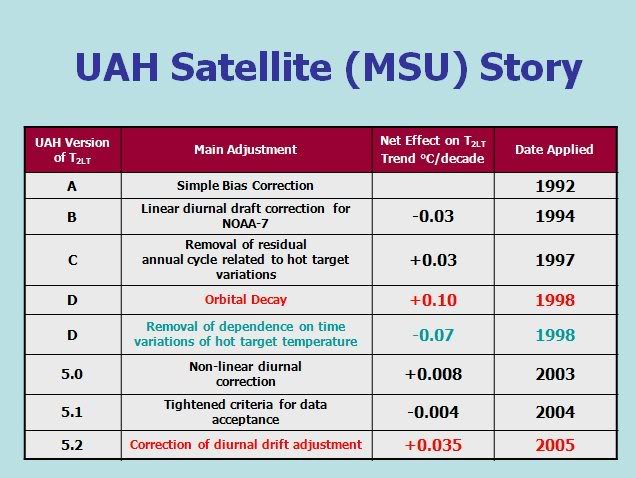
Since then we have had additional corrections:
- 5.2: Eliminate NOAA 16 data, +0.01 C/decade; Dec 2006
- 5.2: Discovered previous correction eliminated NOAA 15 by mistake, unknown amount; Dec 2006
- 5.2 Switch from annual to monthly anomaly period baseline, +0.002 C/decade; July 2009
- 5.5 Eliminate AQUA data, + 0.001 C/decade
There were also changes from version 5.2 to 5.3, 5.3 to 5.4 and 5.5 to 5.6 which did not effect the trend. Finally we have the (currently provisional) change from 5.6 to 6.0:
- 6.0, Adjust channels used in determining TLT, -0.026 C/decade; April, 2015
Against that record we can check Christy's claims. First, he claims the problems were dealt with 10-20 years ago. That, of course, assumes the corrections made fixed the problem, ie, that the adjustments were accurate. As he vehemently denies the possibility that surface temperature records are accurate, he is hardly entitled to that assumption. Further, given that it took three tries to correct the diurnal drift problem, and a further diurnal drift adjustment was made in 2007 (not trend effect mentioned), that hardly inspires confidence. (The 2007 adjustment did not represent a change in method, but rather reflects a change in the behaviour of the satellites, so it does not falsify the claim about when the problem was dealt with.)
Second, while they may now do model validation against TMT, comparisons with the surface product are done with TLT - so that represents an evasion.
Third, satellite decay and diurnal drift may be closely related problems but that is how they are consistently portrayed in the video. Moreover, given that they are so closely related it begs the question as to why a correction for the first (Version D above) was not made until four years after the first correction for the second.
Moving into his Gish gallop we have balloons (see link to, and image from Tamino above). Next he mentions two adjustments that reduce the trend (remove spurious warming), with the suggestion that the failure to mention that the adjustments reduce the trend somehow invalidates the criticism. I'm not sure I follow his logic in making a point of adjustments in the direction that suites his biases. I do note the massive irony given the repeated portrayal of adjustments to the global land ocean temperture record as increasing the trend relative to raw data when in fact it does the reverse.
Finally, he mentions that the adjustments fall within the margin of error (0.05 C per decade). First, that is not true of all adjustments, with two adjustments (both implimented in version D) exceding the margin of error. Second, the accumulative adjustment to date, including version 6.0, results in a 0.056 C/decade increase in the trend. That is, accumulative adjustments to date exceed the margin of error. Excluding the version 6 adjustments (which really change the product by using a different profile of the atmosphere), they exceeded the margin of error by 38% for version 5.2 and by 64% for version 5.6 (as best as I can figure). If the suggestion is that adjustments have not significantly altered the estimated trend, it is simply wrong. Given that Christy is responsible (with Spencer) for this product, there is not excuse for such a mistatement.
To summarize, the pushback against the video consists of a smorgazbord of innacurate statements, strawman presentations of the contents of the video, and misdirection. Standard Delingpole (and unfortunately, Christy) fare.
- CO2 effect is saturated
Tom Curtis at 06:57 AM on 20 October, 20151) when you say "as a model, [radiative forcing is] not fitting", the model from which radiative forcing is derived are Line By Line (LBL) or broadband radiative models. The Line By Line refers to the fact that they calculate atmospheric transmission and emission for each wave number (a measure of frequency) seperately, giving a very fine resolution of radiative transfer. Typically they also divide the amtosphere into about twenty layers or so, calculating in each direction (up or down) the radiation entering, the radiation absorbed and the radiation emitted based on the atmospheric composition at that layer. As of 1969, they produced results with this sort of accuracy:

One such model whose accuracy across a wide range of surface conditions, temperatures and latitudes was studied in 2008 showed the following scatter plot vs observations for 134,862 observations:

If you are not familiar with scatter plots, they are plots of the observed value (CERES OLR) with the model predicted value, with perfect accuracy of prediction meaning the observations sit on the black line shown. The accuracy shown here is absolutely astonishing. The determination of radiative forcing of CO2 was done using models like this, or the lower resolution versions that are essential parts of all climate models (Global Circulation Models). I can only presume that when you say the model is "... not fitting", you simply do not know what models are used for the theory.
2) You also say that "If CO2 makes up 20% of our greenhouse effect, light from stars at this wavelength should be diminished by 20%". That assumes that absorption is the same at all frequencies, which is false (as can be seen in the first graph). IR astronomers tune the frequency of the observatories to 10 to 13 micron (800 - 1000 cm-1)band where there is minimum absorption by any atmospheric component as seen in the first grap above, and this emission spectrum from the University of Colorado:

By doing so they avoid nearly all of the effect of CO2 and H2O on the incoming light. Despite this, they still need to place their observatories high in the atmosphere (either on mountains, in planes or supported by balloons) or in space to get clear images. So, your fundamental premise that absorption is equal across all IR bands is simply mistaken.
Curiously, Goddard's "IR astronomer" friend refers to the 9.5 micron band as being absorption freed (it is in fact the frequency of maximum absorption and emission by ozone) and describes the actual atmospheric window as being a zone of significant absorption and emission by H2O, showing he does not even grasp the fundamental facts of atmospheric absorption and emission.
3) "Steven Goddard" and his (apparently fictional) source always makes a fundamental misake in examining radiation models. He only examines the so-called back radiation. Because H2O and CO2 emissions overlap, and because H2O is very abundant in the low atmosphere, CO2 emissions make up only a very small percentage of the overall back radiation. That, however, is irrelevant. What controlls the Global Mean Surface Temperature (GMST) is the balance of energy recieved and energy radiated to space. Therefore it is radiation to space from the atmosphere which is the dominant driver of surface temperatures, and hence upper atmosphere concentrations that matter. Because the concentration of H2O is controlled by temperature, and temperatures fall rapidly with altitude, CO2 completely dominates emission to space in frequencies of significant overlap with H2O. Consequently, it is emissions to space that must be examined to determine the relative importance of different atmospheric components.
As an aside, because H2O absorbs in more frequencies it still (along with clouds) accounts for 75% of the total greenhouse effect, with CO2 accounting for 20%. Importantly, H2O varies rapidly with surface temperature, while CO2 varies only slowly. As a result, increasing CO2 will result in a rapid rise in H2O, generating a positive feedback on the CO2 rise. In contrast, a rise in H2O will result in only a small response from CO2, resulting in temperatures and H2O concentrations soon returning to their initial values.
Finally, if you want to examine the basis of greenhouse effect in more detail, but explained very clearly, I recommend my post here. It and the following comments also contain more detail on the first two graphs above.
(Note to the moderator, I know that I am close to the point of dogpilling. If that is a problem, I ask that you retain my post as the only one todate directly addressing the issues raised by fred.steffen (rather than his sources). Thankyou)
- It's the sun
Pfc. Parts at 05:23 AM on 13 October, 2015The fundamental problem with this analysis lies in the measurements used. The author begins with a paleo record (Wang 2005), which provides an estimate of TSI based on theororetical reconstructions and concludes his argument with direct instrument measures of TSI using advanced orbital measures obtained over the period between 1978 and 2010.
The paleo record clearly shows an upward trend in TSI. To counter the obvious conclusion reached from these measures, the author changes his reference to satellite observations, which show a locally declining trend. This is, without doubt, a choice biased by the author's ideology and his intention to refute a rising TSI either exists or is a significant factor in rising global temperature.
In general, use of measures for either solar output (TSI) or surface temperature taken before the broad use of the telegraph should be discarded; these measures were taken by hand using uncalibrated instruments and communicated by horse drawn carriage and sailing ship. The are not accurate or precise to the levels claimed by the models based on them, which are defined in fractions of a Watt and degree Centigrade. It's frankly absurd to use these data. Reconstructions (Wang et. al.) are even more difficult to accept; the error of estimate exeeds the observed variation in the measured value.
This is the root of the problem climateologists face when building models or presenting the results of them; they lack sufficient data. Climate change is a slow process that is detectable in very small changes. To be useful, measurements used must come from calibrated instruments with the accuracy and precision needed to build models capable of making predictions with error bars signigicantly smaller than +/- 1 degree centigrade. It is statistically impossible to use data such as those presented in this article to achieve that goal.
Impossible. This is not an ideologically based argument; it is mathematical. The problem Climate Science faces isn't theoretical, it's based on measurement. Measurements with the necessary precision and accuracy simply are not available over the necessary time frame. There is no way to correct this problem.
- 2015 SkS Weekly Digest #27
KR at 23:28 PM on 10 July, 2015MIchael Fitzgerald - Comments, not in any particular order.
- Direct forcing by CO2 is very well established and modeled, at 3.7 W/m2 per doubling under current conditions. This has been empirically confirmed by satellite spectra, see Harries et al 2001 where radiative line-by-line models were validated within 1%.
- Starting from a Gedankenexperiment condition of no GHGs to now, there would be an initial linear forcing increase at low concentrations followed by the current log forcing increase with linear CO2 increases. However, while non-linear, this forcing change is indeed monotonic - at no point does an increase in CO2 cause a negative forcing.
- Water vapor feedback (as per the Clausius–Clapeyron relation) immediately adds more than doubles any forcing. This is spatially variant, however, and you aren't going to get global values by looking at specific regions (i.e., the Arctic).
- If you want to compute the power involved in these spectra - calculate it. Eye-balling a graphic representation, no matter what the axes, won't give useful accuracy. This is why tools like MODTRAN were developed.
- As MA Rodger quite accurately pointed out, observed short-term warming is at best an estimate of transient climate sensitivity (TCS), not the ECS. These are not the same quantities.
- RE sensitivity vs. temperature - for the current climate realm climate sensitivity is essentially a linear scalar to forcing. Sensitivity doesn't change with temperature. CO2 forcing has a log scaling to concentration changes, CFC's with lower concentrations have linear scaling to forcing (Myhre et al 1998, essential reading for this discussion); but overall climate sensitivity to forcing changes at current temperatures is a fixed (if somewhat uncertain) number. Go far enough, to an ice-ball Earth or with no polar caps whatsoever, or change continental arrangements, for example, and that sensitivity will change - but we haven't reached those points.
Overall, I have the impression that you are getting lost in the minutia, and trying to extrapolate from those to global conditions. Beware the fallacy of composition.
- 2015 SkS News Bulletin #3: NOAA Updates Global Temperature Record
scaddenp at 15:19 PM on 10 June, 2015And what informs that opinion? On the contrary, we have published science to quite the contrary. A gross level, for any planet in any solar system, surface temperature is described by the energy balance. It is function of incoming radiation, planetary albedo and atmospheric composition. A planet with atmosphere and oceans has internal variability from being unevenly heated.
However, there is no "cycle or mood" that can steadily increase the ocean heat content. Conservation of energy requires that energy come from somewhere. What cycle is creating energy? The observed change is consistant with change in GHG. Solar is not increasing. You can argue about climate sensitivity or the accuracy of models but you cant argue about conversation of energy.
- Models are unreliable
Tom Curtis at 09:30 AM on 30 May, 2015Postkey @931, you should always cleary indicate when words are not yours by the use of quotation marks. In particular, it is very bad form to quote a block of text from somebody else (as you did from point 1 onwards) without indicating it comes from somebody else, and providing the source in a convenient manner (such as a link). For everybody else, from point 1 onwards, PostKey is quoting Alec M from the discussion he previously linked to.
With regard to Alec M's alegations, although Carl Sagan did a lot of work on Venus' climate, Mars' climate, the climate of the early Earth, and the potential effect of volcanism and nuclear weapons on Earth's climate, he did not publish significantly on the greenhouse effect on Earth. The fundamental theory of the greenhouse effect as currently understood was worked out by Manabe and Strickler in 1964. As can be seen in Fig 1 of Manabe and Strickler, they clearly distinguish between lapse rates induced by radiation, and those induced by gravity (that being the point of the paper) - a fundamental feature of all climate models since. So Alec M's "mistake 3" is pure bunk. By claiming it as a mistake he demonstrates either complete dishonesty or complete ignorance of the history of climate physics.

With regard to "mistake 2", one of the features of climate models is that introducing a difussing element, such as SO2 or clouds, will cool the region below the element and increase it above it. The increase in temperature above the diffusive layer would be impossible if the clouds were treated as forward scattering only. So again, Alex M is revealed as a liar or completely uninformed.
The surface excitance (aka black body radiation) was and is measured in the real world with instruments that are very substantially warmer than absolute zero. Initially it was measured as the radiation emitted from cavities with instruments that were at or near room temperature. As it was measured with such warm instruments, and the fundamental formula's worked out from such measurements, it is patently false that the surface excitance is "potential energy flux in a vacuum to a radiation sink at 0 deg K". Indeed, the only thing a radiation sink of 0 deg K would introduce would be a complete absence of external radiation, so that the net radiation equals the surface excitance. As climate models account for downwelling radiation at the surface in addition to upwelling radiation, no mistake is being made and Alex M is again revealed as a fraud.
With regard to his fourth point, I do not know enough to comment in detail. Given that, however, the name gives it away. A parametrization is a formula used as an approximation of real physical processes which are too small for the resolution of the model. As such it may lump together a number of physical processes, and no assumption is made that it is not. Parametrizations are examined in great detail for accuracy in the scientific literature. So, neither Sagan nor any other climate scientist will have made the mistake of assuming a parametrization is a real physical process. More importantly, unlike Alex M's unreferenced, unexplained claim, the parametrization he rejects has a long history of theoretical and emperical justification.
Alex M claims "My PhD was in Applied Physics and I was top of year in a World Top 10 Institution." If he had done any PhD not simply purchased on the internet, he would know scientists are expected to back their claims with published research. He would also know they are expected to properly cite the opinions of those they attempt to use as authorities, or to rebut. His chosen method of "publishing" in comments at the telegraph without any citations, links or other means to support his claims shows his opinions are based on rejecting scientific standards. They are in fact a tacit acknowledgement that if his opinions were examined with the same scientific rigour Sagan examined his with, they would fail the test. Knowing he will be unable to convince scientists, he instead attempts to convince the scientifically uninformed. His only use of science in so doing is to use obscure scientific terms to give credence to his unsupported claims. Until such time as he both shows the computer code from GCM's which purportedly make the mistakes he claims, and further shows the empirical evidence that it is a mistake the proper response to such clowns is laughter.
- Heat from the Earth’s interior does not control climate
Tom Curtis at 23:46 PM on 29 May, 2015CBDunkerson @32:
1) essentially the greenhouse effect comes from condensing and non-condensing gases. The non-condensing gases (CO2, CH4, NO2, O3, etc) have concentrations that do not primarilly depend on GMST, although they are influenced by them. Of them only CO2 and CH4 had appreciable effects in the 1980s, ie, the time period covered by Schmidt et al, and in that period CH4 represented only 1% of the total greenhouse effect. As the vast majority of that 1% came from anthropogenic emissions from 1750-1980, I decided it was easier to just ignore it, and fold it and the other minor non-condensing greenhouse gases in with the condensing gases.
The vast majority of the "greenhouse feedback" represent the greenhouse effect from water vapour and clouds. These are the condensing greenhouse gases, where temperature very tightly controlls concentration. As a result, there presense in the atmosphere is always a feedback on other energy sources plus the CO2 greenhouse effect. In particular, absent the solar energy input, the greenhouse feedback would be zero; and absent the CO2 greenhouse effect, it would be substantially less (Lacis et al, 2010). I put it as a seperate item because its behaviour is so different at temperature consistent with solar input.
It is, of course, not intended to indicate feedbacks only from the greenhouse effect, or all feedbacks from the greenhouse effect.
2) I thought I had already clarrified this point in the paragraph starting, "The most important thing...". In all cases the temperature response to a given factor is:
T = (j*/σ)^0.25, where j* is the energy input in W/m^ and σ is the Stefan-Boltzman constant
For j*= 0.09 W/m^2, T = 35.49 oK
For j* = 240 W/m^2, T = 255.06 oK
But for j* = 240.09, T = 255.09 oK
The crux is that the relationship between energ input and temperature is far from linear, so any energy input with a big impact at low temperatures has negligible impact at high temperatures.
3) No. Values are effectively for 2010 in that I used the IPCC AR5 value for total greenhouse effect. As such, these values include an anthropogenic forcing larger than any of the non-solar energy impacts.
The two major sources of inaccuracy in determining the GMST from a given energy input are the assumption that the Earth is a black body (emissivity = 1), and the assumption that the Earth has a constant temperature at all locations. (I mentioned these briefly among the missing factors.) Of these, the fact that the Earth's emissivity is slightly less than 1 will increase the GMST by about 2 to 8 oK depending by how much the emissivity is overstated. Probably closer to 2 than 8, but absent a global radiation budget model I cannot determine the exact value.
In contrast, unequal temperatures (which certainly exist) will reduce the estimated GMST. In an extreme case where the Earth has a permanently sunlit hemisphere, and a permanently dark hemisphere with constant temperature in each hemisphere, but no energy shared between hemispheres so that the dark hemisphere is much cooler than the sunlit hemisphere, the GMST would fall to 181.31 oK, a drop of 108.33 oK. That is an interesting case in that it approximates to conditions on the Moon. It also shows how large an effect unequal temperatures can have. The Earth certainly has unequal surface temperatures, and they are even unequal at the tropopause from which most IR radiation escapes. Therefore this reduction in expected temperature certainly is a factor. However, again without a complex and accurate model, it is impossible to determine how much of a factor. Indeed, in this case you would need a full climate model, as temperature variation also varies with time of day and season.
Given these two significant, and opposite effect factors which cannot easilly be determined, it is surprising the above calculations are as accurate as they are. Certainly the minor inaccuracy is nothing to be concerned about against that backdrop. In fact, the errors in calculated values from observed values are less than the range of errors between different estimates of the observed values.
- Making sense of the slowdown in global surface warming
WRyan at 12:08 PM on 27 May, 2015For the shorter term predictions, is the problem with the accuracy and precision of the data or is it a problem with the precision of the climate models?
- Climate's changed before
DSL at 06:45 AM on 11 May, 2015Skeptic1223, click on the links I provided. Try not to assume that increased global water vapor means more rain for everyone. I said "precipitation intensity" not "more widespread precipitation." You might check out the observed and modeled expansion of the Hadley circulation as well.
Why wasn't the "pause" in surface temp "predicted" by climate models? Because climate models aren't designed to project sub-decadal trends. The temporal resolution is getting better, and the "pause" has inspired focused science that's been quite fruitful, but the bald fact of the matter--and something that fake skeptics aren't willing to get--is that climate modeling isn't designed for accuracy over the short-term. Do you understand why that might be? - Models are unreliable
Tom Curtis at 13:50 PM on 5 May, 2015Klapper @891:
1)
""...because of recent small scale volcanism (also not included in the models).."
I don't accept that argument."
I really don't care about your propensity for avoiding inconvenient information. Recent papers show that the volcanic effect has influenced temperature trends and and TOA energy imbalance. Thus we have Santer et al (2014):
"We show that climate model simulations without the effects of early twenty-first-century volcanic eruptions overestimate the tropospheric warming observed since 1998. In two simulations with more realistic volcanic influences following the 1991 Pinatubo eruption, differences between simulated and observed tropospheric temperature trends over the period 1998 to 2012 are up to 15% smaller, with large uncertainties in the magnitude of the effect."
"Using an ensemble of HadGEM2-ES coupled climate model simulations we investigate the impact of overlooked modest volcanic eruptions. We deduce a global mean cooling of around −0.02 to −0.03 K over the period 2008–2012. Thus while these eruptions do cause a cooling of the Earth and may therefore contribute to the slow-down in global warming, they do not appear to be the sole or primary cause."
And most directly of all, Solomon et al (2011):
"Recent measurements demonstrate that the “background” stratospheric aerosol layer is persistently variable rather than constant, even in the absence of major volcanic eruptions. Several independent data sets show that stratospheric aerosols have increased in abundance since 2000. Near-global satellite aerosol data imply a negative radiative forcing due to stratospheric aerosol changes over this period of about –0.1 watt per square meter, reducing the recent global warming that would otherwise have occurred. Observations from earlier periods are limited but suggest an additional negative radiative forcing of about –0.1 watt per square meter from 1960 to 1990. Climate model projections neglecting these changes would continue to overestimate the radiative forcing and global warming in coming decades if these aerosols remain present at current values or increase."
If you add the -0.1 W/m^2 additional aerosol load after 2000 to the approximately -0.1 W/m^2 from the the discrepancy between modeled and observed solar forcing, you get a CMIP5 absolute value energy imbalance of 0.72 W/m^2 from 2000 to 2010, ie, only 16% greater than observed (Smith et al), and using drift corrected figures the modelled TOA energy imbalance becomes 14.5% less than the observed values. Forster and Rahmstorf used values from prior to these analyses and so cannot be expected to have incorporated them. Therefore citing Forster and Rahmstorf is not a counter argument. It is merely an appeal to obsolete data.
2) With regard to the SORCE data, the situation is very simple. The SORCE reconstruction is essentially an earlier reconstruction that was benchmarked against PMOD which has been rebenchmarked against the SORCE data. The effect of that it to shift the entire reconstruction down by the difference between the TSI as determined by PMOD, and that as determined by SORCE. Consequently the TOA shortwave down radiation is shifted down by a quarter of that value over the entire length of the reconstruction. Because that shift occures over the entire length of the reconstruction, it means the difference between twentieth century values of the solar forcing and preindustrial values(ie, rsdt(y) minus rsdt(pi), where rsdt(y) is the downward short wave radiation at the tropopause in a given year, and rsdt(pi) is the downard short wave radiation at the tropopause in 1750) does not change, because both the twentieth century values and the preindustrial values have been reduced by the difference between PMOD and SORCE. Ergo there is no appreciable change in the solar radiative forcing in the twentieth century as a result of the difference.
In contrast, for twenty-first century values, the models use a projection so that the difference between (model rsdt minus SORCE value) and the mean twentieth century difference is significant because it does represent an inaccurate forcing in model projections.
The tricky bit comes about in a direct comparison of TOA energy imbalance. In determining the "observed" energy imbalance, Smith et al following Loeb et al adjust the satellite observed rsdt, rsut and rlut so that the net value matches the calculated increase in OHC from 2005-2010, and so as to maximize the likilihood of the adjustments given the error margins of the three observations. Consequently, in all likelihood, they have adjusted the rsdt upward from the SORCE estimate. Therefore when comparing observations to models we are dealing with two adjustments to rsdt. First we have an implicit adjustment in the models that results in the radiative forcing being preserved in the models. This implicit adjustment is equivalent to the average difference between the model rsdt and the SORCE reconstruction. Secondly, we have another smaller adjustment to the SORCE value that results from the benchmarking of the empirical values. Because this adjustment is smaller than the first, it generates a persistent gap between the observed and modelled rslut resulting in a persistent difference in the energy balance.
From the fact that this gap is persistent, the size of the TOA energy imbalance and that temperatures were rising from 1861-1880, it is evident that the gap (and hence the persistent bias) is less than 0.2 W/m^2. I suspect, however, that it is at least 0.1 W/m^2 and probably closer to 0.2 than to 0.1 W/m^2.
3)
""....KNMI climate exporer (sic) are strictly speaking top of troposhere"
What makes you think that?"
The fact that the graph of rsdt shows a clear downward spike in 1992 (Pinatubo) and another smaller one in 1983 (El Chichon). That makes sense with increases in stratospheric aerosols, but is impossible if the data is trully from the TOA (rather than the TOA by convention, ie, the tropopause).
4)
""...CMIP5 forcings are known to be overstated by 0.2-0.4 W/m^2..."
"...Ergo it is jumping the gun to conclude from this that the models are in error."
Both above statements cannot be true. The models according to you are (currently at least) in error. If the models are not in error why do they need to correct the TOA imbalance numbers for model drift?"
By "both of these statements cannot be true", you really only indicateing that you don't understand it. In fact, everytime you said it in the post above, you were wrong.
So, lets start from basics. Climate models are models that, given inputs in the form of forcings produce outputs in the form of predictions (or retrodictions) of a large number of climate variables. When you have such a model, if you feed it non-historical values for the forcings, it is not an error fo the model if it produces non-historical values for the climate variables. So, when we discover that forcings have been overstated for the first decade and a half of the twentyfirst century, we learn absolutely nothing about the accuracy of climate models. We merely rebut some inaccurate criticisms of the models. It follows that the first sentence does not contradict, but rather provides evidence for the second.
With regard to model drift, had you read the relevant scientific paper (to which I linked) you would have learnt that it is impossible to determine without exhaustive intermodel comparisons whether or not drift is the result of poor model physics, too short a run up time or poor specification of the initial conditions. Only the first of these counts as an error in the model. Ergo, you cannot conclude from this that because of model drift, the models are flawed. All you can conclude is that, if you accept that the model drift exists, then you ought to correct for it and that uncorrected model projections will be rendered inaccurate by the drift. Now here you show your colours, for while you steadfastly refuse to accept the dift corrected TOA energy imbalance figures as the correct comparitor, you want to count model drift as disproving the validity of models. That is an incoherent position. Either the models drift and we should compare drift adjusted projections to emperical observations, or they don't drift in which case you can't count drift as a problem with the models.
- Models are unreliable
Rhoowl at 13:38 PM on 8 April, 2015scaddenp....i don't know where you see in my posts where i am comparing weather forecast models to climate models....although those two models are very similiar...
as far as pinatubo...
http://earthobservatory.nasa.gov/Features/Volcano/
this explains how they used this eruption to model aerosols and test it against real world effects..it also went on to explain they ran several simulations..this is actually critical in determining the accuracy of the model...without real world test the models mean nothing..but you need many tests to ensure your model is properly working. trouble is the events that they can test are few and far between...it will take a very long time before they can refine the models to get accurate results..
not sure what your other comments are about...never mentioned any of those either.
- It hasn't warmed since 1998
DSL at 23:04 PM on 5 April, 2015Further, Peter, you claim to be an "AGW skeptic," but your argument is in regards to climate modeling. The theoretical basis of AGW does not emerge from climate modeling. The theory of AGW is simply that humans have enhanced the greenhouse effect, causing greater-than-natural warming. Climate modeling--and here I'll refer specifically to comprehensive general circulation modeling--projects climate change on the multidecadal scale and at fairly low resolution. The resolution is getting better (in some ways) in both time and space, but accuracy is not at the subdecadal scale yet.
All models of real world phenomena are inaccurate. Are they also then failures? If you take a step back and look at where the observed trends could have reasonably gone based simply on past history (a layperson's heuristic), you'd be forced to come to the conclusion that climate modeling has done remarkably well with projecting temp, sea level rise, OHC, etc. (not Arctic sea ice area/extent).
Consider this. Here's the key quote from Easterbrook:
"I find these similarities remarkable, because none of these patterns are coded into the climate model – they all emerge as a consequence of getting the basic thermodynamic properties of the atmosphere right. Remember also that a climate model is not intended to forecast the particular weather of any given year (that would be impossible, due to chaos theory). However, the model simulates a “typical” year on planet earth. So the specifics of where and when each storm forms do not correspond to anything that actually happened in any given year. But when the model gets the overall patterns about right, that’s a pretty impressive achievement."Anyway, any further discussion of modeling should be taken to one of the modeling threads. You can see all new comments across all threads by clicking on the "comments" link below the middle of the SkS header.
- The UK winter of 2014-15: another Tabloid FAIL
One Planet Only Forever at 00:53 AM on 29 March, 2015The sensationalized regional forecasts of what could happen more than a few days into the future are indeed a problem. They lead some people to believe that the difficulty in predicting such things must mean there is no way anyone can reliably model the future global climate.
This potential to develop misunderstanding, or mistrust, of the ability to model forecasts of global climate may be the motive behind some of the Tabloid nonsense, especially by Tabloids owned by deliberate disbelievers of climate science like Murdoch.
Another consequence of the poorly substantiated sensationalized 'predictions' is the association of those 'failed' predictions with other important climate forecasting that has the potential to be correct and require preventative measures to be implemented 'just in case'. A good example was the recent potential massive Blizzard event predicted for New York city. The storm track was further east than it might have been and as a result Boston and other locations got walloped in the way that New York might have been. The fact that New York was spared was seen by many to be proof of unnecessary sensationalizing of what might have happened. That attitude in a population is what leads to tragedies like Katrina where many people were left at risk in a city that was at serious risk because of a lack of interest in making the changes and improvements identified the last time a big hurricane hit the region because "it might not really be all that bad again soon". In advance of Katrina the residents of New Orleans understood that the freeway system not being elevated all the way through the city was a major concern, and indeed they were correct. And the city did not have any plans to move the poor who had no where to go and no way to get there.
Not all of these sensationalized predictions will be failures. And New Orleans would have suffered worse if the eye of Katrina and tracked west of the track it actually followed, just as New York was fortunate the Blizzard storm track was not further west than it ended up.
It is important to differentiate between the reliability of near term regional forecasts, especially the potential variability of storm tracks as little as one day in advance, from the more absured claims made about the regional expected weather more than one week into the future. And whenever that clarification of understanding is presented the completely different reliablity of global climate forecasting of general conditions averaged over many years should be mentioned. More people need to understand that the average contitions in the future can be very reliably forecast, in spite of the variability of the accuracy of near term regional forecasts.
- It's the sun
Tom Curtis at 12:21 PM on 20 March, 2015Leto @1141, for comparison, I took HadCRUT4 from 1880-2010 and used it as a model to predict GISS LOTI. To do so, I used the full period as the anomaly period. Having done so, I compared statistics with the Cowtan model as a predictor of temperatures. The summary statistics are (HadCRUT4 first, Cowtan Model second):
Correl: 0.986, 0.965
R^2: 0.972, 0.932
RMSE: 0.047, 0.067
St Dev: 0.047, 0.067
Clearly HadCRUT4 is the better model, but given that both it and GISS LOTI purport to be direct estimates of the same thing, that is hardly surprising. What is important is that the differences in RMSE and St Deviations between the HadCRUT4 model and the Cowtan model are small. The Cowtan model, in other words, is not much inferior to an alternative approach at direct measurement in its accuracy. Using HadCRUT4 as a predictive model of GISS, we also have a high standard deviation "error" (-2.5 StDev in 1948) with other high errors clustering around it.
This comparison informs my attitude to the Cowtan model. If you have three temperature indices, and only with difficulty can pick out that which was based on a forcing model to those which were based on compilations of temperature records, we are ill advised to assume that any "error" in the model when compared with a particular temperature index represents an actual problem with the model rather than a chance divergence. (On which point, it should be noted that the RMSE between the Cowtan model and observations would have been reduced by about 0.03 if I had adjusted them to have a common mean as I did with the two temperature indices.) Especially given that divergences between temperature indices show similar patterns of persistence.
Now, turning to your specific points:
"The bigger problem I have with the "It's chance" line of argument is that it seems to be largely devoid of explanatory power."
In fact, saying "it's chance" amounts to saying that there is no explanation, so of course it is devoid of explanatory power. In this particular context, it amounts to saying that the explanation is not to be found in either error in the measurements (of temperatures, forcings, ENSO, etc) nor in the model. That leaves open that some other minor influence or group of influences on GMST (of which there are no doubt several) was responsible. "Was", not "may be" because it is a deterministic system. However, the factor responsible may be chaotic so that absent isolating it (very difficult among the many candidates with so small an effect) and providing an actual index of it over time, we cannot improve the model.
"Asking why a particular patch of data-model matching is much worse than the rest is more analagous to the second situation, I believe."
Of course it is more analogous to the second situation. But the point is that the "it's chance" 'explanation' has a better than 5% (but less than 50%) chance of being right. That is, there is a significant chance that the model cannot be improved, or can only be improved by including some as yet unknown forcing or regional climate variation. The alternative to the "it's chance" 'explanation" is that the model can be improved by improving temperature, ENSO or forcing records to the point where it eliminates such discrepancies as found in the 1940s. On current evidence, odds on this is the case - but it is not an open and shut case that it is so.
- Models are unreliable
Tom Curtis at 20:21 PM on 3 March, 2015protagorias @various, of course climate modellers want to make their models more accurate. The problem is that you and they have different conceptions as to what is involved. There are several key issues on this.
First, short term variations in climate are chaotic. This is best illustrated by the essentially random pattern of ENSO fluctuations - one that means that though a climate model may model such fluctuations, the probability that it models the timeing and strengths of particular El Ninos and La Ninas is minimal. Consequently, accuracy in a climate model does not mean exactly mimicing the year to year variation in temperature. Strictly it means that the statistics of multiple runs of the model match the statistics of multiple runs of the Earth climate system. Unfortunately, the universe has not been generous enough to give us multiple runs of the Earth climate system. We have to settle with just one, which may be statisticaly unusual relative to a hypothetical multi-system mean. That means in turn that altering a model to better fit a trend, particularly a short term trend may in fact make it less accurate. The problem is accentuated in that for most models we only have a very few runs (and for none do we have sufficient runs to properly quantify ensemble means for that model). Therefore the model run you are altering may also be statistically unusual. Indeed, raw statistics suggests that the Earth's realized climate history must be statistically unusual in some way relative to a hypothetical system ensemble mean (but hopefully not too much), and the same for any realized run for a given model relative to its hypothetical model mean.
Given this situation, they way you make models better is to compare the Earth's realized climate history to the multi-model ensemble mean; but assume only that that realized history is close to statistically normal. You do not sweat small differences, because small differences are as likely to be statistical aberrations as model errors. Instead you progressively improve the match between model physics and real world physics; and map which features of models lead to which differences with reality so as you get more data you get a better idea of what needs changing.
Ideally we would have research programs in which this was done independently for each model. That, however, would require research budgets sufficient to allow each model to be run multiple times (around 100) per year, ie, it would require a ten fold increase in funding (or thereabouts). It would also require persuading the modellers that their best gain in accuracy would be in getting better model statistics rather than using that extra computer power to get better resolution. At the moment they think otherwise, and they are far better informed on the topic than you or I, so I would not try to dissuade them. As computer time rises with the fourth power of resolution, however, eventually the greater gain will be found with better ensemble statistics.
Finally, in this I have glossed over the other big problem climate modellers face - the climate is very complex. Most criticisms of models focus entirely on temperature, often just GMST. However, an alteration that improves predictions of temperature may make predictions of precipitation, or windspeeds, or any of a large number of other variables, worse. It then becomes unclear what is, or is not an improvement. The solution is the same as the solution for the chaotic nature of wheather. However, these too factors combined mean that one sure way to end the progressive improvement of climate models is to start chasing a close match to GMST trends in the interests of "accuracy". Such improvements will happen as a result of the current program, and are desirable - but chasing it directly means either tracking spurious short term trends, or introducing fudges that will worsten performance in other areas.
- Models are unreliable
Tom Curtis at 14:37 PM on 21 February, 2015Sangfroid @791, there is a major difference between the stockmarket (or currency trading) models and climate models. That is, the stockmarket models are entirely statistical. In contrast, the climate models encode well established physical laws into mathematical representations of the atmosphere. These are laws such as consevation of energy, conservation of energy, radiative transfer physics, boyles law etc. Because we cannot represent the atmosphere molecule by molecule, (or indeed, kilometer by kilometer), some of the laws are approximated based on empirical estimates of the effect of the laws in the real atmosphere. Consequently, when these models retrodict the temperature series, without having been trained on that temperature series, that is a significant prediction.
The achievement is even more impressive in that the models do not predict just a single time series (again unlike stock market models). The predict temperature series for a variety of different altitude and depths of the ocean. The predict major atmospheric and ocean circulations (including ENSO like effects). The predict precipitation changes, and changes in sea and land ice. They are not perfect at any of these - indeed do not always agree among themselves at any of these - but they do so with very far above chance accuracy. This would not be possible if they did not get the fundamental processes right - and if they were not in the right ball park for the subtle effects.
So, quite frankly, I consider your analogy to be on a par with somebody insisting that because a particular sum cannot be calculated in a reasonable time on an abacus, it cannot be calculated in much better time on a Cray xc-40.
- Claims that climate models overestimate warming are 'unfounded', study shows
frenchie at 08:08 AM on 8 February, 2015Many thanks for the link in Mod's response to post 15.
I'm in same boat as bjchip, trying to defend science against knuckleheads, but not really qualified to understand half the issues. But reading the paper... I think even a layman can spot what CA is trying to pull.
Their criticism isn't relevant to the question of model accuracy. It's about the next section, where the authors investigates "contributions of radiative forcing, climate feedback and ocean heat uptake" to the runs.
So even if they were right (which they probably aren't) - their criticism is completely irrelevant to the question of models being accurate.
Is that right? I'm hoping someone who understands this stuff better than me (I'm a carpenter), will be generous enough with their time, to take 5 minutes and verify... please?
- Things I thought were obvious!
One Planet Only Forever at 01:31 AM on 8 January, 2015dklyer@64,
I agree and have some things to add related to the erroneous results of the models of the likes of Milton Friedman. Often these people attempt to predict the future using an economic theory/model with a fundamantal presumption that the people making decisions, particularly the most powerful in leadership roles, would be highly averse to doing something that had a potential negative future consequence. That type of thinking would be the equivalent of a global climate theory/model that was based on human burning of fossil fuels not creating CO2 and that CO2 is not a greenhouse gas. The results of such models would never be accurate. And as long as those fundamentals of the theory/model do not change every attempt to 'add accuracy' will fail to produce meaningful helpful results.
I recall that Alan Greenspan (past Chairman of the US Federal Reserve) essentially said 'he had no idea that powerful wealthy people would ever do anything that was potentially damaging' when the US Congress asked him about why he did not foresee the damaging consequences of reduced fiscal regulation that produced the 2008 global tragedy.
The biggest global threat is the indifference many pursuers of profit, power and pleasure have regarding the helpfulness of their acions. Many such pursuers never try to be guided by a desire to help develop a sustainable better future for all life on this amazing planet (See footnote). That indifference to being helpful is a reality that is excluded from most economic models and is the reason the likes of Alan Greenspan fail to anticipate how wrong their 'leadership' is. Though indifference to being helpful is the major problem, the biggest trouble makers are the pursuers of personal power, profit and pleasuer who will deliberately do unhelpful or harmful things in pursuit of what they want. Any economic theory/model that fails to include the existence and potential for success of those type of people is destined to be wildly inaccurate.
This brings me to the evaluation of cost-benefit regarding action on the issue of global warming and climate change. Even people claiming to want to be helpful fail to properly evaluate the cost-benefit of climate change action. The proper evaluation needs to be one that ensures all actions of a current generation produce a sustainable better future fopr all. Evaluations that compare the 'cost/benefit to some in the current generations' against 'cost/benefit to future generations' are fundamentally incorrectly evaluating the acceptability of action by a current generation. Even if a current generation was to determine that the 'costs - lost opportunity to benefit' they evaluated were a match for the 'costs' they evaluated a future generation would face it is unacceptable for a current generation to impose costs onto a future generation, no matter how much benefit the current generation gets. It would be acceptable for a current generation to personally expend their own effort and profit to fully avert future costs, but even that would only be a neutral position, not a helpful development. And that type of balance case is prone to erroneous evaluation by people in a current generaton who are inclined to overstate the costs to the current generation and understate what needs to be done to create the minimum acceptable result of current generation activity, a neutral future condition that is not negatively affected by what the current generation did.
Foot Note - Fairly full disclosure. Referring to the recent reports of a climate change related encyclical being developed by Pope Francis, I am not Roman Catholic so I have not developed or acquired this attitude because of being aware of and adhering to the Roman Catholic position. I believe that there is a spiritual connecton between all life on this amazing planet. And I believe that the Old Testament (the Hebrew Bible) included some very good 'understandings' of how to live that needed to be updated (Leviticus chapters 11 through 15 provide advise about how to avoid food poisoning, how to deal with mold, and a few other helpful things that appear to be scientifically developed even though they are presented as 'rules from God'. And I consider Jesus to be a very wise person who provided important updates of the Old Testament. And I believe there are even more updates that are coming to be understood. Even though I do not believe in God and am an Engineer (and also have an MBA) my values appear to be very well aligned with the most progressive Christian and Muslim sects who are 'evolving their set of values rather than strictly adhering to interpretations of older documents'.
- Models are unreliable
Tom Curtis at 08:13 AM on 4 December, 2014SDK @784, what you are looking for was in fact provided in the draft version of the recent IPCC report:

In this graph, the range of the projections are given as the range between the mean projections for two different but plausible bau scenarios. To that is appended the grey zone representing the reasonable range of annual variability due to short term factors such as ENSO. The graph was ammended in the final report, mostly because of a fake controversy (see here and here)generated by ignoring that fact (which was not sufficiently emphasized by defenders of climate science, myself included). The graph does have some flaws, including an inappropriate baselining on a single year and the fact that the grey zone, out of graphic necessity, is drawn from the upper or lower limit of all projections. Therefore caution should be used in presenting that graph, which should not be presented without the disclaimers regarding its flaws, in links to rebutals of the trumped up controversy.
For these reasons, I prefer my own graph which plots observations against all model runs for AR4:

Doing so allows the actual model variability to define the expected annual variability, thereby eliminating the false perception of smoothness sometimes generated by showing only ensemble means for projections. The test for those claiming the models failed to project the current temperatures is to pick out the observations from the projections. If they cannot do so easilly, then the model projections have correctly captured both the trends (see below) and the range of annual variability.

- IPCC overestimate temperature rise
KR at 05:24 AM on 14 November, 2014A not-so-trivial note here: the 1990 FAR models used a direct forcing of CO2 simplified equation of 6.3*ln(C/C0) (see pg. 52 of the FAR Radiative Focing document), while later literature in particular Myhre et al 1998 using improved spectra computed a direct CO2 forcing of 5.35*ln(C/C0), changing that direct CO2 forcing estimate from 4.37 W/m2 to 3.7 W/m2. N2O and CFC simplified values were also updated at that time, those for CH4 were unchanged.
As with the Hansen 1988 predictions, this inaccuracy in early line-by-line radiative codes led to some overestimation of climate sensitivity and warming in those earlier GCMs - which, mind you, was not specifically due to errors in the GCMs, as they were using the best values available at the time.
- IPCC overestimate temperature rise
Tom Curtis at 11:44 AM on 11 November, 2014bcglrofindel:
1) In the estimates made using the energy balance diffusive model, the IPCC assumed a radiative forcing for doubled CO2 of 4 W/m^2 rather than the actual 3.7 W/m^2. The more accurate value was determined by Myhre et al (1998), and included in IPCC reports since the Third Assessment Report (2001).
2) The radiative forcing for the BAU scenario in 2015 for the energy balance diffusive model of IPCC FAR was 4 W/m^2 (Figure 6, Policy Makers Summary, IPCC FAR). For comparison, the current radiative forcing is 3 W/m^2 (IPCC AR4 Technical Summary, Table TS.7), 25% less. To properly test the actual model used in making the predictions, you would need to run the model with accurate forcings. An approximation of the prediction can be made by simply scaling the values, so that the IPCC 2030 predictions would be 0.83 C (0.53-1.13 C).
3) The reasons for the high value of the projected BAU forcings are:
a) The high estimate of radiative forcing for a doubled CO2 concentration already mentioned;
b) The fact that the model did not project future temperature changes; but the effect on future temperature changes based on changes in GHGs alone; and
c) A failure to predict the break up of the former Soviet Union, and the consequent massive reduction in emissions growth.
Factors (a) and (c) explain the discrepancy between the projected BAU forcing for GHG alone (4 W/m^2 for 2015) and the current observed forcing for GHG alone (3.03 W/m^2). From that, it is easy to calculate that there is a 16.75% reduction in expected (BAU) forcing due to reduced industry in the former Soviet Block (plus unexpectedly rapid reduction in HFC's due to the Montreal Protocol).
Thus insisting on a comparison of the actual temperature trend to the actual BAU projections in order to determine the accuracy of the model used by IPCC FAR amounts to the assumption that:
A) The IPCC intended the projections as projections of actual temperature changes rather than projections of the expected influence of greenhouse gases, contrary to the explicity statement of the IPCC FAR;
B) The IPCC should be criticized based on their use of the best current science rather than the scientific knowledge gained 8 years after publication, and 16 years prior to the current criticism (Myhre et al, 98); and
C) The failure of the IPCC to project the break up of the Soviet Union invalidates its global climate models.
The last leaves me laughing. I look forward to your produceing quotes from the critics of the IPCC dated 1990 or earlier predicting both the break up of the Soviet Union and a huge reduction in CO2 emissions as a result to show that they were wise before the event. Better yet would be their statements to that effect in peer reviewed literature so that the IPCC can be shown to be negligent in not noting their opinion. I expect confidently zero evidence of either (due to their not existing).
I am also looking forward to your defence of those three assumptions, as you seem to consider the direct comparison (rather than a comparison with the forcings of the model adjusted to observed values) to be significant. Failing that defence, or your acknowledgement that the assumptions are not only invalid but unreasonable, I will consider you to be deliberately raising a strawman.
4) Despite those issues, the 30 year trend to 2013 of the GISS temperature series is 0.171 C per decade, just shy of the 0.175 C per decade for the lower value. That it is just shy is entirely due to short term variation due to ENSO. The 30 year trend to 2007, for example is 0.184 C per decade, just above the lower limit. Further, that is a misleading comparison in that it treats the trend as linear, wheras it the projection in fact accelerates (ie, we expect a lower than 0.175 C trend in the first half of the period). Ergo, not withstanding all the points raised above, the IPCC FAR projections have not in fact been falsified - even without adjustments to use historical forcing data, and even ignoring the fact that it was not intended as a projection of future temperatures (but only of the GHG impact on future temperatures).
- Increasing CO2 has little to no effect
Tom Curtis at 13:47 PM on 30 October, 2014Donny @176, it is a bit hard to rebut "another article" when you provide no link so that I can read it myself. Nevertheless, the article probably refered to this graph from Harries et al 2001:
The graph shows the difference in OLR between April-June, 1970 and April-June 1997 over the eastern central tropical pacific (10 S to 10 N; 130-180 W). It shows that the OLR has increased slightly (top), but that the observed increase was matched by an predicted increase in the models (middle). The graphs are offset to allow easy comparison.
The question you should ask is why did the models predict an increased OLR even though the CO2 level had risen. The answer is that the region observed is right in the center of the ENSO pattern of variation. If you look at the pattern of ENSO variation, you will see that while there were slightly cool ENSO conditions in that zone in 1997, they were very much cooler in 1970:

Remember, warmer temperatures increase OLR, and the 1997 temperatures were distinctly warmer, and warmer beyond the mere expectation from global warming due to the ENSO pattern. That additional warmth above the AGW trend increased OLR beyond the additional reduction due to the slight increase in CO2 over that period. Indeed, it was only because of the additional warmth due to ENSO that the OLR increased. Had the increase in warmth been only that of the trend, the net OLR would have declined slightly.
Harries et al did not leave it there. They used a model to correct for the temperature difference, thereby showing the impact of greenhouse gases apart from the changes in temperature:
As expected, the change in GHG concentration reduces OLR.
I know that pseudoskeptics attempt to dismiss this data because a model was used to generate it. It was not, however, climate model. It was a radiation model (specifically Modtran3). This is the sort of accuracy you can get with radiation models:
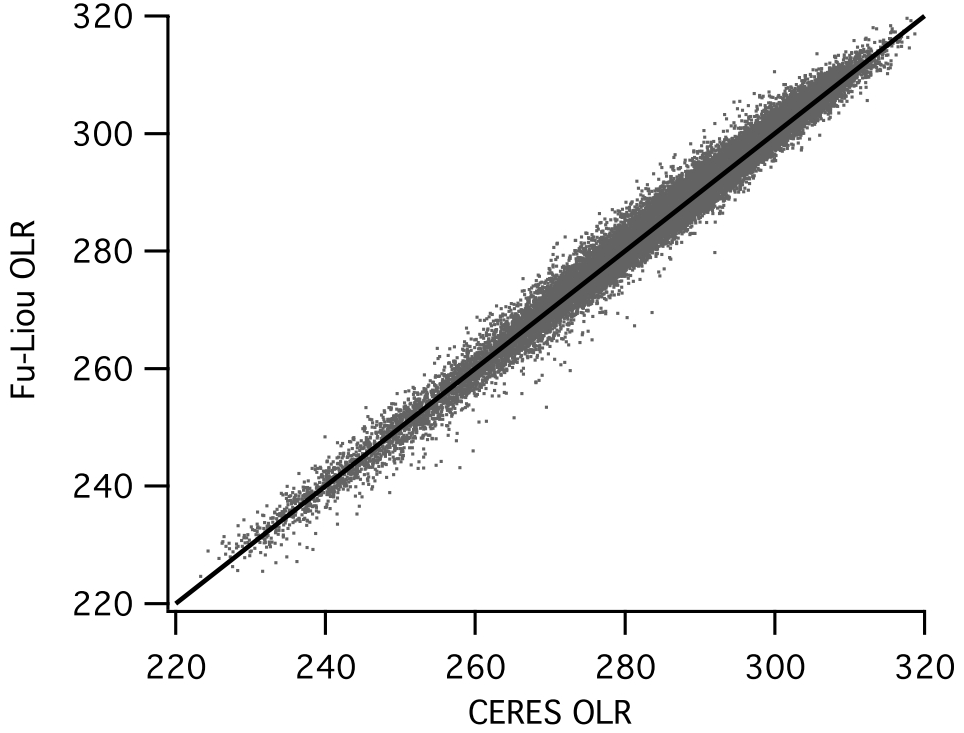
Because the adjustment was done with radiation code, denying the validity of the adjustment is tantamount to denying radiative physics altogether. It puts those who do it into flat earth society territory as regards to the level of their pseudo-science.
- Another global warming contrarian paper found to be unrealistic and inaccurate
Tom Curtis at 14:35 PM on 24 October, 2014Pierre-Normand @22, much of Roy Spencer's responce depends on asserting the adequacy of 1 dimensional models for assessing climate sensitivity. That, in one respect, is a fair line of defence. Spencer and Braswell (2014) used a one dimensional model, ie, a single vertical profile of the top 2000 meters of the ocean using globally averaged values. Because it uses globally averaged values, it necessarilly treats all points of the global ocean as having the same values, and so much of Abraham's critique amounts to a critique of the adequacy of such models in this application.
Spencer defends the adequacy of his model on the grounds that Hansen has purportedly claimed that, "... in the global average all that really matters for the rate of rise of temperature is (1) forcing, (2) feedback, and (3) ocean mixing." Following the link, however, I find no such claim by Hansen. He does claim that the global energy imbalance determines (in part) the final temperature rise from a forcing, but that is a far cry from asserting that treating only averaged values in a model will adequately determine when that will be (ie, determine the climate sensitivity factor).
Interestingly, Hansen did say, "Ocean heat data prior to 1970 are not sufficient to produce a useful global average, and data for most of the subsequent period are still plagued with instrumental error and poor spatial coverage, especially of the deep ocean and the Southern Hemisphere, as quantified in analyses and error estimates by Domingues et al. (2008) and Lyman and Johnson (2008)." It follows that, according to Hansen, Spencer's one dimensional model must be essentially useless over the period prior to 1970. Indeed, Hansen goes on to write:
"Earth's average energy imbalance is expected to be only about 0.5-1W/m2. Therefore assessment of the imbalance requires measurement accuracy approaching 0.1 W/m2. That target accuracy, for data averaged over several years, is just becoming conceivable with global distribution of Argo profiling floats. Measurements of Earth's energy imbalance will be invaluable for policy and scientific uses, if the observational system is maintained and enhanced."
Based on that, given the monthly data required for the empirical validation of Spencer's model, according to Hansen the model would be useless for all periods prior to 2004 at the earliest. (Note, long term averages are more accurate than monthly variations. It is the later, required by Spencer, that are inadequate prior to 2004; whereas estimates of the former would still be reasonable although with wide error margins.)
This brings us to the second basis on which Spencer claims adequacy, a claimed superior empirical fit to that of GCMs. That superior fit, however, is unimpressive both because it is purely the function of having tunable parameters, and does not take into account that while GCMs produce ENSO like fluctuations, they do not produce them in sync with the observed ENSO fluctuations. In constrast, Spencer imposes the observed ENSO fluctuations onto his model (which is not superior empirically until he does). Thus, the purported superior emperical fit is not an outcome of the model but an input.
All this, however, is beside the point. While nearly all climate scientists would see a use for one dimensional models, very few (other than Spencer) would consider them adequate to determine climate sensitivity with any real accuracy. They give ballpark figures only, and are known to lead to significant inaccuracies in some applications.
Turning to more specific points, one of Abraham's criticisms is the use of an all ocean world, a point Spencer responds to appeal to the adequacy of single dimensional models. However, in using an all ocean world, Spencer assumes that the total heat gain by the Earth's surface equals the ocean heat gain from depths of 0-2000 meters. That is, he underestimates total heat gain by about 10%, and consequently overestimates the climate sensitivity factor by about the same margin (ie, underestimates ECS by about 10%).
That is important because his estimated climate sensitivity factor with ENSO pseudo-forcing (Step 2) is 1.9 W/m-2K-1. Correcting for this factor alone it should be 1.7 W/m-2K-1, equivalent to an ECS of 2.2 C per doubling of CO2. The step 3 ECS would be much lower, but it only gains a superior emperical fit to step 2 on one measure, and obtains that superior fit by the tuning of eight different parameters (at least). With so many tuned parameters for a better fit on just one measure, the emperical suport for step 3 values is negligible.
A second of Abraham's criticisms is the failure to include the effects of advection. Spencer's response that his model includes advection as part of the inflated diffusivity coefficients would be adequate if (1) they varied between all layers instead of being constant for the bottom 26 layers, and (2) where set by emperical measurement rather than being tunable parameters. The first point relates to the fact that advection may differentially carry heat to distinct layers, and hence the effects of advection are not modelled by a constant ocean diffusivity between layers, even on a global average.
There may be other such nuances in relation to particular criticisms that I am not aware of. The point is that the appeal to the features of a one dimensional model does not justify Spencer and Braswell in ignoring all nuance. Therefore some of Abraham's criticisms, and possibly all of them still stand.
Finally, I draw your attention to Durack et al (2014). If their results are born out, it will result in Spencer and Braswell's model with current parameter choices predicting an ECS 25-50% greater than the current estimates, ie, 2.7-3.3 C per doubling of CO2. Of course, the parameters are tunable, and Spencer and Braswell will without doubt retune them to get a low climate sensitivity once again.
- Hansen's 1988 prediction was wrong
Tom Curtis at 13:01 PM on 23 October, 2014Talldave @20 claims, "Hansen's 1988 presentation was about emissions, as the Congressional record clearly shows."
Conveniently he neglects to link to the congressional record, where Hansen says:
"I would like to draw three main conclusions. Number one, the Earth is warmer in 1988 than at any time in the history of instrumental measurements. Number two, the global warming is now large enough that we can ascribe with a high degree of confidence a cause and effect relationship to the greenhouse effect. And number three, our computer climate simulations indicate that the greenhouse effect is already large enough to begin to effect the probability of extreme events such as summer heat waves."
Curiously, he makes no mention of emissions at all, when enumerating his three conclusions.
Later, and talking explicitly about the graph from Hansen et al (1988) which showed the three scenarios, he says:
"Let me turn to my second point which is the causal association of the greenhouse effect and the global warming. Causal association requires first that the warming be larger than natural climate variability and, second, that the magnitude and nature of the warming be consistent with the greenhouse mechanism. These points are both addressed on my second viewgraph. The observed warming during the past 30 years, which is the period when we have accurate measurements of atmospheric composition, is shown by the heavy black line in this graph. The warming is almost 0.4 degrees Centigrade by 1988. The probability of a chance warming of that magnitude is about 1 percent. So, with 99 percent confidence we can state that the warming trend during this time period is a real warming trend.
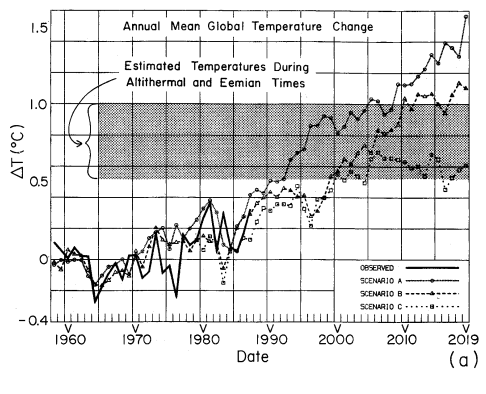
The other curves in this figure are the results of global climate model calculations for three scenarios of atmospheric trace gas growth. We have considered several scenarios because there are uncertainties in the exact trace gas growth in the past and especially in the future. We have considered cases ranging from business as usual, which is scenario A, to draconian emission cuts, scenario C, which would totally eliminate net trace gas growth by year 2000.
The main point to be made here is that the expected global warming is of the same magnitude as the observed warming. As there is only a 1 percent chance of an accidental warming of this magnitude, the agreement with the expected greenhouse effect is of considerable significance. Moreover if you look at the next level of detail in the global temperature change, there are clear signs of the greenhouse effect. Observational data suggests a cooling in the stratosphere while the ground is warming. ..."
(My emphasis)
Hansen then goes on to discuss other key signatures of the greenhouse effect.
As you recall, Talldave indicated that Hansen's testimony was about the emissions. It turns out, however, that the emissions are not mentioned in any of Hansen's three key points. Worse for Talldave's account, even when discussing the graph itself, Hansen spent more time discussing the actual temperature record, and the computer trend over the period in which it could then (in 1988) be compared with the temperature record. What is more, he indicated that was the main point.
The different emission scenarios were mentioned, but only in passing in order to explain the differences between the three curves. No attention was drawn to the difference between the curves, and no conclusions drawn from them. Indeed, for all we know the only reason the curves past 1988 are shown was the difficulty of redrawing the graphs accurately in an era when the pinacle of personal computers was the Commodore Amiga 500. They are certainly not the point of the graph as used in the congressional testimony, and the congressional testimony itself was not "about emissions" as actually reading the testimony (as opposed to merely referring to it while being carefull not to link ot it) actually demonstrates.
Ironically, Talldave goes on to say:
"This is part of what critics have accurately labelled the "three-card monte" of climate science: make a claim, then defend some other claim while never acknowledging the original claim was false."
Ironical, of course, because it is he who has clearly, and outragously misrepresented Hansen's testimony in order to criticize it. Where he to criticize the contents of the testimony itself, mention of the projections would be all but irrelevant.
As a final note, Hansen did have something to say about the accuracy of computer climate models in his testimony. He said, "Finally, I would like to stress that there is a need for improving these global climate models, ...". He certainly did not claim great accuracy for his model, and believed it could be substantially improved. Which leaves one wondering why purported skeptics spend do much time criticizing obsolete (by many generations) models.
- Your questions on climate sensitivity answered
Tom Curtis at 08:29 AM on 29 September, 2014ranyl @13, it would be helpfull to myself, and presumably other readers if you distinguish quotation from your own words. At a minimum, you should use quotation marks (on your keyboard next to the enter key). It would also be helpful if you used the indent function from the wysiwyg panel in the comments screen, indicated by the quotation mark signal.
Trivial points aside, it is very easy to get a long list of papers which indicate models may (there is disagreement on the point among relevant scientists) overestimate CO2 drawdown (or climate sensitivity). It is equally easy to get long lists of papers which indicate models may overestimate the same. Climate change deniers continually refer to the later and ignore the former, in a process that is called pseudoscience. It is no more scientific to continually refer to the former and ignore the later. The climate scientists who actually device the models, such as David Archer, keep track of both; and revise the models on the basis of the balance of evidence.
So:
- While you can list a series of reasons to think the models underestimate draw down, it has recently been shown that volcanic emissions are significantly larger than previously thought, which implies a larger draw down rate, and hence that models underestimate the draw down.
- The models in question have with reasonable accuracy retrodicted the Earth's carbon budget over the last 600,000 years. While they are likely to be wrong in detail (as with all models), they are therefore unlikely to be wrong about the basic picture.
- The higher temperatures and sea levels in the pliocene where in a near full equilbrium condition. That is, they were achieved as the Earth achieved its Earth System Climate Sensitivity, which is noticably higher than the Equilibrium Climate Sensitivity or the more relevant (over the coming two centuries) Transient Climate Response.
- Finally, anybody who knows me knows I am not sanguine about about even 500 ppmv, let along 650. As a matter of urgency we need to stop net anthropogenic emissions before atmospheric CO2 tops 450 ppmv. Not, however, due to some panicked forecasts about the effect of a current 400 ppmv 500 plus years down the track.
- The 97% v the 3% – just how much global warming are humans causing?
jwalsh at 22:55 PM on 22 September, 2014Moberg 2005 trend from 1600-1850 - 0.08 C / Century.Moberg 2005 mean trend from start years between 1600 to 1700 inclusive through to 1850 - 0.09 C / Century
Moberg 2005 maximum trend from a start year between 1600-1700 inclusive to 1850 - 0.11 C / Century.
jwalsh overestimation factor 175-250%
Ahh. I see your error straight away. Yes, picking an end still at what is considered to be the end of the little ice age would indeed give a low estimate, and wrong just by inspection. The IPCC considers about 1950 as being the threshold period when anthropogenic causes start to be detectable in the record. Before then anthropogenic forcings just too small.
1600-1950 Moburg 2005 by my quick math : ABS(0.9-0.2 (deg. C approx))/35 decades = 0.02 deg C./decade .....exactly as I said. I should have specified a range. But it honestly didn't occur to me that someone familiar with climate would decide that 1850 at the end of the LIA was a sensible choice.
As for the troll discussion? I prefer to keep things on a mature and civil level or not at all. I'm funny that way. I think you'll find that it's not that easy to get a rise out of me though. I'm not so thin-skinned. Perhaps it's a relative age thing.
Standard troll attempt to mistake regional (Greenland) temperatures for global or NH temperatures by jwalsh - One to date.
Yes, there's a tricky limitation with ice cores. The ones at the equator don't last nearly as long. I didn't say they were a perfect match to NH temps (or global). Evidence that the Greenland temperature swings were localized for some reason? None provided. Evidence of the Minoan, Roman, and Medieval warm periods from either historical records and other proxies? Hell yes. But sure, might not be as extreme in swing. Do you have a good explanation for the approximately 1200 year cycles?
Firstly there are positive anthropogenic forcings of which CO2 is the biggest, and scariest because it is very long-lasting. The force of this first group can be evaluated with some accuracy.
Agree with that. Especially for the present and future.
Secondly is negative anthropogenic forcings.
I kind of agree with Lord Monckton that this appears to be somewhat of a universal "fudge-factor", varying wildly. I think it's over-estimated. And there's evidence that it was declining into the late 20th century.
The third category is natural forcings which can be evaluated with fair accuracy. There is no evidence to suggest they are very large. There is no evidence to suggest they are at present a positive forcing.
The fourth category is unforced internal variability of the climate system. There is no reasonable evidence to suggest this is a large effect.A combination of the two of these seem to be completely off-setting anthropogenic warming for the last decade and a half, and may have accounted for a good piece of the 1980-1998 warming. I think this is the IPCC's current biggest challenge. I have yet to see convincing a explanation for the 1910-1940 warming, and the above two reasons seem as likely as any other.
I see you missed my bit about the IPCC currently (and quietly) estimating temperatures at the the bottom range of model estimates (and even below). This appears to be an expert determination that the models are simply over-projecting by the IPCC. Perhaps you disagree with the IPCC on this. Your prerogative.
- The 97% v the 3% – just how much global warming are humans causing?
jwalsh at 12:37 PM on 16 September, 2014I am uncertain why there is the focus on Figure 10.5 from IPCC AR5. Not even the IPCC, years ago, considered that representative of all areas of climate science. 10.5 is derived from 10.4 which is derived from.... Well may as well let the IPCC explain.
"The results of multiple regression analyses of observed temperature
changes onto the simulated responses to GHG, other anthropogenic and natural forcings are shown in Figure 10.4 (Gillett et al., 2013;
Jones et al., 2013; Ribes and Terray, 2013)."The papers referenced (3 in total) are based on climate models, and observations from them. The extent to which anyone (including the IPCC) considers that a true picture of attribution, relies on the extent of belief in the accuracy of the model ensembles. And everyone knows there are problems there. Even the author of one of those papers authored another, "Overestimated global warming over the past 20 years" acknowledging observed model discrepencies. Numerous theories abound about why the models were inaccurate, but there is almost universal agreement that they were inaccurate. I have no idea why. Not my field. In fact, I think it's safe to say that nobody knows yet. Models, as expected, are going to continually be refined and get better and better.
- Climate models accurately predicted global warming when reflecting natural ocean cycles
KR at 07:07 AM on 26 July, 2014Anne Ominous - Climate deniers frequently note that observations are at the edge of the model envelope, and then claim the models are useless/wrong and we should ignore them. Foolish rhetoric, really, since even perfect models show stochastic variation on different runs, and neither the model mean nor any single individual run will therefore exactly match the trajectory of observations. Climate models aren't expected to track short term observations of climate variations, but rather explore long term trend averages.
This paper is an elegant demonstration that models do reproduce shorter term global temperature trends and patterns when model variations match observations - strong support for the accuracy and physical realism of those models, and their usefulness when exploring longer term trends where those variations average out.
Demonstrating that models are physically accurate enough to model the range of short term variations, and that observations are indeed within the envelope of modeled behavior, is hardly a waste of time. It shows that the models are useful.
- Climate models accurately predicted global warming when reflecting natural ocean cycles
miro at 13:29 PM on 24 July, 2014We present a more appropriate test of models where only those models with natural variability (represented by El Niño/Southern Oscillation) largely in phase with observations are selected from multi-model ensembles for comparison with observations. These tests show that climate models have provided good estimates of 15-year trends, including for recent periods and for Pacific spatial trend patterns.
I'm a bit confused by this as well. I must admit looking at the maps of the regional trends around the Pacific look inaccurate based on the graphs shown by Russ. This seems to conflict with the bolded text above. I'm not convinced anyone has really provided a reasonable answer to this. Either;
1) The authors actually mean a different thing when they talk about "Pacific spatial trend patterns" than what Russ believes, and that phrase does not refer to the regional distribution of warming in the Pacific region but rather something else. In this case, what exactly are the authors referring to here?
2) The maps are misleading in some way, making similar trends actually look completely different.
3) The models are in fact inaccurate, and the authors are incorrect in the bolded statement.
It's confusing because the paper's goal seems to be to test whether models can provide the correct global temperature scales if the ENSO input is modelled correctly, and it shows that the models are actually accurate globally. But this almost throwaway line seems to suggest that the spatial distribution of the warming was also predicted correctly, when it really looks like it wasn't.
Some commentators have pointed out that the model's aren't expected to get the spatial distribution of warming accurate, and that's fine, I don't think anyone (excluding Watts, Monckton, et al) can reasonably expect accuracy where the models are not designed to provide it, but if that's the case, why is the bolded phrase even included in the paper?
- Climate models accurately predicted global warming when reflecting natural ocean cycles
Tom Dayton at 02:20 AM on 23 July, 2014Russ, your "cherry picking" complaint is groundless. The researchers' goal was to identify a source of model inaccuracy at a 15 year timescale. The researchers did not conclude that those particular models are better than other models at projecting global temperature. As Rob pointed out, the researchers selected only particular runs. The models used for those runs did not accurately predict ENSO events in other runs, nor will those models accurately predict ENSO events in future runs. The researchers did not claim that climate models are better than previously thought. They "merely" identified a still-unsurmounted barrier to models projecting well at short timescales.
- Joseph E. Postma and the Greenhouse Effect
Tom Curtis at 10:17 AM on 20 July, 2014Just for future reference, in case Postma ever returns:
1) JPostma @51 begins with an odd little screed that ends with the claim that:
"Thus, there are indeed material and factual objections which clearly relegate the back-radiation/trapping hypothesis as defunct, as there are actual factors which already lend to a higher bottom-of-atmosphere temperature."
Reduced to its essence, this is a claim that there are more than one factor which raise Global Mean Surface Temperatures above what we would expect from insolation alone, and that consequently the atmospheric greenhouse effect cannot also do so. That, of course, is a complete non-sequitur. It is equivalent to arguing that because at least five men are carrying a coffin, there cannot be a sixth man carrying it as well.
It turns out that these other explanations mostly come down to thermal inertia. Make no mistake, thermal inertia does warm the Earth. The do so because energy radiated by a black body goes up with the fourth power. Thus, if you have a globe with a surface temperature of 388 K on on half, and 188 K on the other half, it will radiate 1,285 W/m^2 to space on the warm side, and only 71 W/m^2 on the cold side, for an average of 678 W/m^2. It will also have an average temperature of 288 K (~15 C). In constrast, a globe with a surface temperature of 288 K would only radiate 390 W/m^2, or 58% less. Thus the globe with uneven temperatures radiates far more energy to space than does the one with even temperatures. It would be warmer for the same energy recieved than the globe with even temperatures.
The problem for Postma is that the zero energy model calculation of the expected Earth surface temperature assumes an equal temperature over the entire Earth's surface. That it, it already allows for a greater contribution to the Earth's warming from equal temperatures than actually exists. Therefore, latent heat cannot explain the 33 C discrepancy it finds between the energy recieved by the Earth, and the global mean surface temperature.
2) Postma repeatedly ridicules the "one D" model as being completely unrealistic. He however, develops a model of the diurnal temperature cycle, which he describes in the previously linked paper, by saying:
"However, the mass of a one-square meter column of air is about 10,000kg, and if it has an average temperature of 255K, has a total energy content of about 10000 kg * 255 K * 1006 J/kg/K = 2.56 x 10⁹ J. With a TOA output around 240 W/m2, the column will lose 10.4 MJ of heat overnight, which would correspond to an aggregate temperature reduction of 0.4% or 10 C. As can be seen from real-world data, the ground surface and near-surface-air drop in temperature by about ten-times that amount overnight, which means that most of the cooling of the column actually occurs at the surface, and thus cooling there is actually enhanced relative to the rest of the column, rather than impeded."
The implicit model for this calculation assumes that the radiation from all levels is 240 W/m^2, that the average temperature of the atmospheric column is 255 K, that the diurnal temperature range is equal across the entire column, and that the heat dump due to the diurnal temperature range is all to space. He purports this model represents the prediction of the greenhouse effect; and his conclusion from it makes it into his summary points (point 6), and has been mentioned here (although I could not be bothered chasing down in which post). The key point about this model is that every one of its features is false. So when Postma rails about the error of using a simple model (albeit solely for teaching), it shoud be born in mind that he also uses simple models. There are key differences, however. It can be shown mathematically that the use of a spherical model equivalent to the simple model used to teach by climate scientists generates the same results, and it is only used for teaching. Further, it can be shown that once corrected for accuracy as in a GCM, the simple models results can be largely reproduced. Postma's even more eroneous model, however, shares none of these features. I will show only one of these points, the difference in diurnal temperature range with altitude:

3) Finally, it turns out that "ontological mathematics" is the brain child not of Postma, but of "Mike Hockney", whose book, "Why Math Must Replace Science" is described by Postma as "The Best Science in the Universe", going on to say:
"The God Series of books by Mike Hockney are, truly, the best set of books on philosophy, science, politics, religion, psychology, death, and life, that have ever been produced in the history of man. The latest book by Hockney is the best of them all"
In its Amazon blurb, we read:
"It’s time to replace the scientific method with the mathematical method. It’s time to recognize that true reality is intelligible, not sensible; noumenal, not phenomenal; unobservable, not observable; metaphysical, not physical; hidden, not manifest; rationalist, not empiricist; necessary, not contingent. Physics is literally incapable of detecting true reality since true reality is an eternal, indestructible, dimensionless mathematical Singularity, outside space and time. The Singularity is a precisely defined Fourier frequency domain. There’s nothing “woo woo” about it. It's pure math.
Physicists suffer from a disorder of the mind that causes them to believe that sensible, temporal objects have more reality than eternal, immutable Platonic mathematical objects, and to place more trust in their senses than in their reason, more trust in the scientific method of “evidence” than the mathematical method of eternal proof.
Never forget that sensory objects are just ideas in the mind. According to quantum physics, objects are just the observable entities produced by the collapse of unreal wavefunctions, and don’t formally exist when they are not being observed. Niels Bohr, in response to Einstein, literally denied that the moon existed when it wasn’t being observed."
I would say that you could not make this stuff up, but somebody obviously did.
In lieu of a biography, in Mike Hockney's Amazon biography reads (in part):
"Pythagorean Illuminism - the religion of the Illuminati - is the world's only Logos, rational religion. Illuminism rejects faith, rejects prophets, rejects holy books, rejects "revelation", and rejects any Creator. Instead, Illuminism is about the necessary, analytic, immutable, a priori, eternal Platonic truths of mathematics. Mathematics alone furnishes the unarguable, definitive answer to existence. That answer, incredibly, revolves around the immortal, indestructible human soul (the "singularity"). The "Big Bang" - a singularity event - was all about soul (all the souls of the universe, in fact)! The soul is none other than the most basic unit of mathematics: the dimensionless, unobservable point. The soul is "nothing", yet it is also infinity - because it comprises positive and negative infinity, which cancel to nothing. The soul is neither being nor non-being. The soul is BECOMING. If you want to know what it's becoming, read The God Series."
So Hockney consciously positions his "theory" as the religion of the Illuminati, something Postma is aware of and accepts (though when he blogs about it, he calls it "illuminism").
My point? Somebody who would accept and promote this complete tripe is so far beyond crazy they can't see the line anymore. Forget moonlanding conspiracy theorists. They are sane compared to this stuff. And yet the "dragon slaying" branch of AGW skepticism show such profound ability to sort the mental wheat from the chaffe that Postma is one of their leading lights.
Clearly no rational dialogue (socratic or otherwise) is possible with Postma.
- Joseph E. Postma and the Greenhouse Effect
scaddenp at 08:11 AM on 16 July, 2014JPostma, do you agree:
1/ That despite your difficulties with the layer model as a teaching tool, climate scientists do not have a such problem as evidenced by eg Smith 2008 and by the codes.
2/ In a botanical greenhouse, the primary effect is convection which massively overpowers any radiative effect. The Greenhouse Effect is inaptly named but that doesnt make it wrong.
3/ The most important test of the model is whether the numbers it produces match what you observe in empirical testing. This is after all how the model informs climate science.
4/ The actual radiative codes used (Hitran) predict the radiative power and spectra for both incoming and outgoing radiation to a remarkable degree of accuracy. - Models are unreliable
nearlyman at 04:16 AM on 10 July, 2014I spent my career building models of financial markets. The notion that a model is 'good' if it correctly predicts unseen data from the historical record is laughable (i.e. the model is tested on a rolling window of data to see if it accurately predicts the subsequent unseen period).
There are two problems, one well understood and one almost universally ignored. The first is that as new explanatory variables are added to the model to improve the forecast accuracy, the unreliability of the model increases. This can be calculated - and almost always means that in complex systems, simple models outperform as predictors even though they are less accurate when back tested. Any discussion of the models that does not discuss this trade off is nonsense. In markets this means that the 'best' models are only slightly better than random, but are reliably better - the key then is risk management. I believe that the same should apply to a complex system like climate. The uncertainty in a 'good' model will make it useless for predicting the future and only useful for risk management.
The less common problem ignored by scientists in many many disciplines, is that knowing what models do not work is a hidden 'look ahead' that is the bane of quant reseachers in financial markets. For example, when building a model of the stock market, it is very very difficult to forget that it crashed in 1987. This knowledge influences the choices that model builders make - they just cannot help themselves. That is why so few people make money in systemaic trading - it is not just a scientific, mathematical, statistical and computational challenge - it is philosophically and psychologically challenging. In markets it doesn't really matter - long live the deluded models with their artificial certainty! They represent profit opportunity for other participants. In building climate models we do not have this comfort.
For the record, I believe that the world is warming and that this will have consequences. I also believe that the models are laughably wrong and that there only reliable attribute is that they will continue to fail to predict the outcome at any useful level of accuracy once unleashed on truly unknown data (otherwise known as the future).
The sooner the debate moves on to how we manage the risk of a warming planet, the better.
Oh, by the way, it is also obvious that we cannot stop it warming by flying less or driving a Prius. This is is not just an economic observation (though economics alone mean it will not happen) but also an obvious consequence of the prisoner's dilemma. Why should I stop flying if the Chinese are building a new coal fired power station every week? I repeat risk management - if it warms by more than X, what could/should we do? That is where the money and time should be spent.
- Models are unreliable
Composer99 at 12:25 PM on 6 June, 2014Winston2014:
You can propose, suppose, or, as you say, "show" as many "factors that aren't modelled that may very well be highly significant" as you like.
Unless and until you have some cites showing what they are and why they should be taken seriously, you're going to face some serious... wait for it... skepticism on this thread.
You can assert you're "playing the proper role of a skeptic" if you like. But as long as you are offering unsupported speculation about "factors" that might be affecting model accuracy, in lieu of (a) verifiable evidence of such factors' existence, (b) verifiable evidence that climatologists and climate modellers haven't already considered them, and (c) verifiable evidence that they are "highly significant", I think you'll find that your protestations of being a skeptic will get short shrift.
Put another way: there are by now 15 pages of comments on this thread alone, stretching back to 2007, of self-styled "skeptics" trying to cast doubt on or otherwise discredit climate modelling. I'm almost certain some of them have also resorted to appeals to "factors that aren't modelled that may very well be highly significant", without doing the work of demonstrating that these appeals have a basis in reality.
What have you said so far that sets you apart?
- Models are unreliable
Winston2014 at 11:42 AM on 6 June, 2014"BTW, the above risk-reward analysis is the driver of policy response. Climate models have nothing to do with it. Your statement repeated after that 12min video that "Models will drive policy" is just nonsense. Policy should be driven by our best understanding of the ECS. ECS is derived from mutiple lines of evidence, e.g. paleo being one of them. The problem has nothing to do with your pathetic "Models fail. Are they still useful?""
Equilibrium Climate Sensitivity
http://clivebest.com/blog/?p=4923
Excerpt from comments:
"The calculation of climate sensitivity assumes only the forcings included in climate models and do not include any significant natural causes of climate change that could affect the warming trends."
If it's all about ECS and ECS is "determined" via the adjustment of models to track past climate data, how are models and their degree of accuracy irrelevant?
- Models are unreliable
Winston2014 at 02:01 AM on 6 June, 2014Have these important discoveries been included in models? Considering that it is believed that bacteria generated our initial oxygen atmosphere, one that metabolizes methane should be rather important when considering greenhouse gases. As climate changes, how many more stagnant, low oxygen water habitats for them will emerge?
Bacteria Show New Route to Making Oxygen
http://www.usnews.com/science/articles/2010/03/25/bacteria-show-new-route-to-making-oxygen
Excerpt:
Microbiologists have discovered bacteria that can produce oxygen by breaking down nitrite compounds, a novel metabolic trick that allows the bacteria to consume methane found in oxygen-poor sediments.
Previously, researchers knew of three other biological pathways that could produce oxygen. The newly discovered pathway opens up new possibilities for understanding how and where oxygen can be created, Ettwig and her colleagues report in the March 25 (2010) Nature.
“This is a seminal discovery,” says Ronald Oremland, a geomicrobiologist with the U .S. Geological Survey in Menlo Park, Calif., who was not involved with the work. The findings, he says, could even have implications for oxygen creation elsew here in the solar system.
Ettwig’s team studied bacteria cultured from oxygen-poor sediment taken from canals and drainage ditches near agricultural areas in the Netherlands. The scientists found that in some cases the labgrown organisms could consume methane — a process that requires oxygen or some other
substance that can chemically accept electrons — despite the dearth of free oxygen in their environment. The team has dubbed the bacteria species Methylomirabilis oxyfera, which translates as “strange oxygen producing methane consumer.”--------
Considering that many plants probably evolved at much higher CO2 levels than found at present, the result of this study isn't particularly surprising, but has it been included in climate models? Has the unique respiration changes with CO2 concentration for every type of plant on Earth been determined and can the percentage of ground cover of each type be projected as climate changes?
High CO2 boosts plant respiration, potentially affecting climate and crops
http://www.eurekalert.org/pub_releases/2009-02/uoia-hcb020609.php
Excerpt:
"There's been a great deal of controversy about how plant respiration responds to elevated CO2," said U. of I. plant biology professor Andrew Leakey, who led the study. "Some summary studies suggest it will go down by 18 percent, some suggest it won't change, and some suggest it will increase as much as 11 percent."
Understanding how the respiratory pathway responds when plants are grown at elevated CO2 is key to reducing this uncertainty, Leakey said. His team used microarrays, a genomic tool that can detect changes in the activity of thousands of genes at a time, to learn which genes in the high CO2 plants
were being switched on at higher or lower levels than those of the soybeans grown at current CO2 levels.Rather than assessing plants grown in chambers in a greenhouse, as most studies have done, Leakey's team made use of the Soybean Free Air Concentration Enrichment (Soy FACE) facility at Illinois. This open-air research lab can expose a soybean field to a variety of atmospheric CO2
levels – without isolating the plants from other environmental influences, such as rainfall, sunlight and insects.Some of the plants were exposed to atmospheric CO2 levels of 550 parts per million (ppm), the level predicted for the year 2050 if current trends continue. These were compared to plants grown at ambient CO2 levels (380 ppm).
The results were striking. At least 90 different genes coding the majority of enzymes in the cascade of chemical reactions that govern respiration were switched on (expressed) at higher levels in the soybeans grown at high CO2 levels. This explained how the plants were able to use the increased
supply of sugars from stimulated photosynthesis under high CO2 conditions to produce energy, Leakey said. The rate of respiration increased 37 percent at the elevated CO2 levels.The enhanced respiration is likely to support greater transport of sugars from leaves to other growing parts of the plant, including the seeds, Leakey said.
"The expression of over 600 genes was altered by elevated CO2 in total, which will help us to understand how the response is regulated and also hopefully produce crops that will perform better in the future," he said.
--------
I could probably spend days coming up with examples of greenhouse gas sinks that are most likely not included in current models. Unless you fully understand a process, you cannot accurately “model” it. If you understand, or think you understand, 1,000 factors about the process but there are another 1,000 factors you only partially know about, don't know about, or have incorrectly deemed unimportant in a phenomenally complex process, there is no possibility whatsoever that your projections from the model will be accurate, and the further out you go in your projections, the less accurate they will probably be.
The current climate models certainly do not have all the forces that create changes in the climate integrated, and there are who knows how many more factors that have not even been realized as yet. I suspect there are a huge number of them if my reading about the newly discovered climate relevant factors discovered almost weekly is anything to judge by. Too little knowledge, too few data points or proxy data points with uncertain accuracy lead to a "Garbage in - Garbage models - Garbage out" situation.
- Models are unreliable
Tom Curtis at 10:21 AM on 5 June, 2014Winston @734, the claim that the policies will be costly is itself based on models, specifically economic models. Economic models perform far worse than do climate models, so if models are not useful "... for costly policies until the accuracy of their projections is confirmed", the model based claim that the policies are costly must be rejected.
- Models are unreliable
Winston2014 at 09:58 AM on 5 June, 2014DSL,
"Models fail. Are they still useful?"
Not for costly policies until the accuracy of their projections is confirmed. From the 12 minute skeptic video, it doesn't appear that they have been confirmed to be accurate where it counts, quite the opposite. To quote David Victor again, "The science is “in” on the first steps in the analysis—historical emissions, concentrations, and brute force radiative balance—but not for the steps that actually matter for policy."
"Models will drive policy"
Until they are proven more accurate than I have seen in my investigations thus far, I don't believe they should.
The following video leads me to believe that even if model projections are correct, it would actually be far cheaper to adapt (according to official figures) to climate change than it would be to attempt to prevent it based upon the "success" thus far of the Australian carbon tax:
The 50 to 1 Project
https://www.youtube.com/watch?v=Zw5Lda06iK0
- Models are unreliable
KR at 04:44 AM on 4 June, 2014nickels - If you feel that the climate averages cannot be predicted due to Lorenzian chaos, I suggest you discuss this on the appropriate thread. Short answer: chaotic details (weather) cannot be predicted far at all due to nonlinear chaos due to slightly varying and uncertain detailed starting conditions. But the averages are boundary problems, not initial value problems, are strongly constrained by energy balances, and far more amenable to projection.
Steve Easterbrook has an excellent side-by-side video comparison showing global satellite imagery versus the global atmospheric component of CESM over the course of a year. Try identifying which is which, and if there are significant differences between them, without looking at the captions! Details (weather) are different, but as this model demonstrates the patterns of observations are reproduced extremely well - and that based upon large-scale integration of Navier-Stokes equations. The GCMs perform just as well regarding regional temperatures over the last century:

[Source]
Note the average temperature (your issue) reconstructions, over a 100+ year period, and how observations fall almost entirely within the model ranges.
Q.E.D., GCMs present usefully accurate representations of the climate, including regional patterns - as generated by the boundary constraints of climate energies.
---
Perhaps SkS could republish Easterbrooks post? It's an excellent visual demonstration that hand-waving claims about chaos and model inaccuracy are nonsense.
- Models are unreliable
nickels at 03:16 AM on 4 June, 2014Oh, and this inability to integrate the model forward with accuracy doesn't even touch on the fact that the model itself is an extreme approximation of the true physics. Climates models are jam-packed with adhoc parameterizations of physical process. Now the argument (assuming the model was perfect) is that averages are computable even if the exact state of the climate in the future is not. Its a decent arguement, and in general this is an arguable stance. However, there is absolutely no mathematical proof that the average temperature as a quantity of interest is predictable via the equations of the climate system. And there likely never will be. But, again, all of this is not a criticism of climate modelling. They do the best they can. The future is uncertain nonetheless.
- Models are unreliable
nickels at 03:07 AM on 4 June, 2014@scaddenp, in fact the navier stokes are absolutely non-predictable. This is what the whole deal with Lorenz is all about. In fact, we cant event integrate a simple 3 variable differential equation with any accuracy for anything but a small amount of time. Reference:http://www.worldscientific.com/doi/abs/10.1142/S0218202598000597
Now, if we assume that climate scientists are unbiased (I've been in the business, this would be a somewhat ridiculous assumption), the models would provide our BEST GUESS. But they are of absolutely NO predictive value, as anyone who has integrated PDE's where the results matter (i.e. Engineering) knows.
- Global warming theory isn't falsifiable
Tom Curtis at 16:18 PM on 10 May, 2014mbarrett @55, it is hard to disagree that the "...public may rightfully use scientific tools such as falsifiability to analyse the legitimacy of climate science arguments...". You appear, however, to not know what is meant by that - and demonstrate it immediately by continuing your claim, specifying that that right extends to analyzing "...to the legitimacy of climate science arguments that are presented in summarised, or superficial form".
Certainly the public has a right to check the accuracy and adequacy of summary presentations of science, but that is not a process of falsification. Checking the accuracy of reports of science involves comparisons of the report to the original science, ie, the scientific papers and review articles on which the reports are based. Further, while the public has the right to do that, only those of the public sufficiently scientifically literate to read and comprehend the original papers are able to do it. Asserting the public's right to do something without asserting also the public's responsibility to make sure they are sufficiently able to do it is mere demagoguery.
As noted, not only does the public have the right to fact check popular articles, they have the right to check the scientific adequacy of the original science - but again the responsibility to be sufficiently informed applies. Based on hard experience, scientists consider it necessary to get the equivalent of a Bachelor of Science with Honours, and be well on the way to completing a PhD to reach that level of qualification. While we need not expect the public to go to that extent, we should at least expect them to be approaching that level of expertise before they comment. The sad fact, however, is that most comments by so-called "skeptics" here and across the net come from people who do not even understand the theory they purport to falsify. Sadly, this cartoon fairly represents the current state of public debate on global warming:

Finally, as we are talking about falsification, before publicly commenting on whether or not a theory is falsified, people should at least understand what is meant by "falsification". At a minimum they should know the difference between universal and existential statements (with the former being falsifiable but not verifiable, and the later being verifiable and not falsifiable); between methodological and naive falsification; and also understand the Duhem-Quinne thesis, and its relevance to falsification. Lacking that understanding, attempts at falsification reduce to crass cherry picking of straw man theories.
Your list of problematic features suggests you do not have that level of understanding. As the topic here (even with the absent OP) is falsification, and given your introduction, it appears that you consider "problematic" features as being those that indicate the underlying theory to be either falsified, or unfalsifiable - where the latter indicates it has no empirical content. Yet you list features (purported ad hominen attacks, "perceived" reluctance to share data and methods, supposed reliance on models, etc, which have no bearing on whether or not a theory is falsifiable. I get the distinct impression that you have merely used the topic here to introduce vague claims without justification in a topic where defence of those claims will be "off topic", so that you will not have to defend them.
The most bizzare claim you make is that the reliance on models is problematic with regard to falsification. In fact, a theory is just a set of propositions closed under implication. A model is a set of propositions closed under implication with particular initial and boundary conditions. A model, therefore, takes a theory and shows the empirical implications of that theory under certain empirical conditions. Models, are, therefore, the means of generating falsifiable content from a theory. With the understanding that mathematically (and logically), a model is a set of equations plus initial and boundary values, models need not be computer models. Further, no theory that is not presented as a model (ie, the equations plus conditions) has falsifiable content.
If you truly understood science and falsification, you would, as I, not find the use of models in climate science as problematic. Rather, you would find the almost complete lack of models from skeptics concerning. It means that in scientific terms, they have no theory. Just some words to act a rallying cries. (There are, of course, a few exceptions to this generalization.)
- Models are unreliable
marisman at 07:43 AM on 8 May, 2014Listening to Dr. Gavin Schmidt speak, he spends a fair amount of time talking about how complex the problem is. I agree. That is my point entirely. While I don't study climatology, I do understand what you do. I also understand computer modeling. It matters little whether your are modeling semiconductor physics, planetary motion, human intelligence, or the Earth's climate. Many of the same principles and limitations apply.
I believe a better solution for the modeling problem is to cease making it an all encompassing model as Dr. Schmidt argues in favor. He says the problem cannot be broken down to smaller scales - "it's the whole or its nothing". I could not disagree more. The hard work of proper modeling is to exactly break the problem down in to small increments that can be modeled on a small scale, proven to work, and the incorporated into a larger working model.
Scientists didn't succeed in semiconductor physics by first trying to model artificial intelligence using individual transistors. They began by modeling one transistor very well and understanding it thoroughly. Thus, assumptions and simplifications that were of necessity made moving forward through increasing complexity were made with a thorough understanding of the limitations.
Let me suggest then as an outsider that you exactly do what Dr. Schmidt says can't be done. Create a model of weather with proper boundary conditions on a small geographical scale.
It seems like a good place to start is a 100 km^2 slice. That would give similar scale up factors (7-8 orders of magnitude) to the largest semiconductor devices today. Create a basic model for weather patterns of this small square.
Hone that model. Make it work. Show that it does. Understand the order of effects so that you then have the opportunity to use any number of mathematical techniques to attach those models with their boundary conditions side by side with increasing complexity and growing area but necessarily greater simplification yet losing little accuracy.
That is exactly the way that successful complex models have been built in other fields. I think the current approach tries to short cut the process by trying to jump to the big problem of modeling over decades too soon. If you have links to those that might be attacking this small scale modeling project, I'd like to have that resource. It would interest me greatly.
- Wave goodbye to the stadium wave - global warming still caused by humans
robert way at 05:18 AM on 25 April, 2014Although the stadium wave is undoubtedly an incorrect hypothesis - I consider the counterintuitive result of the recent Mann et al (2014) study to require greater scrutiny. In particular this result does not
The issues with the method are related to the input parameters of the energy balance model he uses, the accuracy of the forced components used and finally the lack of any spatial figures. IF this method is appropriate then he should be showing a spatial amplitude map and it should have the same spatial pattern as would be expected based on theory behind the mechanisms. This is somewhat a glaring omission. I think he provides a compelling case that the detrended AMO is inappropriate but I think his solution is theoretically appropriate but in practice is not sufficiently justified based on the paper. I also did not like that he cited Booth and other aerosol forcing AMO studies without citing their rebuttals which were compelling. The argument that the AMO was positive during the 1990s and is negative currently is at odds with the spatial distribution of temperature changes over that period - particularly in the Labrador Sea. In this area the temperatures are warming faster than projected by GCMs and were faster during the mid-century and cooler during the 1970-1995 section. This temperature history for one of the main nodes of the "amo" is at odds with the history implied by Mann's version. I suspect many of the experts on the physical mechanisms behind the AMO will disagree strongly with his new reconstruction of this index.I think any "new definition" of an AMO needs to be supported by more than just time series analysis - there needs to be a physical understanding of the underlying mechanism. A point made in Climate Dynamics last year. Did they check to make sure these results made sense with respect to the underlying mechanism? Did they relate it to salinity and sea ice ? As a mode of NH temp variation it is possible there is some relation to this index - however the AMO which is traditionally referred to by authors was not cooling over the past 15 years.
- Global warming not slowing - it's speeding up
Micawber at 23:31 PM on 16 March, 2014This excellent post points to a fundamental shift in global warming from the trivial 7% in air to the majority 93% in oceans. Indeed is heat captured over 70% of earth’s surface that includes the 8.5% in shelf seas <200m where most impacts are found.
Climatologists deal in anomalies in 30-year records as James Wright pointed out. Moreover, they rely on records collected by others and never go to sea to collect verification ground truth data. Their data at the surface are not to ocean standards that require >3,000 times more accuracy to account for the higher heat capacity (specific heat seawater: air). Moreover, salinity in the ocean surface has never been routinely collected. Seawater density is critically important because fresh warm water floats over saltier cool water.
The Levitus et al (2012) data incorporates the unverified SST data from 1955-1995 that has only sparse coverage as they show in their paper. It has only complete surface temperature coverage over rough degree grid where surface data is averaged over the top 100m from 1995.
The conclusion, that Earth is warming faster than ever before, is very securely based on ocean data. The huge heat capacity smoothes out the great swings in heating and cooling observed on land and in air. Moreover, as James states the main factor is greenhouse gas heat imbalance at the top of the atmosphere.
However, the 93% in the oceans is trapped by the almost completely unstudied top 2m of the ocean as was pointed out in a recent discussion paper (http://www.ocean-sci-discuss.net/11/C54/2014/osd-11-C54-2014-supplement.pdf).
Using rare daily timeseries, the authors quantify ocean warming as currently more than 1ºC in twenty years. This is strong confirmation of dangerously accelerating global warming.
Moreover, it is based on real ground truth data un-modified by models or statistics. They go on to show the post-1986 accelerated temperature rise coincides with a rapid decline in solar radiation. I suppose these are two hockey sticks in opposite directions. This strongly suggests that greenhouse gas contribution to heat imbalance now outweighs not only volcanic variations but also variations in solar activity from the Maunder Minimum to the modern 20th Solar High.
It also suggests that it masks all the global ocean indices such as ENSO, PDO, and NAO that are known to depend on the 22y Hale Cycle and the more familiar 11.6y sunspot cycles. This suggests that predictions, based on atmospheric statistical assumptions, of changes of El Nino/La Nina are unlikely to be accurate. ENSO cycles in the 21st century have been far less predictable. The ocean warming due to greenhouse gases is a good physics-based reason for the observed changes.
It will be very difficult to change climate deniers opinions.
As Alistair Fraser pointed out on his website on Bad Science “Be very, very careful what you put into that head, because you will never, ever get it out.” Thomas Cardinal Wolsey, (1471-1530). (A. B. Fraser, (http://www.ems.psu.edu/~fraser/BadScience.html)
Fraser also pointed out that evaporation does not depend on relative humidity as assumed in many ocean models, but on sea surface temperature. In practice that means evaporation increases by 7% per degree rise in temperature (Precipitation rises by 2-3%). The presence of air is not relevant to vapour pressure that determines evaporation (http://fermi.jhuapl.edu/people/babin/vapor/index.html).
The Matthews and Matthews (2014) discussion confirms and quantifies James Wright’s alarming findings. They present the first measurement of evaporation free from precipitation. They show evaporation and heat sequestration is critically dependent on salinity. The north Pacific ocean heat is trapped in the top 2m and is twice that of the southern ocean with salinity >35.5‰ (the authors use parts per thousand as appropriate at the surface). Moreover, they show from long-timeseries data that North Atlantic/Arctic heating has been buffered by basal icemelt in three phases. The post-1986 accelerating temperature rise they suggest is due to decreasing amounts of floating ice.
Indeed, they suggest, on the basis of real ground truth data and basic physics, that the warming will continue as long as we have the top of the atmosphere heat imbalance. It is not enough to stop adding greenhouse gases. Climatologists assume that if you do that, the heat balance will eventually be restored by back radiation. However, there is no back radiation from 2m below the sea surface. They point out that hurricanes can draw cooling water from below if they linger long enough. It is the storm’s speed over the ground that determines whether it grows into Hurricane Force 5 (fast moving), or is downgraded to tropical storm (slow moving). That could account for the first hurricanes seen in UK this spring.
Pacific warm pools have seen sustained temperatures of 32ºF from more normal 28ºC. That implies an increase in evaporation and precipitation of almost 30% above long-term averages. This is the likely explanation for excess precipitation in 2011 over SE Asia, Australia and S America that lowered global sealevels by 3mm. It could also explain why container shipping companies in the western Pacific now use two Beaufort classes above Hurricane force 12 to describe Pacific Typhoons.
James, you have presented a fundamental shift in our understanding of global warming.
There needs to be a major shift in funding to focus on the top 2m of ocean.
Unfortunately, the manned weatherships and other monitoring programs were discontinued just before the rapid warming began. Manned weatherships would have been very useful for seeing first hand what is really happening. They could be quickly deployed to help aircraft or ships in distress. Even if the aircraft turned off its tracking devices, I suspect weatherships could track them.
Manned ocean programs have been savagely cut in the everywhere including UK, US and Canada.
We need to lobby to get funding restored to counter the devastating cuts shown in this video:
Silence of the Labs http://www.youtube.com/watch?v=Ms45N_mc50Y.
Congratulations! You have made a major contribution to science of importance to all mankind. SKS has a great record in countering false arguments and bad science. You now have the mother of all battles to fight. No one has argued that we must actually reduce greenhouse gases to former stable levels. But that is what is demanded if ocean warming and acidification is to managed and mitigated. - MP Graham Stringer and CNN Crossfire are wrong about the 97% consensus on human-caused global warming
Tom Curtis at 19:42 PM on 23 February, 2014tlitb1 @35, it is fairly obvious even to this non-author that:
1) The papers were "captured" by the search, not "captured" into a category. That is, the literature search can be viewed metaphorically as a net which 'caught' 12,280 papers, which were then sorted into their appropriate categories. Your misinterpretation is both typical of you, and from past experience, probably deliberate. Whether deliberate or not, it has no justification in the text of the article.
2) Even casual readers of the paper will have noted that the abstract raters rated the papers only on the abstract and title, all other information (including date and journal of publication, and authors names) being withheld. In constrast author self ratings were based not only on the full paper, but also on whatever memories they had of their intentions for the paper. As such, the two sorts of ratings do not, and cannot compounded into a conglomerate rating as you suggest. If the authors disagree with the abstract ratings, that may be simply because they are rating a different thing. It is presume that abstracts are related to the contents of papers, so that on average the pattern of ratings by authors represents a check on the accuracy of both the method of rating papers by abstract alone and on the accuracy of abstract raters. Differences in the rating of individual papers, whoever, can be the consequence of to many different factors to safely attribute them to any one factor (at least without a lot of additional information).
3) In constrast, a large difference between the author rating of the same paper by various authors can only be attributed to either misunderstanding the rating categories, or (hopefully less likely) misunderstanding their own paper by one or more of the authors. A difference of just one point in self rating, however, may simply be attributable to slighly different subjective judgements, which cannot be completely excluded. In the scenario you describe, at least two of the authors have misunderstood the rating categories.
4) In this case, Spencer makes an explicit claim about how he would be rated, a claim which is shown to be false by the actual facts. That is fairly clear evidence that he is misdescribing how the ratings should apply.
In fact it is very interesting to compare Spencer's reaction to that of Dr Nicola Scaffeta, who when asked a question about the rating of one of his papers had this to say:
Question: "Dr. Scafetta, your paper ‘Phenomenological solar contribution to the 1900–2000 global surface warming‘ is categorized by Cook et al. (2013) as; “Explicitly endorses and quantifies AGW as 50+%“
Is this an accurate representation of your paper?"
Scafetta: “Cook et al. (2013) is based on a strawman argument because it does not correctly define the IPCC AGW theory, which is NOT that human emissions have contributed 50%+ of the global warming since 1900 but that almost 90-100% of the observed global warming was induced by human emission.
What my papers say is that the IPCC view is erroneous because about 40-70% of the global warming observed from 1900 to 2000 was induced by the sun. This implies that the true climate sensitivity to CO2 doubling is likely around 1.5 C or less, and that the 21st century projections must be reduced by at least a factor of 2 or more. Of that the sun contributed (more or less) as much as the anthropogenic forcings.
The “less” claim is based on alternative solar models (e.g. ACRIM instead of PMOD) and also on the observation that part of the observed global warming might be due to urban heat island effect, and not to CO2.
By using the 50% borderline a lot of so-called “skeptical works” including some of mine are included in their 97%.”
First, Scaffeta grotesquely misrepresents the IPCC position, which is that greater than 50% of warming since 1950 has been anthropogenic.
Second, the abstract of his paper reads as follows:
"We study the role of solar forcing on global surface temperature during four periods of the industrial era (1900–2000, 1900–1950, 1950–2000 and 1980–2000) by using a sun-climate coupling model based on four scale-dependent empirical climate sensitive parameters to solar variations. We use two alternative total solar irradiance satellite composites, ACRIM and PMOD, and a total solar irradiance proxy reconstruction. We estimate that the sun contributed as much as 45–50% of the 1900–2000 global warming, and 25–35% of the 1980–2000 global warming. These results, while confirming that anthropogenic-added climate forcing might have progressively played a dominant role in climate change during the last century, also suggest that the solar impact on climate change during the same period is significantly stronger than what some theoretical models have predicted."
(My emphasis)
The phrasing, "as much as" indicates that the upper limit is being specified. With solar activity specified as only contributing "as much as" 25-30% of warming since 1980, the rating of the abstract was eminently justified.
What is interesting, however, is the stark contrast between Scaffeta's misinterpretation of the rating, and that by Spencer. Interestingly, all early commentary on the paper by AGW "skeptics" followed Scaffeta's line (if not quite so extremely). Then a new, and contradictory talking point developed, ie, that used by Spencer. Some at least Anthony Watts have happily presented both views.
I suspect it is fortunate for a number of AGW "skeptics" who self rated that their self ratings are confidential (unless they choose to release them), for I suspect quite a few of them will have rated them as rejecting the concensus, and are now publicly declaring that they ratings must be interpreted such that they are part of the 97%. As I have not seen the data, that is, of course, just a guess.
- How we know the greenhouse effect isn't saturated
Tom Curtis at 12:03 PM on 23 February, 2014HK @85, first a word of caution. Clive Best is an AGW 'skeptic', and while he is more mathematically sophisticated than most AGW 'skeptics', he still breathlessly writes about the lack of warming over the last twelve years, and predicts cooling temperatures for the next decade because the lower uncertainty bound of the HadCM2 model short term climate forecast permits it. Any recommendation of one blog post by Clive Best should not be construed as a recommendation of any other blog post by Best, or the quality of his blog in general.
More importantly, Clive Best's attempt to calculate the effective altitude of radiation clearly fails on empirical grounds. Specifically, this is his calculated "effective altitude of radiation":

Clearly he shows the effective altitude of radiation on either sides of the spikes at 620 and 720 cm-1 as being between zero and 1000 meters. In contrast, as can be seen in the real spectrum he shows, at those wave numbers, the effective altitude of radiation is closer to 6000 meters {calculated as (ground temperature - brightness temperature)/lapse rate}:

As can be seen from his graph of the predicted IR spectra, he clearly gets the 660 cm-1 spike wrong as well, showing it as a dip (?!) for 300 ppmv, and as a barely discernable spike at 600 ppmv. That is so different from the obvious spike in the real world spectrum (at approx 390 ppmv) that you know (and he should have known) that he has got something significantly wrong.
Before addressing that specifically, I will note two minor things he omitted (perhaps for simplicity). The first is that he has not included a number of factors that broaden the absorption lines. Broadening increases the width of the lines, but also reduces the peak absorbance of the lines. In any event, he has not included doppler broadening, possibly does not include collissional broadening, and probably does not include some of the other minor forms of broadening.
The second factor is that he has not allowed for the difference in atmospheric profiles between the US Standard atmosphere and actual tropical conditions. Specifically, the atmosphere is thicker at the equator due to centrifugal "force", and also has a higher tropopause due to the greater strength of convective circulation. That later should reduce CO2 density, and might be accepted as the cause of the discrepancy except that mid latitude and even polar spectra show the same reduce absorbance relative to his calculated values (and hence higher effective altitude of radiation in the wings, and for the central spike).
Although these factors are sources of inaccuracy, they do not account for the major error in calculation. That is probably a product of his definition of effective altitude of radiation, which he defines as the highest altitude at which "... the absorption of photons of that wave length within a 100m thick slice of the atmosphere becomes greater than the transmission of photons". That is, it is the altitude of the highest layer at which less than half of the upward IR flux at the top of that altitude comes from that layer.
This definition is superficially similar to another common definition, ie, the lowest altitude from which at least half of the photons emitted upward from that altitude reach space. Importantly, however, this later definition is determined by the integrated absorption of all layers above the defined layer. Specifically, it is the layer such that the integrated absorption of all layers above it = 0.5. I think the layer picked out by Best's method is consistently biased low relative to that picked out by this later definition.
There are two other common definitions of the effective layer of radiation around. The most common is:
"Here the effective emission level is defined as the level at which the climatological annual mean tropospheric temperature is equal to the emission temperature: (OLR/σ)1/4, where σ is the Stefan–Boltzmann constant."
(Source, h/t to Science of Doom)
That definition can be generalized to specific wave numbers, or spectral lines, and is used by Best in an earlier blog post specifically on the subject. It also needs to be modified slightly to allow for the central spike (which comes from the stratosphere). The difficulty of such a modification, plus a certain circularity in this definition makes others preferable. The third definition is the one I give above of "the temperature weighted mean altitude from which the radiation comes". I take it that the three common definitions pick out the same altitude, at least to a first order approximation. In contrast, Best's definition in the blog post to which you refer is of by (in some portions of the spectrum) at least 6 kms.
Despite this flaw, Best's blog post does give a good idea of the methods used in radiative models. However, his detailed results are inaccurate, in a way that does not reflect the inaccuracy of the radiative models used by scientists. This also applies to the graph shown by scaddenp @55 above, which was also created by Best. It is very indicative of the type of profiles likely to be seen, but should not be considered an accurate source. I discuss the accuracy of actual models briefly here, and in more detail in the comments.
- Climate and economic models – birds of a different feather
Old Mole at 04:25 AM on 29 December, 2013"Another limit to the accuracy of climate models deals with processes that do not obey basic laws of the universe (conservation of mass, momentum, and energy)."
Perhaps this might be more elegantly phrased. I sincerely doubt that even in the most chaotic systems, matter, energy and momentum are getting created or destroyed, even if it seems that way in the macro perspective of a climate model.
This article does raise a question in my mind, though ... if most models are being run on (very expensive) supercomputers 24/7 based on one small grid square at a time, it seems to me that this would be an ideal candidate for massively parallel distributed computing, if you could find programmers clever enough to write the software for it. I for one would be willing to volunteer the use of any spare cycles in a good cause, and I think most of the denizens of SkS feel the same way.
Best wishes,
Mole
- How do meteorologists fit into the 97% global warming consensus?
One Planet Only Forever at 00:44 AM on 4 December, 2013MartinG, I consider the link between long term global climate modeling and near term regional weather forecasting as a continuum of forecasting that is modeled using different start point information with varying levels of accuracy depending on what is trying to be forecast.
On the nearest end of the continuum is the attempt to forecast things like what weather events will occur at an exact location and when they can be expected at a specific location. Such forecasts are based on observations of nearby existing weather patterns and climate features (like highs and lows) projected forward a short time. They do not consider the total global system, only the aspects that will have a near term affect of on a specific location. In regions near surface disruptions like mountains the forecasts are very unreliable. In some cases significant storm systems have formed in Calgary, Alberta (a place in the foothills of the mountains I am familiar with) without any real forecast that they would form, other than seeing the clouds rapidly build.
The global climate forecasting is based on global scale modeling. As others have commented it uses understanding of influences on the global system that are irrelevant in regional near term forecasting. It actually is the more reliable modeling. It is only 'surprised' by random impacts like dust from volcanic eruptions and El Nino/La Nina events which have short term affects on the global trend (affects that average out over a long term evaluation).
A similar averaging out of local weather is possible, but the resulting information is less meaningful for people wanting to know what next week's weather will be like. A similar uncertainty exists with what any specific regions future weather will be like decades into the future.
The real challenging forecasting is the prediction of weather in an upcoming growing season in any specific region. These forecasts are important to allow farmers to chose the most appropriate crop and actions for the anticipated weather during the season. This regional forecast being wrong ca lead to significant losses of crop production.
Probably the biggest concern about the accelerated change of global climate due to the influence of rapidly increased CO2 emissions accumulating in the environment is the increased uncertainty of the results. What is certain is that climate change will occur more rapidly as the global warming occurs more rapidly. The exact changes in weather in any specific location become more uncertain. That can make predicting the upcoming growing conditions even less reliable.
So, one of the biggest concerns about human impacts accelerating the rate of global warming is the increased uncertainty of important to know things like local growing conditions for the coming season, or the severity of extreme weather events in any given location.
All that said, getting energy from burning fossil fuels cannot be continued for the billions of years that humanity should be looking forward to enjoying on this amazing planet. It is a damaging dead-end activity that really needs to be stopped sooner than those who enjoy benefiting from it are willing to give up benefiting from it.
- How do meteorologists fit into the 97% global warming consensus?
chriskoz at 21:11 PM on 3 December, 2013MartinG@9,
In fact GCM are exactly the same in climate science and meteo, AFA algorithms and results are concerned. The only difference is that air and heat transfer between cells are the average/prevailing signals and simulated in longer timesteps while weather predictions try to simulate momentous air/heat transfer based on latest observations within shorter timescale. Both use the same technique of parametrisation/randomisation of unknown or too complex to describe physical phenomenons. So no surprise climate science and meteo going head to head in their modeling accuracy here.
What differs those two are the long-term forcing: e.g. radiative balance changes due to carbon cycle disruption and geo feedback. Those forcings are obviously irrelevant on weather forecasting timescale, therefore a good weatherman can be totally ignorant of those forcings and still be doing a good job in his field. As we know, understanding of such forcings (that are the professional domain of climate scientists only) is essential to appreciate AGW. That explains why the incidence of AGW ignorance/denial is higher among weathermen rather than among climate scientists.
- Clouds provide negative feedback
Licorj at 04:48 AM on 23 November, 2013Dear KR,
First, thank you by attention, even after long time past from publication of this post. I just have realized it, after my post was sent.
I have read the post, and a lot of very interesting comments. "Clouds are estimated be small positive feedback". Ok. Estimated to be, but could be estimated to not to be... It is a game.
Excuse me by error on "INFINITE WARMING". It is clear that is not possible, otherwise, we would have free energy generation.
Backing to the clouds: I believe, of course, with less scientific based knowledge than you, that the choice on small positive feedback for cloud, taken by climate scientists was just a choice, with high level of uncertainty. So high, that choice would be NEUTRAL, or small negative feedback. In order to get the true cloud feedback, it would be need a lot of measures taken around the world, on entire troposphere, entire world, during long time. Of course it is very expensive and hard to do, maybe impossible.
Even assuming my mistake on INIFINITE WARMING, I still believe that oceans would be expected to dry, because of positive feedback, in any level.
Other expected result from feedbacks for, aerossols, cloud, water vapor, CO2, CH4, etc, would be the accuracy of models on recreating paste climates. They are all wrong, on this task. Somethings are very wron with them, and nedd to be fixed, before can tell us how will be the climate after 100 years from present day.
Why we see tomorrow's weather forecasts, and believe on it ?
Because they are correct on vaste majority of times. It is not the same case for climate models, at least, untill now.
But, this is off-topic.
More than 100 comments found. Only the most recent 100 have been displayed.
More than 100 comments found. Only the most recent 100 have been displayed.


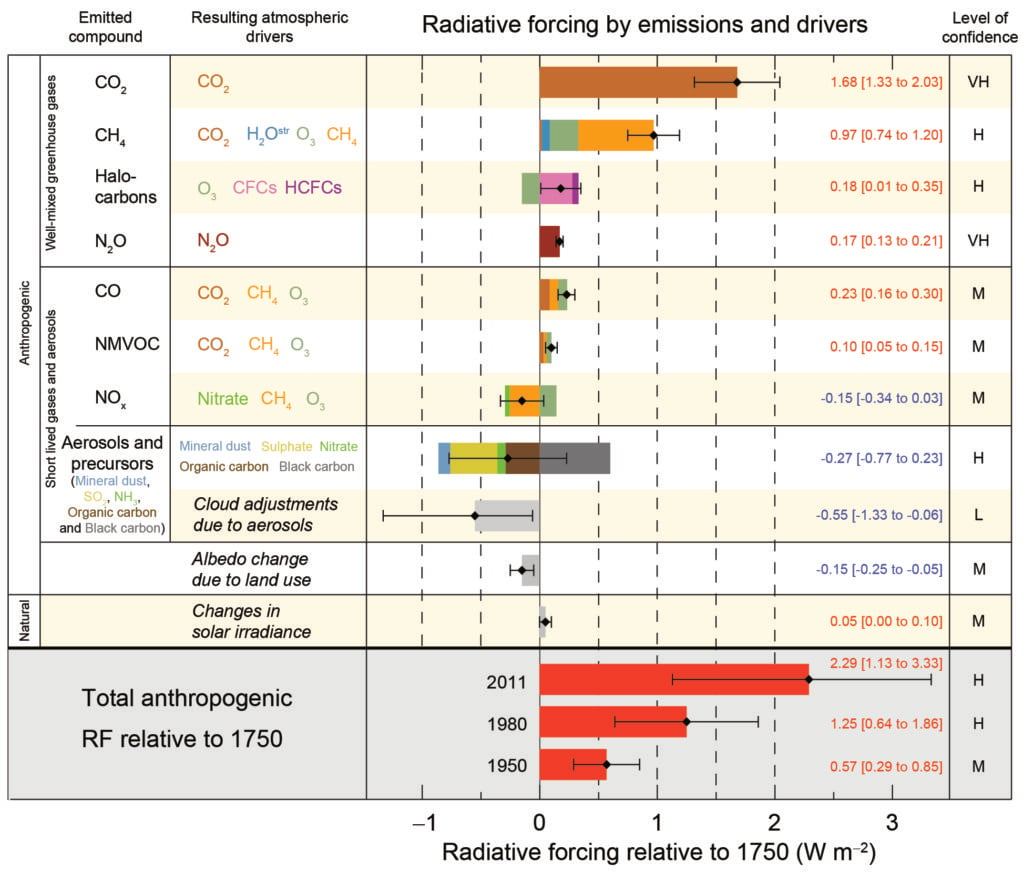
THE ESCALATOR

(free to republish)