


 Arguments


The Critical Decade - Part 1: The Science
Posted on 28 May 2011 by dana1981
The Australian government established a Climate Commission which recently released a three chapter report entitled The Critical Decade. The first chapter of the report, which we will examine in this post, summarizes the current state of climate science observational data. But first, a statement in the introduction is worth quoting:
"Over the past two or three years, the science of climate change has become a more widely contested issue in the public and political spheres. Climate science is now being debated outside of the normal discussion and debate that occurs within the peer-reviewed scientific literature in the normal course of research. It is being attacked in the media by many with no credentials in the field. The questioning of the Intergovernmental Panel on Climate Change (IPCC), the “climategate” incident based on hacked emails in the UK, and attempts to intimidate climate scientists have added to the confusion in the public about the veracity of climate science."
We at Skeptical Science have documented many such attacks on climate science by individuals with no climate credentials, who misrepresent scientific research, and attempt to sow doubt in the minds of the general public through non-scientific issues like Climategate. But while these introductory comments are worth highlighting, let's move on to the scientific content.
The report is based on the IPCC Fourth Assessment Report (2007) as well as several other more recent studies. Skeptical Science readers will already be familiar with much of the information in the first chapter, but it nevertheless provides a useful summary of recent climate research. The main conclusions of Chapter 1 are as follows:
- The average air temperature at the Earth’s surface continues on an upward trajectory at a rate of 0.17°C per decade over the past three decades.
- The temperature of the upper 700 meters of the ocean continues to increase, with most of the excess heat generated by the growing energy imbalance at the Earth’s surface stored in this compartment of the system.
- The alkalinity of the ocean is decreasing steadily as a result of acidification by anthropogenic CO2 emissions.
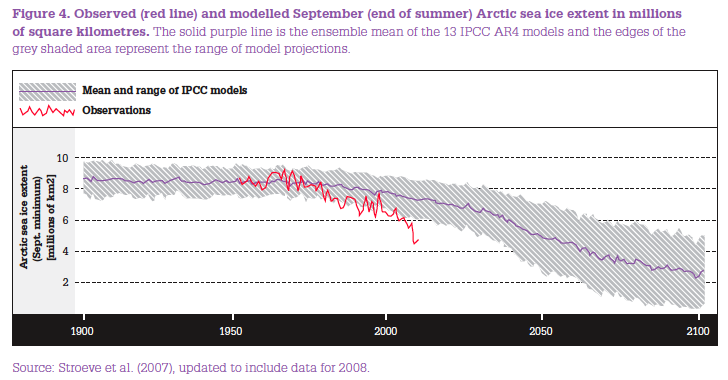
- Recent observations confirm net loss of ice from the Greenland and West Antarctic ice sheets; the extent of Arctic sea ice cover continues on a long-term downward trend. Most land-based glaciers and ice caps are in retreat.
- Sea-level has risen at a higher rate over the past two decades, consistent with ocean warming and an increasing contribution from the large polar ice sheets.
- The biosphere is responding in a consistent way to a warming Earth, with observed changes in gene pools, species ranges, timing of biological patterns and ecosystem dynamics.
The report notes that the past decade (2001-2010) was the hottest on record, 0.46°C above the 1961-1990 average. It also contains many illuminating figures, including this one showing that Arctic sea ice is declining far faster than IPCC models projected, currently approximately 40 years ahead of schedule.
The report also discusses that sea level rise is progressing at the very high end of the IPCC estimates, despite the efforts of certain "skeptics" to downplay the sea level rise acceleration based on one exceptionally flawed paper.
Chapter 1 proceeds to discuss the various signals of a changing Australian climate in the biosphere, including mammalian migrations to higher elevations, earlier arrival and later departure times of migratory birds, and the increase in bleaching events on the Great Barrier Reef (GBR). There have been eight mass bleaching events on the GBR since 1979 with no known such events prior to that date. The report goes on to discuss the potential causes of the observed climate change:
- There is no credible evidence that changes in incoming solar radiation can be the cause of the current warming trend.
- Neither multi-decadal or century-scale patterns of natural variability, such as the Medieval Warm Period, nor shorter term patterns of variability, such as ENSO (El Niño-Southern Oscillation) or the North Atlantic Oscillation, can explain the globally coherent warming trend observed since the middle of the 20th century.
- There is a very large body of internally consistent observations, experiments, analyses, and physical theory that points to the increasing atmospheric concentration of greenhouse gases, with carbon dioxide (CO2) the most important, as the ultimate cause for the observed warming.
- Improved understanding of the sensitivity of the climate system to the increasing atmospheric CO2 concentration has provided further evidence of its role in the current warming trend, and provided more confidence in projections of the level of future warming.
Again, this is not news to Skeptical Science readers, nor are the anthropogenic warming fingerprints the report discusses. The ensuing discussion of climate sensitivity is fairly interesting, and harkens back to our examination of the cloud feedback:
"An analysis of the transition of the Earth from the last ice age to the Holocene, which infers climate sensitivity from the observed change in temperature and the corresponding changes in the factors that influence radiative forcing, also estimates a value of about 3°C (Hansen et al. 2008). Much of the uncertainty on the magnitude of climate sensitivity is associated with the direction and strength of cloud feedbacks. Recent observational evidence from short-term variations in clouds suggests that short-term cloud feedbacks are positive, reinforcing the warming, consistent with the current model-based estimates of cloud feedbacks (Clement et al. 2009; Dessler 2010).
A recent model study comparing the relative importance of various greenhouse gases for the climate estimates a sensitivity of approximately 4°C for a doubling of CO2 (Lacis et al. 2010). In addition, the study points to the importance of CO2 as the principal “control knob” governing Earth’s surface temperature."
It's worth noting that while Hansen et al. find paleoclimate evidence for a short-term climate sensitivity of 3°C for doubled atmospheric CO2, they also find that when including slow-acting feedbacks, the long-term sensitivity is closer to 6°C. Next up is a discussion of how the carbon cycle is changing:
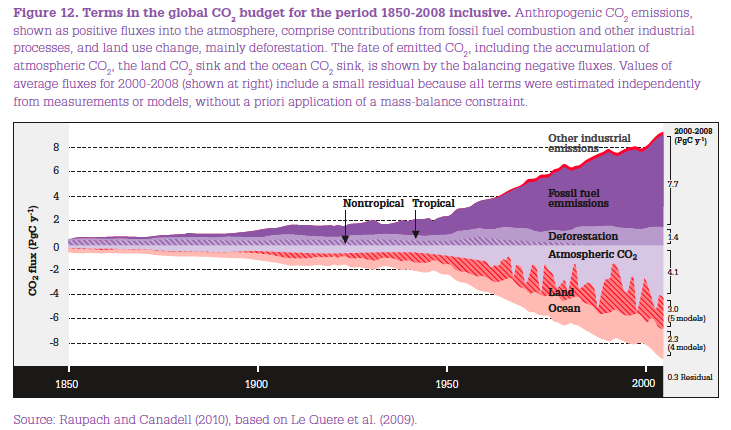
- Despite the dip in human emissions of greenhouse gases in 2009 due to the Global Financial Crisis, emissions continue on a strong upward trend, on average tracking near the top of the family of IPCC emission scenarios.
- Ocean and land carbon sinks, which together take up more than half of the human emissions of CO2, appear to be holding their proportional strengths compared to emissions, although some recent evidence questions this conclusion and suggests a loss of efficiency in these natural sinks over the past 60 years.
- If global average temperature rises significantly above 2°C (relative to pre-industrial), there is an increasing risk of large emissions from the terrestrial biosphere, the most likely source being methane stored in permafrost in the northern high latitudes.
There is evidence that the efficiency of natural carbon sinks is declining, particularly in the Southern Ocean, but this possibility remains highly uncertain and controversial. Thus far natural carbon sinks have kept pace with us, absorbing approximately 57% of human emissions since 1958, but there is of course a limit to their storage capacity.
As the planet continues to warm, approaching the 2°C danger limit, not only is there an increasing risk that these natural carbon sinks will become saturated, but potentially significant releases from other carbon sources (methane beneath permafrost, methane hydrates stored under the sea floor, organic material stored in tropical peat bogs, etc.) becomes increasingly likely.
The final section in Chapter 1 discusses the certainty of our knowledge of climate change:
- The IPCC’s Fourth Assessment Report has been intensively and exhaustively scrutinised and is virtually error-free.
- The Earth is warming on a multi-decadal to century timescale, and at a very fast rate by geological standards. There is no doubt about this statement.
- Human emissions of greenhouse gases – and CO2 is the most important of these gases – is the primary factor triggering observed climate change since at least the mid 20th century. The IPCC AR4 (2007a) report attached 90% certainty to that statement; research over the past few years has strengthened our confidence in this statement even more.
- Many uncertainties surround projections of the particular risks that climate change poses for human societies and natural and managed ecosystems, especially at smaller spatial scales. However, our current level of understanding provides some useful insights: (i) some social, economic and environmental impacts are already observable from the current level of climate change; (ii) the number and magnitude of climate risks will rise as the climate warms further.
The report notes that some significant uncertainties remain, such as the exact responses of the Greenland and Antarctic ice sheets, and the hydrological cycle, to the continuing warming of the planet. But the report also hammers home a key point that we wish "skeptics" would take to heart:
"These uncertainties, however, in no way diminish our confidence in the observation that the Earth is warming and in our assessment that human emissions of greenhouse gases are the primary reason for this warming."
"Despite these seemingly daunting uncertainties, a number of social, economic and environmental impacts can be observed that are consistent with what is anticipated from the current level of climate change. The number and magnitude of climate-related risks will rise considerably as the climate warms towards 2°C above the preindustrial level; and above the 2°C guardrail, the risks may rise dramatically"
In short, despite the uncertainties, the scientific evidence is clear on the main points that humans are causing dangerous global warming. It's also important to note that uncertainties can go either way, and the consequences of climate change are just as likely to be more damaging than we expect as less. Uncertainty is not our friend.
In Parts 2 and 3 we will examine the report's chapters on risks associated with climate change and implications of the science for emissions reductions.


[dana1981] That's my commentary (and it's true). Everything in quotes or bullets is from the report. Everything else is from me.
[dana1981] I don't have the time to respond to this entire Gish Gallop, but you're cherrypicking. The last 30 years includes the last 10 years.
[dana1981] Pulling 10 years out of the 30 year period being evaluated is pretty much the definition of a cherrypick.
[DB] Please take further discussion of this to the Antarctica Is Gaining Ice thread.
[DB] "Translated..it might not be as bad as 99% of the stories in the media portray.."
Further translated: It might be worse.
[DB] Certainly, one could imagine it. But that would be unnecessary, as the actual analysis has already been done:
Note the error bars do not include zero in either dataset until 2001; thus, the warming since 2000 is statististically significant.
And remember that the Aughts (the decade 2001-2010) were the warmest in the instrumental record, with 2010 being tied for the warmest year on record. So, one can safely say that GW is carrying on its busy, obeying-the-laws-of-physics way, blissfully ignorant to the dissembling of those who would have us debate the existence of gravity.
[dana1981] This is seriously off-topic, but China is preparing to implement a carbon cap and trade system, Europe already has one in place, and the US EPA is regulating carbon emissions from large sources (and eventually we'll have a cap and trade system too, once Republicans stop blocking it). Anyway, your argument is Tragedy of the Commons - please take further discussion of the subject to that thread.
[DB] Currently the obfuscationists deny that it is warming at all AND that what warming is occurring is natural and less-than-linear in rate. Tamino debunks that last point here and here.
As far as the warming in the pipeline, consider this and this. The thermal inertia of the oceans, coupled with the albedo changes due to the loss of the Northern Hemisphere's refridgeration system (the ongoing loss of summer sea ice in the Arctic Ocean) and increasing outgassing of GHG's from melting permafrost & clathrates mean that our descendants will have a rough go of things. Especially if we continue to refuse to do anything about it now, while our actions can still make a difference.
Time remains to have a say in our descendants future, should we demonstrate the collective will to do so. Or not.
Our history we write daily will testify about us rather starkly.