


 Arguments


2017 SkS Weekly Climate Change & Global Warming Digest #5
Posted on 5 February 2017 by John Hartz
Story of the Week... Toon of the Week... Quote of the Week... Graphic of the Week... Photo of the Week... SkS Spotlights... Video of the Week... Coming Soon on SkS... Poster of the Week... SkS Week in Review... 97 Hours of Consensus...
Story of the Week...
AMICUS GROUPS FILE BRIEF TO PROTECT CLIMATE SCIENTISTS
New York, N.Y. — The Climate Science Legal Defense Fund (CSLDF) has asked the District of Columbia federal District Court to safeguard roughly 8,000 pages of privileged correspondence between nine climate scientists.
![]()
Under the federal Freedom of Information Act (FOIA), Judicial Watch, a conservative group, has sued for emails of scientists employed by the National Oceanic and Atmospheric Administration (NOAA), who authored a June 2015 study published in Science.
The study, which has since been replicated by other researchers, found that global temperatures are increasing faster than previously thought. The paper addresses and refutes prior claims about a so-called slowdown in global warming since the late 1990s.
Judicial Watch’s lawsuit is not the first attempt to obtain these researchers’ emails. In October 2015, Rep. Lamar Smith (R-Texas), who disputes the scientific consensus on climate change, tried to use congressional subpoena powers to obtain the NOAA emails. At that time, NOAA released hundreds of pages of documents to Rep. Smith, but steadfastly refused to produce the scientists’ email correspondence.
CSLDF filed the new brief on Friday, January 27 in partnership with the American Meteorological Society (AMS) and the Union of Concerned Scientists (UCS). The brief urges the court to protect scientific correspondence and preliminary drafts of publications from indiscriminate disclosure.
“Now more than ever, it is critical that we defend climate scientists and their research,” Lauren Kurtz, Executive Director of CSLDF, said. “Forcing the disclosure of scientists’ private emails is invasive, unnecessary, and hugely detrimental to the scientific method.”
Organizations across the political spectrum increasingly use public records laws to attack research findings and fields of study they dislike. As in this case, the records requests typically do not seek the data, methodology, or funding sources of completed studies. The requests instead seek privileged prepublication materials, such as preliminary drafts, private critiques from other scientists, and researchers’ personal documents and correspondence.
These types of records are generally protected from disclosure by the deliberative process privilege — as courts have repeatedly recognized in cases similar to this one. Government scientists’ correspondence, preliminary drafts, and peer review materials are quintessential deliberative, pre-decisional records safeguarded by Exemption 5 of the FOIA, 5 U.S.C. § 552(b)(5).
“Providing free and open access to all data and methodologies used to conduct scientific research is central to science and to scientific advancement,” Keith Seitter, Executive Director of AMS, said. “However, internal communications leading up to publication in the peer-reviewed literature should remain confidential so scientists can feel free to debate and resolve issues candidly without fear of their remarks being taken out of context.”
The brief explains that releasing privileged prepublication materials — generally treated as confidential within the scientific community — could significantly damage government scientists’ ability and willingness to conduct research into vitally important but politically charged subjects like climate change.
“Scientists, whether in government or academia, need to freely exchange and discuss ideas without constantly looking over their shoulders or worrying about legal action,” said Andrew Rosenberg, Director of the Center for Science and Democracy at the UCS.
###
About CSLDF: The Climate Science Legal Defense Fund was founded in 2011 in response to the increasing incidence of legal attacks against climate scientists. Its mission is to protect the scientific endeavor in general — and climate science and climate scientists in particular — from assaults being launched through the legal system, including intrusive public records requests.
About AMS: American Meteorological Society was founded in 1919 and is dedicated to advancing the atmospheric and related sciences for the benefit of society. AMS is committed to strengthening scientific work across the public, private, and academic sectors, and believes that collaboration and information sharing are critical to ensuring that society benefits from the best, most current scientific knowledge and understanding available.
About UCS: Union of Concerned Scientists was founded in 1969 and combines independent scientific research and citizen action to develop innovative and practical solutions to pressing environmental and security problems. UCS believes that a crucial ingredient in achieving these goals is maintaining research institutions within the federal government that foster an environment of independent and rigorous scientific inquiry free from political interference.
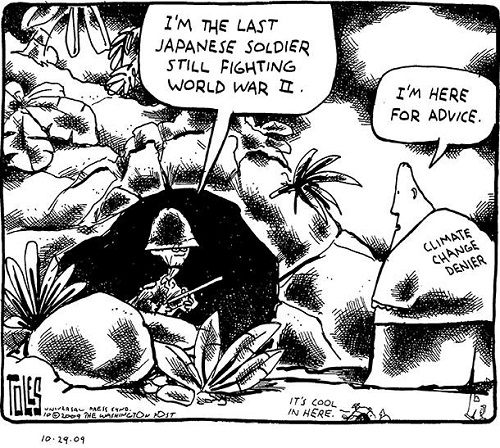
Toon of the Week...
Quote of the Week...
Donald Trump's phone call with Prime Minister Malcolm Turnbull made front pages and news bulletins around Australia and the US, but it led news bulletins in Germany, too, where leading European climatologist Stefan Rahmstorf is based.
"We are all very worried here," Rahmstorf, a professor at the Potsdam Institute for Climate Impact Research, says. "We should assume our worst fears will be realised."
'We should assume our worst fears will be realised': climate scientist on Donald Trump by Peter Hannam, Sydney Morning Herald, Feb 5, 2017
Graphic of the Week...
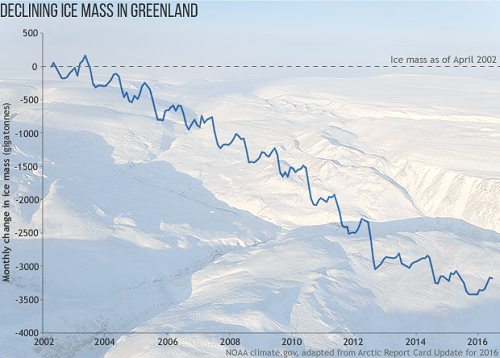
Greenland ice mass loss continued in 2016 by Michon Scott, NOAA's Climate.gov, Dec 28, 2016
Photo of the Week
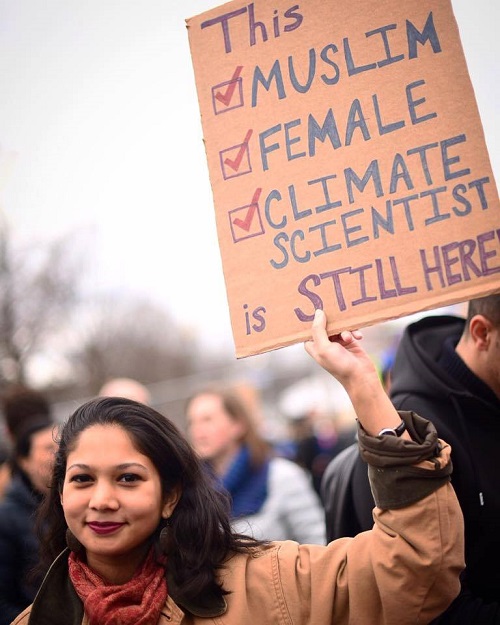
Spotted outside the White House last week. We're still here too. And we'll keep standing with you against Trump's destructive agenda.
Friends of the Earth U.S. Facebook page.
SkS Spotlights...
The Environmental Data and Governance Initiative (EDGI) is an international network of academics and non-profits addressing potential threats to federal environmental and energy policy, and to the scientific research infrastructure built to investigate, inform, and enforce. Dismantling this infrastructure — which ranges from databases to satellites to models for climate, air, and water — could imperil the public’s right to know, the United States’ standing as a scientific leader, corporate accountability, and environmental protection.
In response, EDGI is building online tools, events, and research networks to proactively archive public environmental data and ensure its continued publicly availability. We also are monitoring changes to federal regulation, enforcement, research, funding, websites and general agency management at agencies including EPA, DoE, NASA, NOAA, and OSHA. We aim to serve the environmental community and its allies, and to enable them to hold the new administration accountable, by preserving and improving public access to at-risk government environmental data, documents, and digital interfaces, and by monitoring, documenting, and analyzing change to federal environmental agencies. We also aim to create an open, collaborative network of individuals, non-profits, universities and companies who believe that science and data are vital for environmental governance.
Video of the Week...
Coming Soon on SkS...
- Repeal without replace: a dangerous GOP strategy on Obamacare and climate (Dana)
- Three quarters of Trump voters deny climate science, but that's not a lot of people (Dana)
- Correcting Warren Meyer on Forbes (Rob Honeycutt)
- Guest Post (John Abraham)
- Why claiming that climate scientists are in it for the money is absurd (Baerbel)
- 2017 SkS Weekly Climate Change & Global Warming News Roundup #6 (John Hartz)
- 2017 SkS Weekly Climate Change & Global Waming Digest #6 (John Hartz)
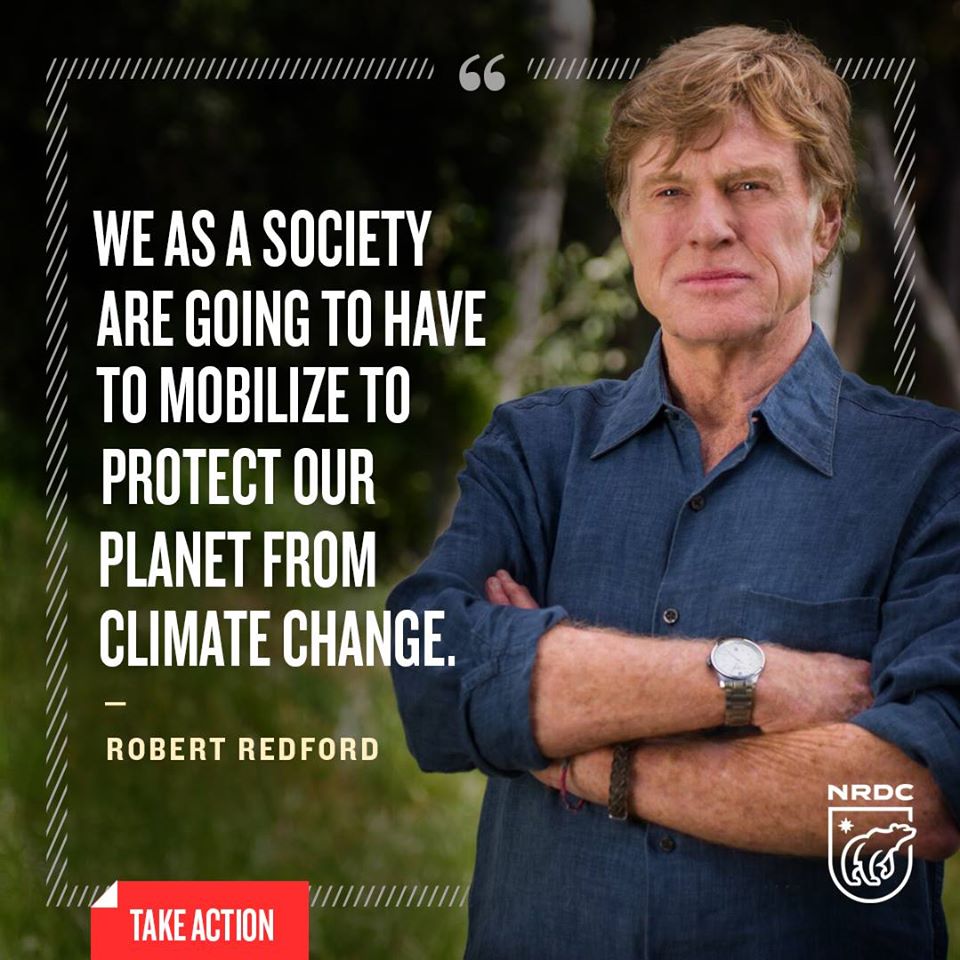
Poster of the Week...
SkS Week in Review...
- 2017 SkS Weekly Climate Change & Global Warming News Roundup #5 by John Hartz
- A Message to Trump from Climate Scientists by CollinMaessen
- A punchy climate book from a citizen scientist by John Abraham (Climate Consensus - the 97%, Guardian)
- Global warming hiatus claims prebunked in 1980s and 1990s by Ari Jokimäki
- Trump is copying the Bush censorship playbook. Scientists aren't standing for it by Dana Nuccitelli (Climate Consensus - the 97%, Guardian)
- Fact Check: Trump's Cabinet Picks on Human-Caused Global Warming by Dana Nuccitelli (Climate Consensus - the 97%, Guardian)
- 2017 SkS Weekly Climate Change & Global Warming Digest #4 by John Hartz
97 Hours of Consensus...
Quote derived with permission from author from:
"Further emissions of greenhouse gases will cause further global warming. The Arctic will warm most rapidly and the land will warm more than the ocean. There will be more hotter and fewer cold days. Mid-latitude areas that currently experience high rainfall will get more. Sea levels will continue to rise and snow and ice will melt back. If we follow the highest scenario of future greenhouse gases, the Arctic is expected to be ice-free before the middle of the 21st century. “Avoiding 2 degrees of warming since preindustrial times will be very tough. We have already ‘spent’ more than two thirds of the CO2 emissions that we can afford to spend."


I am searching for responses to this article, just shared with me by a climate-change denying relative. Can you help? https://realclimatescience.com/2017/02/nasa-noaa-climate-data-is-fake-data/
Mamaafrica: Check out:
Mail on Sunday launches the first salvo in the latest war against climate scientists by John Abraham, Climate Consensus - the 97%, Guardian, Feb 5, 2017
Mamaafrica @1
The article you reference claims NOAA has "almost no temperature data for Africa, and none for Central Africa".
However this is false. A quick check using google shows plenty of data is available for Africa as below. Data for Zambia is minimal but it does have some weather stations as below.
tahmo.org/african-climate-data/
The article in your link has a map of global land surface temperatures that in central Africa that are slightly cooler than average. This is entirely correct.
The article also has a map of combined land / ocean temperatures that shows central africa around Zambia as warmer than average. The article in your link claims this map is false, but it is also correct, but confusing to grasp. This map is a "blended" map that averages all temperatures over land and oceans regardless of geography, so is technically correct. The map in your article neglected to mention it was blended (probably deliberately). The annotation is in fact there in the original map by Noaa as below:
www.ncdc.noaa.gov/sotc/
The NASA data don't blend or merge data like this, and so their map is a bit different and equally valid. It just depends how you are presenting data. I just take a general lay persons interest in climate change, and don't claim any expertise, but I can work this stuff out easily enough. The thing is, always check the original data and source material and the fine print. Denialist websites tend to be very missleading.
data.giss.nasa.gov/gistemp/maps/
In other news:
https://www.yahoo.com/news/macron-offers-refuge-france-u-scientists-entrepreneurs-181048938.html
Parlez vous anglais?
villabolo@4
We hear more and more around the world that current climate for science in US resembles Lysenko's times in USSR:
Donald Trump reminiscent of Stalin
Alan Finkel did not say Australia would accept persecuted american scientists but I guess he does not even need to say that: they will start migrating en mass. Like I did in early 2000s (I migrated from Seattle to Sydney), certainly for different reasons at that time. But the move itself is very easy and requires only minimal (or not at all) language and culture adjustment, as I can say from my experience. I would never imagine back 13y ago when I was moving, that I would have left behind such madness. Let's hope that Americans come to terms and impeach the raving manman quickly before the situation worsens and consequences spill to the rest of the world.
For a start, the study has not been replicated by other researchers, how can it be when the original source code has been “lost” and NOAA now say the computer it was on failed and everything has been lost and it is impossible to replicate the original and the code was not backed up. How convenient!
NOAA has now decided to replace the sea temperature dataset just 18 months after it was issued, because it used “unreliable methods which overstated the speed of warming”.
The Karl dataset used upwards adjustments of readings from fixed and floating buoys to agree with water temperature measured by temperature affected ships manifolds. What blatant corruption.
US senate attempts to get all the relevant data on the how the dataset was created were arrogantly ignored by NOAA, knowing that the obama administration would protect them. But that is no longer the case and the coming months should be interesting as full details emerge of NOAA’s corruption.
[JH] You have made many assertions in your post without any documentation of their sources. Your assertions therefore constitute sloaganeeing which is prohibited by the SkS Comments Policy.
Please note that posting comments here at SkS is a privilege, not a right. This privilege can be rescinded if the posting individual treats adherence to the Comments Policy as optional, rather than the mandatory condition of participating in this online forum.
Please take the time to review the policy and ensure future comments are in full compliance with it. Thanks for your understanding and compliance in this matter.
"The Climate Science Legal Defense Fund (CSLDF) has asked the District of Columbia federal District Court to safeguard roughly 8,000 pages of privileged correspondence between nine climate scientists"
So what have they got to hide? I worked for a large multinational corporation for over 20 years in a technical capacity and would not have the slightest problem if all the emails I ever wrote were made public. I had nothing to hide or be ashamed of.
Bruce @6
I think you are wrong about all of that. The whole thing is a beat up. I suggest you read the following article by Carbon Brief by a climate researcher from Berkely Earth. They have certainly replicated the NOAA temperature adjustments. You don't need NOAAs source code on their methods, just the raw temperature data.
www.carbonbrief.org/factcheck-mail-sundays-astonishing-evidence-global-temperature-rise
Bruce @7, I work in a high level technical capacity and hugely value my privacy. I think privacy should be a basic human right, and nosey authorities only have a right to intrude if they have compelling evidence of serious criminal fraud.
There is no evidence climate scientists have schemed to commit some crime, and precious little evidence they have even made a genuine mistake.
If Donald Trump hands over all his business correspondence over the years, I might change my mind. So far he has certainly hidden a lot of things.
Please stop bullying and harassing climate scientists. It's at the stage where it is getting creepy.
I'm also looking for help debunking this one:
https://realclimatescience.com/2017/02/nasa-noaa-climate-data-is-fake-data/
I think the key question is why is so much of Africa showing "No Data" in the Land Only plot. If that is correct we need a clear explanation for where the Africa land data is coming from. "Interpolated from ocean data" is not going to be good enough for hte denial crowd. Any Help?
Blatz @10
Please understand you are looking at a climate sceptical website. They have printed a NOAA land Plot of global temperatures, (accurately) but "added" their own annotation claiming theres no data. That is simply their unproven assertion. NOAA do not claim there is no data. Just look at my link to the original NOAA map on their website.
Read my post above, and links provided to a map of weather stations in Africa. There is plenty of data for Africa, although not much for central Africa, but there is still some data here. Where data is limited, they extrapolate between known adjacent data points.
The bottom line is we don't have perfect numbers of weather stations evenly dispersed globally, but we have more than enough to compute a highly reliable global average, and regional averages.
nigelj @11
Thanks for your response. I'm still a bit confused as to why they show so much grey "no data" area over africa. Does the GHCN not use GISS data? I understand the "realclimatescience" page is a dishonest source. But they haven't doctored those NOAA plots other than the arrow and text. If the plots are using the GISS data (and I believe they do), they should claim that in the "data source" section.
Blatz @10
The grey area on the global land temperatures map does not designate "no data". It designates temperatures slightly lower than the average by a factor of minus 1. Look at the key at the base of the map.
With respect are you seriously telling me you haven't looked at this scale? I will say it again, I see no evidence that Africa has "almost no weather stations" and I have yet to see a shred of proof of this. I do remain open minded.
Regarding giss data, good question. All the maps both from NOAA and Giss use the same pool of raw data, or have access to it. They just select that data slightly differently and present their maps slightly differently. Personally I find NOAA a bit confusing, but it appears technically correct.
The bottom line is december was an abnormally hot month as a global average, and this is clear from any of the global maps we are discussing, there is clearly a lot of variation in this place to place. Big deal, you would expect that due to regional climate influences.
Blatz @10,
Just one other comment. December was an unusually hot month more so over the oceans than land. This should be apparent looking at the various NOAA maps. However that was just december, and probably reflects the influence of the tail end of el nino ocean phenomenon, in addition to underlying global warming.
We have another different ocean cycle called the pacific interdecadal oscillation that operates on about 30 year time frames. It has been in a negative phase during the period of the so called"pause" and almost certainly contributed to this slowdown. It is likely to switch to a positive phase over the next 10 years. I have seen an article on this, but don't have time to track it down. This will add to the robust greenhouse gas warming we are seeing. It's not going to be great. This is more important than counting the number of weather stations over Africa.
blatz @10 and @12, I have to disagree with nigelj, the grey shaded rectangles do represent no data (as distinct from the white shaded data, which represent "near average" temperature percentiles. That the grey shaded rectangles represent no data is clearly stated on the lower right hand side of the graph:
What Tony Heller purports to show is a contradiction between NOAA's map anomaly temperature for Dec 2016 (shown above), and NOAA's map of temperature percentiles:
The only problem is that the map the anomaly shows almost no data in Africa. In contrast the Land/Ocean version of the anomaly map does:
(All maps source from NOAA.)
Neither anomaly map accurately shows the data actually available. If you go to the GISS temperature analysis, and use the same month (Dec 2016), anomaly period (1981-2010), and the 250 km smoothing radius, it will show data over land only within 250 km of a reporting station. If you do you will see that there is reported data for South Africa, Zimbabwe and Zambia in the south, and for most of West Africa and East Africa north of the equator, but not for Libya. Tony Heller's map excludes all of that Southern African, and most of the Eastern African, north of the equator, data. The current NOAA map, on the other hand, shows data over far more areas than that, but that is because the land temperatures shown are based on a smoothed product, which deliberately fills in areas having no data using data from nearby sites (and averages across areas with data). In doing this, they use land data over land only.
Further, in the land only anomaly (unsmoothed version), they exclude data which do not have data from sufficient fields around them.
There method for doing this has been publicly available for over 10 years.
Finally, the hot temperatures shown over south, eastern Africa in the Land/Ocean anomaly map (in contradiction to UAH) are probably an artifact of the method. GISS, which smooths the same data using a different algorithm shows temperatures near the 1981-2010 anomaly value over that period, ie, agrees with UAH. That does not mean their global anomaly is out, however, as it is calculated from the unsmoothed data (as I understand it).
Blatz @12, my apologies. I miss read that map. My colour vision is not the greatest at the best of times, and I missed that note.
However like I said in my early post above, NOAA are confusing in how they depict data, and you are better to look at the NASA website. Also look at this website as it gives an indication of where weather stations in Africa are located, and no other data to confuse things.
tahmo.org/african-climate-data/
Tom Curtis and nigelj, thanks to both of you. I think I have a response to my denier friend.
I agree NOAA needs to be more clear with how they present the data. The smallest bit of doubt results in amatuer criticism like this and before we know it, it's on Fox News.