


 Arguments


2017 SkS Weekly Climate Change & Global Warming Digest #10
Posted on 12 March 2017 by John Hartz
Top Stories of the Week... Toon of the Week... El Niño/La Niña Update... Quote of the Week... Graphic of the Week... SkS in the News... Photo of the Week... SkS Spotlights... Video of the Week... Coming Soon on SkS... Poster of the Week... Climate Feedback Reviews... SkS Week in Review... 97 Hours of Consensus...
Top Stories of the Week...
This soil study has some deeply disturbing predictions about CO2 emissions
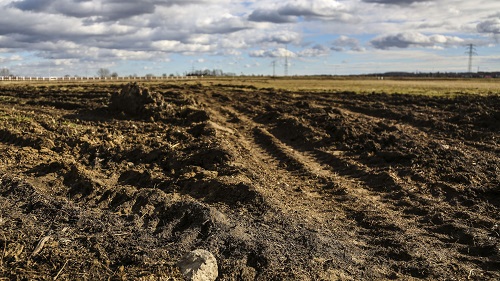
LightRocket via Getty Images
A new study published Thursday in the journal Science has determined that if organic carbon in deep layers of soil warms at a rate similar to surface layers it could result in a dramatic increase in carbon dioxide emissions by the end of the century, if not sooner.
According to research by scientists at the Department of Energy’s Lawrence Berkeley National Laboratory, deeper stores of carbon are more sensitive to warming than previously thought.
“Our calculations suggest that by 2100 the warming of deeper soil layers could cause a release of carbon to the atmosphere at a rate that is significantly higher than today, perhaps even as high as 30% of today’s human-caused annual carbon emissions depending on the assumptions on which the estimate is based,” said Caitlin Hicks Pries, a postdoctoral researcher in Berkeley Lab’s Climate and Ecosystem Sciences Division.
This soil study has some deeply disturbing predictions about CO2 emissions by Ari Phillips, Fusion, Mar 9, 2017
The world’s oceans are storing up staggering amounts of heat — and it’s even more than we thought
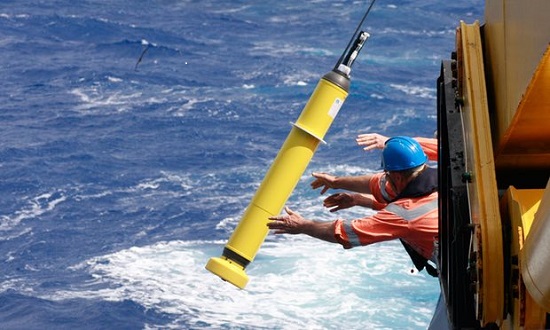
An Argo float is deployed into the ocean Photograph: CSIRO
The world is getting warmer every year, thanks to climate change — but where exactly most of that heat is going may be a surprise.
As a stunning early spring blooms across the United States, just weeks after scientists declared 2016 the hottest year on record , it’s easy to forget that all the extra warmth in the air accounts for only a fraction of the heat produced by greenhouse gas emissions. In fact, more than 90 percent of it gets stored in the ocean. And now, scientists think they’ve calculated just how much the ocean has warmed in the past few decades.
A new study, out Friday in the journal Science Advances, suggests that since 1960, a staggering 337 zetajoules of energy — that’s 337 followed by 21 zeros — has been added to the ocean in the form of heat. And most of it has occurred since 1980.
“The ocean is the memory of all of the past climate change,” said study co-author Kevin Trenberth , a senior scientist at the National Center for Atmospheric Research.
The world’s oceans are storing up staggering amounts of heat — and it’s even more than we thought by Chelsea Harvey, Energy & Enviornment, Washington Post, Mar 10, 2017
Carbon dioxide levels rose at record pace for 2nd straight year
Carbon dioxide levels measured at NOAA’s Mauna Loa Baseline Atmospheric Observatory rose by 3 parts per million to 405.1 parts per million (ppm) in 2016, an increase that matched the record jump observed in 2015.
The two-year, 6-ppm surge in the greenhouse gas between 2015 and 2017 is unprecedented in the observatory’s 59-year record. And, it was a record fifth consecutive year that carbon dioxide (CO2) rose by 2 ppm or greater, said Pieter Tans, lead scientist of NOAA's Global Greenhouse Gas Reference Network.
<p“The rate of CO2 growth over the last decade is 100 to 200 times faster than what the Earth experienced during the transition from the last Ice Age,” Tans said. “This is a real shock to the atmosphere.”
Carbon dioxide levels rose at record pace for 2nd straight year, NOAA, Mar 10, 2017
Toon of the Week...
Hat tip to Moms Clean Air Force.
El Niño/La Niña Update...
NEW DELHI: In what could spell bad news for this year's monsoon, international weather agencies have begun predicting an El Nino event in the second half of 2017.
The latest update, from US state agency NOAA and its funded institutions this week, gives a 50-55% chance of an El Nino forming from July onwards. The indication comes on the back of similar computermodel forecasts released by the India Meteorological Department as well as weather agencies of Australia, Europe and Japan over the past month or so.
El Nino is an abnormal warming of the ocean surface in central and eastern equatorial Pacific which alters weather patterns in many parts of the globe. In India, it's usually associated with weak monsoons. The last four El Nino events in 2015, 2009, 2004 and 2002 had led to poor monsoons and drought in the country
Early signs of El Nino this year, warn international forecasters by Amit Bhattacharya, TNN/Economic Times, Mar 11, 2017
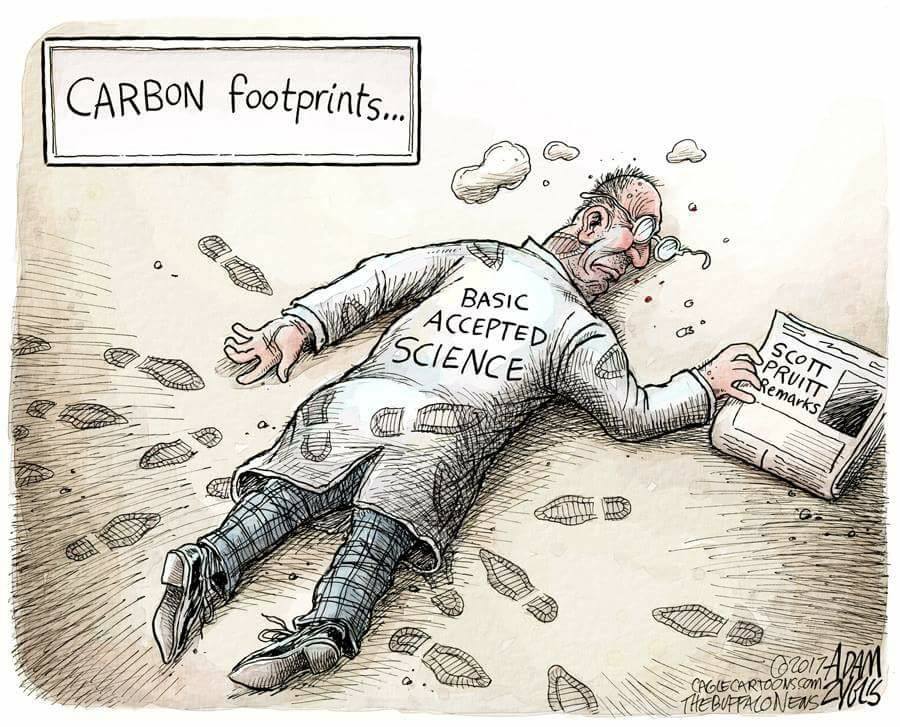
Quote of the Week...
Pruitt’s comments produced a torrent of criticism from scientists, environmental groups, and even his predecessor at the EPA, Gina McCarthy.
“The world of science is about empirical evidence, not beliefs,” said McCarthy in a statement. “When it comes to climate change, the evidence is robust and overwhelmingly clear that the cost of inaction is unacceptably high. Preventing the greatest consequences of climate change is imperative to the health and well-being of all of us who call Earth home.”
“I cannot imagine what additional information the Administrator might want from scientists for him to understand that,” McCarthy continued.
On climate change, Scott Pruitt contradicts the EPA’s own website by Chris Mooney, Energy & Environment, Washington Post, Mar 9, 2017
Graphic of the Week...
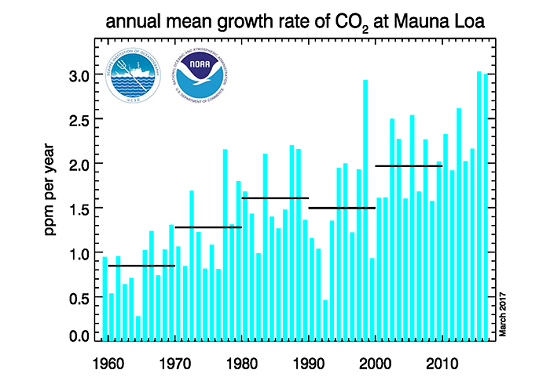
This graph shows the annual mean carbon dioxide growth rates observed at NOAA's Mauna Loa Baseline Atmospheric Observatory. Further information can be found on the ESRL Global Monitoring Division website. (NOAA)
SkS in the News...
The SkS graphic, Human vs. Natural Contributions to Global Warming, is referenced and linked to by:
- David Roberts in his Vox article, Scott Pruitt denies basic climate science. But most of the outrage is missing the point.
- Dan Satterield in his Dan's Wild Wild Science Journal arrticle, Conspiracy Theory Myths are Not Alternative Scientific Opinions. They are Just Wrong.
In his Letter-to-the-Editor published in the Medicine Hat (Alberta, CA) News, Ed Dick included the following:
Over time, a hypothesis which consistently explains the data becomes a theory. Global warming caused by human activity is a theory which is accepted by an overwhelming majority of climate scientists. A 2016 study led by John Cook investigated 12,000 articles on climate change and, of the just over 4,000 that discussed causation, 97.1 per cent concluded that human activity is a significant causal factor.
John Cook responded to a series of questions about the The Consensus Project in Calan Bentley's Q&A, episode 4 posted on his Mountain Beltway blog hosted on the AGU Blogosphere.
In his New Scientist article, Most people don’t know climate change is entirely human-made, Michael Le Page referenced and linkd to the Advanced version of the SkS rebuttal article, The 97% consensus on global warming.
John Cook spoke with Leia Larsen of the Standard-Examiner about climate change confusion, the current political climate and how to counter alternative facts. Their conversation is documented in Larsen's article, Acclaimed climate science expert to visit Weber State sustainability summit.
Photo of the Week
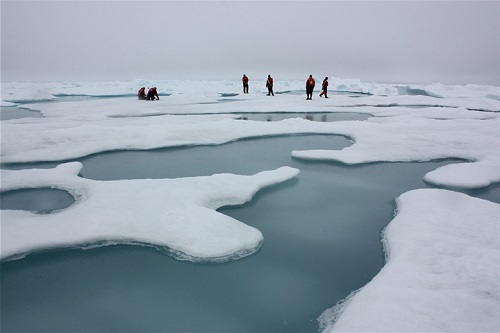
Arctic sea ice and melt ponds in the Chukchi Sea. Credit: NASA/Kathryn Hansen
Arctic sea ice may vanish even if world achieves climate goal: study by Alister Doyle, Reuters/Climate Central, Mar 11, 2017
SkS Spotlights...
Moms Clean Air Force is a community of 1,000,000 moms and dads united against air pollution – including the urgent crisis of our changing climate – to protect our children’s health. We arm members with reliable information and solutions through online resources, articles, action tools, and on-the-ground events. We work across the US on national and local policy issues, through a vibrant network of state-based field teams. Our moms meet with lawmakers at every level of government to build support for commonsense solutions to pollution. Moms have passion and power – an unbeatable combination. We are harnessing the strength of mother love to fight back against polluters.
Moms Clean Air Force is a special project of Environmental Defense Fund.
Video of the Week...
Are humans contributing only 3% of CO2 in the atmosphere? by Potholer54, YouTube, Nov 30, 2016
Coming Soon on SkS...
- The fossil fuel industry's invisible colonization of academia (Benjamin Franta and Geoffrey Supran)
- Elevator Pitches - Chapter 02 - Radiative Gases (Rob Honeycutt)
- Trump launches an all-out offensive in the war on science (Dana)
- Ben Santer on Late Night with Seth Meyers (Peter Sinclair)
- Guest Post (John Abraham)
- 2017 SkS Weekly Climate Change & Global Warming News Roundup #11 (John Hartz)
- 2017 SkS Weekly Climate Change & Global Waming Digest #11 (John Hartz)
Poster of the Week...
Climate Feedback Reviews...
Following on Climate Feedback’s analysis of its story titled “Scientists: Here’s What Really Causes Climate Change (And It Has Nothing To Do With Human Beings)”, the Daily Wire has corrected key statements in the brief post—including the headline. Unfortunately, the large number of people who read this widely-shared story are unlikely to see that it has been corrected.
The Daily Wire corrects story analyzed by scientists, but it’s still misleading, Climate Feedback, Mar 7, 2017
SkS Week in Review...
- 2017 SkS Weekly Climate Change & Global Warming News Roundup #10 by John Hartz
- How Green is My EV? by David Kirtley
- To tweet or not to tweet at Donald Trump? That was the question! by Baerbel W & John Mason
- Explainer: How much did climate change ‘cost’ in the 20th century? by Roz Pidcock (Carbon Brief)
- Americans are confused on climate, but support cutting carbon pollution by Dana Nuccitelli (Climate Consensus - the 97%, Guardian)
- 2017 SkS Weekly Climate Change & Global Warming Digest #9 by John Hartz
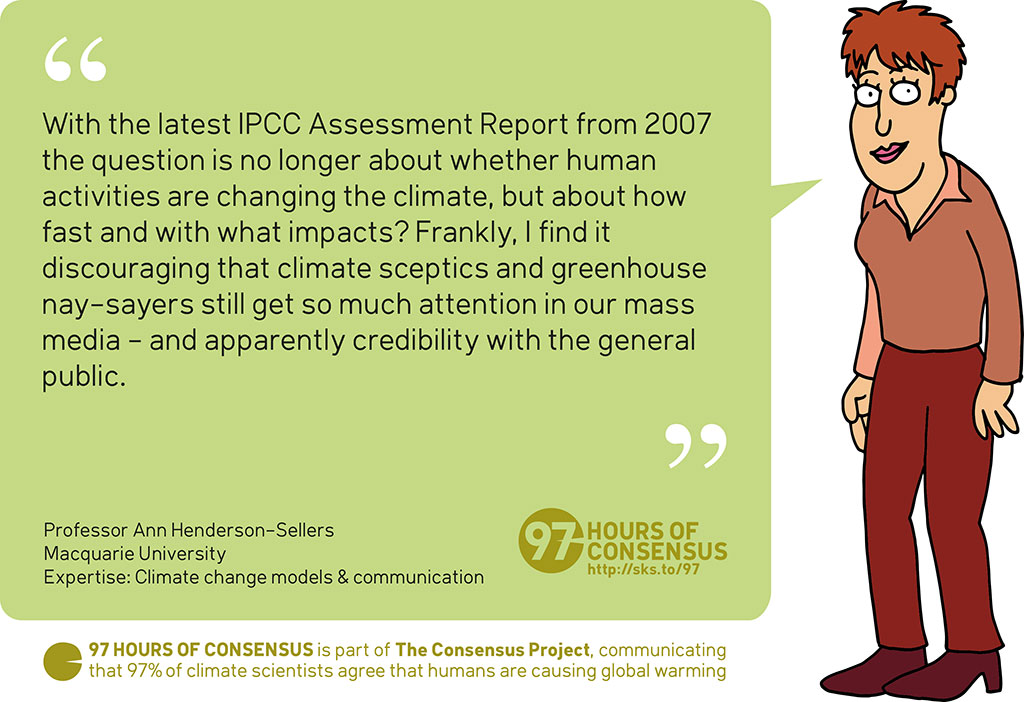
97 Hours of Consensus...


Um, a 5055% chance of an El Nino?
[JH] A little dash will do it! Thanks for catching this glitch.
What has happened in the past everytime we have seen en elevation in temperature, CO2 levels, Volcanic activity, and a decrease in Solar Activity? An Ice age. Every single time in history this has happened an Ice age as always followed. So we are in fact headed for another Ice Age. Global Warming is a joke.
[RH] Sloganeering. Please read the SkS commenting policies before continuing to contribute.
HydrogenOne @2 is plainly sloganeering, so I do not expect it to survive the moderators attentions (see the comments policy). I will restrict my comment to note that typically when "... we have seen en elevation in temperature, CO2 levels, Volcanic activity, and a decrease in Solar Activity" an ice age has not followed. Typically those conditions have resulted in soaring global temperatures because the changes in solar activity over time are very small relative to the change in forcing that has followed on changes in CO2 levels.
HydrogenOne merely demonstrates again (as if we needed another demonstration) that it is very easy to convince yourself of what you wanted to believe in the first place if you allow yourself the luxury of fake facts.
The chart of changes in atmospheric CO2 is very interesting because it shows a relationship between changes in CO2 level and annual temperatures. The dip in temperatures relating to the Mount Pinatubo eruption (1992) is very prominent, as are the peaks in 1987/88, 1998, 2005, 2007, 2010, 2015 and 2016, all of which set globa temperature records at their time (and most of which were El Nino years). There are some exceptions. 2012 shows a massive increase despite being a cool year (for its decade), and 2014 barely increases over 2013, despite being a record warm year at the time.
This relationship at least partly is caused by the fact that the ability of sea water to absorb CO2 is a function of temperature. In cool years more of the annual anthropogenic emisssions are absorbed. In warm years less. That results in a smaller atmospheric increase in cool years, and a larger one in warm years, even though the total increase is always 100% anthropogenic.
It does mean, however, that looking at the annual atmospheric increase is a poor way of estimating annual anthropogenic emissions. Annual anthropogenic emmissions increased by an average of 3.28% per annum from 2000-2007, but at half that rate thereafter (1.62% per annum). The increases for 2012, 2013, and 2014 (the last year for which data is available) were 0.76%, 1.70% and 0.78% respectively. In absolute terms, that makes 2012 and 2014 the smallest annual emmissions in the 21st century excluding 2008 and 2009.
There is reason to hope, given this data, that the world is on the verge of stopping the annual increase in fossil fuel emissions. That hope is, of course, severely challenged by the advent of the Trump administration. We cannot, however, conclude from the annual mean growth of CO2 that the world has resumed its former, precipitate growth the use of fossil fuels. Nor can we conclude from that possible stabilization of CO2 emissions that we are effectively tackling climate change, for which CO2 emissions have to reduce rapidly.
These sorts of papers are simply bunk. We just had a 10 year study that predicted methane boiling out of the melting permafrost in the arctic. After 10 years - no methane. Their determination - not that they were wrong but "it hasn't happened yet."
[JH] Sloganeeing snipped. Per the SkS Comments Policy:
Tom Curtis - these temperature records set were highly unreliable. They were strictly from satellite data and if memory serves the increases were 10% of the possible error bars. Using ground measurements showed none of these records.
I read a paper by Dr. Crisp who calculated the yearly amount of CO2 dumped into the atmosphere by the use of fossil fuel and the outgassing of the cement that is used in such massive quantities in today's society.
This led me to calculating the amounts of CO2 that would be necessary to raise the atmospheic levels of CO2 since 1960 since this appears to be a linear growth. My numbers and Dr. Crisp's were very close.
This would indicate that ALL the growth in atmospheric CO2 is from man. But in fact while the growth in CO2 since 1960 has been linear, the growth in fossil fuel by man and the growth of the use of cement and other CO2 outgasing sources has been logarythmic.
What this means is that these studies are entirely in their infancies and making ANY predictions with the facts so occluded as they are is betting heavily on a pair of duces while someone else is showing aces.
[JH] All-caps snipped. In additon, please provide a link to the Crisp paper that you read.
Wake @6:
In fact, you have exactly reversed the facts. The Satellite record shows records in 87, 88, 91, 98 and 2016. The surface record, which is considerably more accurate, shows the records I mentioned:
I assume that you meant exponential growth. Logarithmic growth decelerates over time, as with the red line below. Exponential growth accelerates, as with the blue line:
In any event, again your claim reverses the actual facts. CO2 emission growth has been uneven, but approximates to linear growth:
In contrast, CO2 concentration has been increasing at a faster than linear rate:
These two facts are perfectly compatible, given that CO2 concentration is a function of cumulative CO2 emissions, and the cumulative function of a positive linear function grows at a faster than linear rate (but not as fast as a quadratic or exponential function):
Wake, emissions growth over the last couple of centuries correlates rather well with population growth as below. There are some deviations, but many obvious explanations. Just because we have exponential population growth, remember the upper leg of an exponential curve is not always very curvy.
www.easterbrook.ca/steve/wp-content/Pop-vs-emissions.pdf
Further to my comment @4, the IEA has released its estimate of 2016 energy related emissions, which again show no growth over the prior year:
It also indicates that there are signs of the decoupling of economic growth and emissions growth:
Although that estimate does not include emissions from cement use, agriculture or land use change, which probably combine to result in a overall increase in anthropogenic emissions, still this would be a good sign were it not for the recent election of Donald Trump, which will almost certainly reverse the trend towards minimal emissions growth.