


 Arguments


Earth Encounters Giant Speed Bump on the Road to Higher Sea Level
Posted on 29 March 2013 by Rob Painting
The Earth is warming which is driving the ongoing thermal expansion of sea water and the melt of land-based ice. Both processes are raising sea level, but superimposed upon this long-term sea level rise are what scientists at NASA JPL (Jet Propulsion Lab) have coined, "potholes and speed bumps on the road to higher seas". (See their follow-up paper - The 2011 La Niña: So strong, the oceans fell, Boening [2012]).
Since mid-2011 a giant "speed bump" has been encountered. In roughly the last two years the global oceans have risen approximately 20 millimetres (mm), or 10 mm per year. This is over three times the rate of sea level rise during the time of satellite-based observations (currently 3.18 mm per year), from 1993 to the present.
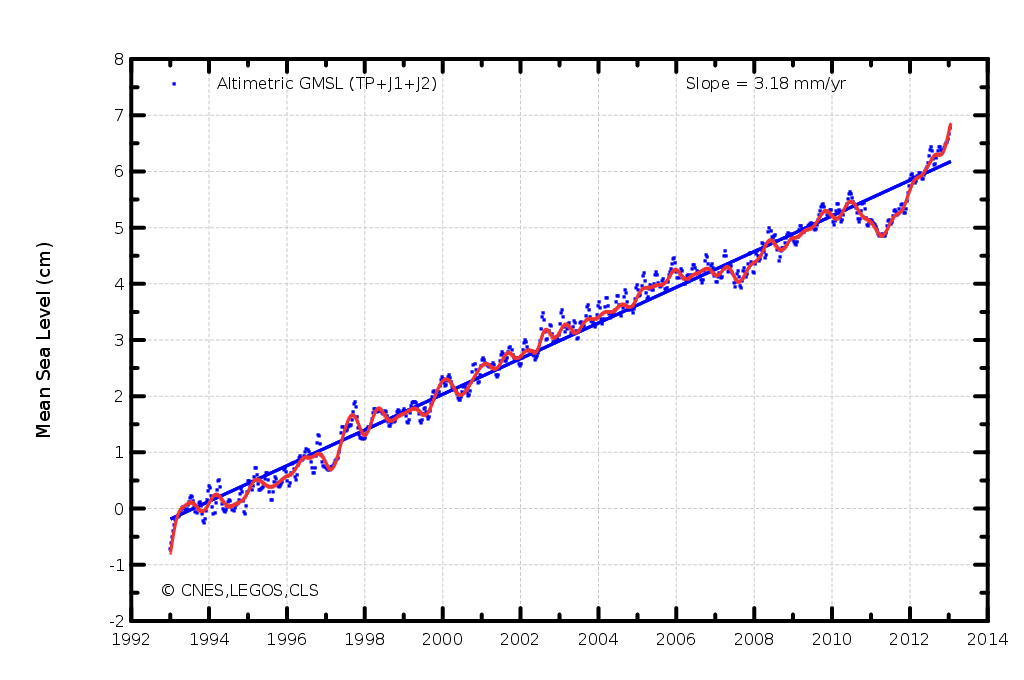
Figure 1 - mean sea level (in centimetres) since 1993 obtained by satellite altimetry observations. Annual and semi-annual signals have been removed to reveal the long-term trend. The glacial isostatic adjustment (GIA) of 0.3mm per year is added to account for the slumping of ocean basins. Image from the AVISO website.
So does this mean land-based ice is undergoing a remarkably abrupt period of disintegration? While possible, it's probably not the reason for the giant speed bump.
Pot Holes and Speed Bumps
The largest contributor to the year-to-year (short-term) fluctuation in sea level is the temporary exchange of water mass between the land and ocean. This land-ocean exchange of water is coupled to the natural Pacific Ocean phenomenon called the El Niño Southern Oscillation (ENSO) - which affects weather on a global scale. (See Ngo-Duc [2005], Nerem [2010], Llovel [2011], Cazenave [2012] & Boening [2012] - linked to above)
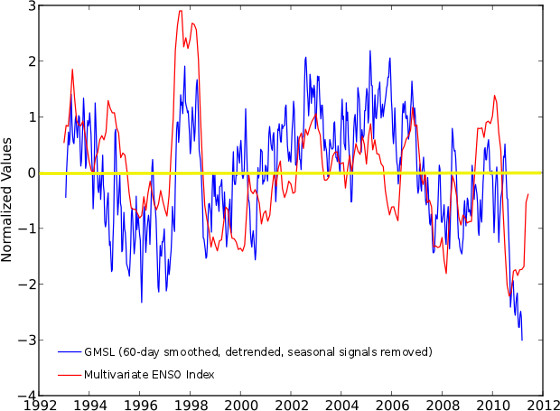
Figure 2 - Global sea level with the long-term rise (trend) removed. Sea level (blue line), compared to the Multivariate ENSO Index (a measure of the state and scale of ENSO) in red. Negative values represent the La Niña (cold) phase, and positive values the El Niño (warm) phase. Image adapted from the University of Colorado (CU) Sea Level Research Group.
The ocean, through strong evaporation in the tropics, is the source of the water that is being exchanged. Each occurrence of ENSO has its own unique set of characteristics, but La Niña is typically (although not always) associated with greater-than-normal rainfall and snow over land, and a consequent sharp, but temporary, fall in global sea level (pot holes) as the continents soak up the extra water. With El Niño we often see greater-than-normal rainfall and snow concentrated over the oceans. Combined with the drainage of water back into the oceans, this causes an abrupt, but temporary, rise in sea level (speed bumps).
Even though El Niño has not developed over the last two years, it appears that a lot of water has drained from the major continental basins over the last (almost) two years - which has created this giant speed bump. This seems to be supported by the latest Multivariate ENSO Index data which shows a progression from strongly negative values (La Niña) in 2011, to mildly positive ones in 2013. Despite current conditions not being classified as El Niño in a technical sense, this change should have led to drying of the continents - as is usual when the weather moves away from a La Niña phase. But that's not the whole story either.
The loss of land-based ice is not a smooth progression. It's a common misconception that the great ice sheets of Greenland and Antarctica are losing more ice year-upon-year, but this isn't quite correct. Ice mass loss is indeed accelerating if we look at say a 10-20 year period, however the ice mass balance is obtained by weighing the snowfall gain on the top of the ice sheet, against the ice loss, through glacier calving, at sea level. This tells us whether the ice sheets have gained ice (mass), or lost it, in any given year. Even though the ice sheets are losing ice at a greater rate over time, there is a great deal of variation from year-to-year (see Van den Broeke [2011]). This mass balance variability is illustrated in Figure 3 below.
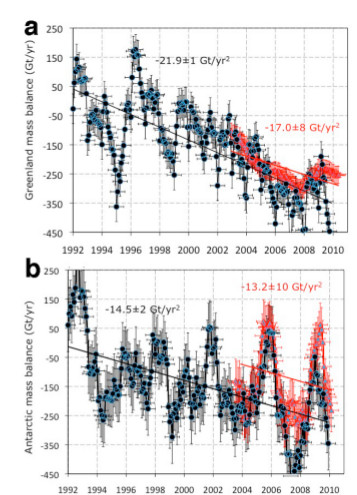
Fig 3 - Mass balance estimate of: a) the Greenland ice sheet, and b): the Antarctic ice sheet. While these estimates have been refined in the intervening period since this paper was published, note the very substantial year-to-year variation in ice sheet mass. Image from Rignot (2011).
Although small in absolute sea level terms, relative to the short-lived land-ocean water exchange, this fluctuation in ice mass balance can either add to, or diminish, the multi-year variability. For a scale comparison; meltwater from the ice sheets of Greenland and Antarctica have added an estimated 11 mm of total sea level rise to the oceans between 1992-2011 (Shepherd [2012]) - about the same amount of sea level rise experienced in the last year alone.
Expertise Matters, Which is Why Contrarians Constantly Mangle Climate Science
As sea level was going through its dramatic plunge in 2010-2011 we saw a number of contrarians demonstrate their utter lack of understanding of the processes that influence sea level. For instance WUWT, the popular contrarian blog, featured a post by John Kehr on this topic where he wrote:
"...a significant drop in the global sea level highlights serious flaws in the IPCC projections."
and:
"The fact that CO2 levels have been higher in the last 5 years that have the lowest rate of rise than the years with lower CO2 levels is a strong indicator that the claims of CO2 are grossly exaggerated."
Neither of these claims is true. Sea level rise is currently at the upper bound of projections made by the Intergovernmental Panel on Climate Change (IPCC), and increased CO2 concentrations in the atmosphere don't magically make La Niña and El Niño disappear - pot holes and speed bumps will continue.
As with all things in life actual expertise matters.
Deeper Pot Holes and Steeper Speed Bumps?
Examining Figure 1 it is very clear that the last pothole and speed bump are quite unlike anything else in the observational record. The sheer size of the two stand out like a sore thumb. Whether this is just some blip or a sign of things to come is not yet known.
It is, however, useful to point out that, as the oceans and Earth become warmer, the atmosphere is able to hold and redistribute more water vapour. Because this increased capacity rises at a rate faster than the warming itself (the Clausius-Clapeyron relation), we expect to see greater rainfall or snow at times when moisture is converged, and less rainfall or snow when moisture diverges.
This suggests that we are likely, for a time, to observe larger La Niña potholes - when more intense rainfall and snow is dumped over the continents, and larger El Niño speed bumps - when more intense rainfall and snow is focused over the oceans, and the continents become drier.
This enhanced capacity to move water from ocean to land (and vice-versa) via atmospheric warming may be a piece of the puzzle, but it doesn't explain the dramatic change in variability over the last few years. It may be connected to an inferred global brightening (increased solar radiation reaching the Earth's surface) in the last 5-6 years (Klimont [2013]) - a phenomenon which would accelerate the global water cycle (Wild [2011]) - or it could be something else entirely. No doubt it's a subject currently under scientific investigation.
Sea Level: A Long, Lumpy, Uphill Road
While it is likely that the record 2012 summer melt season on the Greenland ice sheet has shed more ice into the ocean, there's no evidence yet to suggest that either that, or ice loss from Antarctica, has added to this giant speed bump in any significant manner.
Sea level is already committed to rise many metres over the coming centuries because of the concentration of greenhouse gases humans have put into the atmosphere. The warming from this will enforce the continued disintegration of land-based ice, and the thermal expansion of seawater (Meehl [2012], Foster & Rohling [2013]). This uphill road to higher sea level is bound to be long and lumpy one - with many potholes and speed bumps along the way.
Related SkS rebuttals/posts: Why did Sea Level Fall in 2010?, and Global Sea Level Rise: Pothole to Speed Bump.


The sample size is small, but has anyone looked at whether the effects of ENSO on sea level are amplified as global mean temperature rises? The idea being the 1997-1998 ENSO event produced a modest dip and rise but the much smaller ENSO over the last few years produced a much larger decrease and increase. Is the effect of ENSO on sea level nonlinear with temperature? (I know, I'm asking you to do background research for me, but maybe you just know this from looking at the literature recently.)
I expect WUWT will run a correction for their claims that the pothole two years ago was an indicator that sea level rise was slowing. Not.
The rise is steeper that I expected it to be. Hopefully it will slow down again soon.
Nice article Rob. How often do they update the AVISO website with the graph you show?
michael sweet at 05:09 AM on 30 March, 2013
Like Horatio Algeranon said elsewhere:
Warming never starts
It only ever stops
Though lower in the past
The temperature always drops.
GCNP58 - I've not run across scientific papers that address this directly. They may exist but I haven't stumbled across them. But nevertheless, this intensified sea level variation coupled to ENSO is implied from climate model simulations in a process known as the intensification of the global water (hydrological) cycle. This is something observed to be well underway, but where observations suggest actual changes are twice that projected by climate models (Durack [2012]). La Nina and El Nino represent extremes in the global weather, so it's where we should expect to see this water cycle intensification (eventually at least).
I would not anticipate that any of the models project the kind of behaviour we have observed recently. The water cycle intensification is more a gradual one in the simulations - even allowing for the greater-than-modelled water cycle observations. It could be that some component, or components, are missing from the models. But then again this could just be some (as yet not understood) aberration and we see a return to smaller multi-year variation.
Another consideration are the continental drainage basins of the Northern Hemisphere. Some of these were once frozen solid, but some have now thawed with global warming and may be starting to contribute to continental storage and drainage of water.
The problem with all of this is that the global observations of these quantities is not robust, and the uncertainty in measurements is large. The reconstructions of global sea level throughout the 20th century are quite varied, which indicates the difficulty. Teasing even weaker signals out of the data is going to take some work.I just thought it useful to point out that there is a scientific expectation that ENSO-related sea level change will grow more variable at the planet gets warmer, and the weather more extreme. Something many readers are perhaps unaware of.
SkS will have more on this in the future.
Michael Sweet - Not sure about AVISO updates, I check back there periodically. Maybe every 8 weeks?
This is a very nice article. I just have a quibble. To my ear, the metaphor of a speed bump in sea level rise stongly suggests a cause for a temporary reduction in the rate of increase. Speed bumbs are designed to force motorists to slow down. But you mean the metaphor just to be heard as a pictural representation of the shape of the sea level function in the vicinity of a local maximum. Googling the phrase "speed bump on the road to..." only seems to return uses that are opposite to the intended meaning of your title. For instance:
"Comparison—A Speed Bump On the Road To Happiness & Simple Living. “Comparison is the death of joy.” ~Mark Twain."
"It's expected to be a fiscal speed-bump on the road to economic recovery that is otherwise looking good."
etc.
Pierre-Normand - The gals and guys at NASA JPL came up with that. I think it's a nice simple way to convey the message. Especially when we consider that the majority of Earth's population do not know anything about sea level rise. YMMV.
Pierre-Normand:
Given that the analogy is "potholes and speed bumps", both are reasons to slow down a vehicle on a road. They represent irregularities - one where the observations are lower than a smooth ride, and one where observations are higher than a smooth ride. Neither is necessarily related to the long-term trend of the altitude (slope) of the road.
Thas's true, rob. NASA JPL coined the terms. But they also clearly meant the "speed bump" to represent a slow down in the rate of sea level rise and the "pot hole" to be an extreme case of a "speed bump", that is, an actual reversal of the sign of the trend. Whereas you use the term "speed bump" to refer to the recent sharp increase in the rate of sea level rise. This is queer and rather contrary to common usage. I didn't object to the very use of the metaphor. But it's just a quibble.
Of course, I agree with Bob on both counts.
I have the same problem with the metaphor as Pierre-Normand@6,9 but object more strongly to its use. The purpose of a metaphor is to provide a strong image explaining a reality that may otherwise be unfamiliar. In this case, "sea level rise encounters a speed bump" clearly means that "sea level rise slows down abruptly (and will presumably increase after passing over the speed bump)." In other words, the common implication of the metaphor is opposite to the reality. No metaphor is better than a bad metaphor. In this case, it might be better to replace "pothole" with "(abrupt) slow down" and "speed bump" with "(abrupt) speed up."
The obsession with overinterpreting the metaphor is somewhat odd. Figure 1 shows a striking resemblance to an uphill road with a large number of pot holes and speed bumps on it.
BillEveritt - sorry, but your suggested alterations have poor memorability - which is not a good thing from a communication point of view. If you can come up with a better metaphor, I'll consider it when next writing on this topic.
There is no need to use another metaphor, Rob. This metaphor would be just fine if you weren't using it to denote the almost exact opposite (a temporary increase in speed) of its already well established use (a sudden hurdle/a cause of a slowdown). I'd be surprised if any other reader of this thread will have at first understood your title "Earth Encounters Giant Speed Bump on the Road to Higher Sea Level" to designate the fast increase of the last two years, as you intend it to. NASA/JPL also were clearly describing the previous sea level fall -- the pot hole -- as an extreme case of a mere speed bump (mere reduction of a positive trend).
Rob, if you show 100 people a headline "Sea level rise encounters speed bump", and ask them if it means an increase or a decrease in the speed of sea level rise, I'd expect more than 50 of them to choose a decrease. I myself would interpret it that way. In fact, I feel strongly enough about it to make this comment.
So, at least some people interpret the title to mean the opposite of what was intended, which is also not a good thing from a communication point of view.
If you want memorable, how about 'The downs and ups of sea level rise'? That's exactly what happened, and the reversal of 'ups and downs' sure sticks.
Ups and downs? Meh...
Still open to a better metaphor.
'Slumps 'n' Jumps'?
Speedbumps works well for me - a temporary slowing often followed by an aggressive acceleration. In reality there's often a futility to the few speedbumps that get built, they provide a false sense of security and stop people looking at the bundle of measures needed to actually cut traffic speed to a safe level.
Looks like if there will be more rain, there is an argument for more effort in keeping that water on land, or replenish ground-water reserves. More dams, even more so where water can 'leak away' into underground aquifers. In stead of returning to the oceans. I imagine that in the past such locations for dams have been avoided?
Snakes and Ladders.
Count me as another who misread the title and considers a vivid, memorable metaphor a bad thing if it inclines you to remember a falsehood. The recent rise is a speed bump-up, not a speed bump. Metaphor aside, good piece.
Philp Cohen - Duly noted. I think a tweak is all that's required.
Nichol - depending on the time frame under consideration, there can actually be a net gain, or net loss, of moisture from the continents. There doesn't seem to be any long-term trend over multiple decades - See Ngo-Duc (2005) linked to in the blog post - but for any given decade the trend can vary. From 2002-2009 , for instance, there has been a net gain in continental water mass equivalent to a fall in global sea level of around 0.2 mm per year (Jensen [2013]). Not that surprising given the ENSO trend.
Interesting. I had no idea that La Nina and El Nino had such impact on sea levels. However, I expect that after the Arctic goes ice free in summers after about 2017-2020, the Greenland Ice Sheet melting will accelerate significantly. With the Arctic ice gone the summer sun will warm the Arctic Ocean. The warming of the Arctic Ocean will also accelerate at more ice is lost, and the time of no ice lengthens. With this, the Arctic will warm considerably over its current state. As the Arctic warms, the Arctic Winter Ice Maximum will decrease. Now the big question is how long will it be before the Winter Ice Maximum reaches zero? As the WIM decreases each year, Greenland will melt more and more ice. It is going to get interesting.
CraigD@21
Iteresting question, I haven't heard any prognosis about zero WIM. Looking at PIOMAS death spiral, with full rotation of 36y, it will have taken ~40y for the summer ice to reach zero (I agree with you and Maslowski on that). By that time, it looks like WIM will be at the point where summer min has started. So my wild guess is: it'll take another ~40y if the process continues at the same speed.
So my wild, uneducated guess for zero WIM is: 50y. Interesting indeed, as it may be within the lifetime of some of us. Anyone wants to make another/better guess?
How does it influence the IS melting? Does it make sense in context of SLR rate? Yes IS melt should increase (some 10 times on average from their current contribution of 1mm/y), to fullfil the predistion of ~1m SLR by 2100 the semi-empirical models. Such increase makes sense to me.
Using a generous and simple 30-year linear for thickness (PIOMAS/CTSIA), I have winter max eventually moving to mid-February with ice finally disappearing on February 11th, 2076. The 10-year linear has it in 2047 on March the 12th. No, I'm not putting money on either. I just can't see an ice-free Arctic year-round, unless we hit 600ppm and stay there for a while. Yet I speak from within the momentum of my own culture. It's hard to imagine what general circulation changes will occur when ice is just beginning to form in December, and harder to imagine what those changes will mean for the further (lack of) development of the ice.
Could this anomaly in the rate of sea level rise be partially attributable to where heat is being added to the ocean?
To illustrate what I'm getting at, consider this: Based on fresh water having a negative thermal coefficient of expansion between 0C and 4C, someone might argue the drop in sea level is a sign that water between 0 and 4 C is warming. Obviously this is overly simplistic and is not the case for seawater. Figure 3.1 here shows that seawater does not have a negative coefficient. However, it does show that heating water in the 0C-10C range will result in much less expansion than heating water in the 10C-20C range.
So my layman's analysis says that we should not be too surprised that decreased rates of sea level rise coincide with a time when other evidence points to more heat going into the deep oceans.
CraigD@21,
At the Arctic Sea Ice Forum there has been discussion of this, including a posting of this link http://www.pnas.org/content/106/1/28.short to an article that shows evidence that thermodynamically a seasonally ice-free Arctic is an unstable state that transitions easily to a year-around ice-free state.
[DB] Eisenman has a nice followup in 2012 further examining that, here. A full copy of Eisenman and Wettlaufer 2008 is here.
ianw01 - Yes, another commenter has pointed out the same thing, and it's something I've been looking in to for a while - moving heat into the deeper ocean will lower the rate of thermal expansion. This is a likely (partial) explanation for the sea level trend over the period of satellite-based observations, where sea level rise has been near-linear despite the acceleration in ocean heat content and land-ice contribution.
A candidate for a future SkS post for sure.
chriskoz
Wipneus at Arctic Penguis, a regular at Neven's blog has done regression fits to the trends from PIOMAS for each month of the year
The fits are an exponential fit since that gave a better fit than any other type of curve. September goes to zero in 2015. But even the fit for April, which is maximum volume, is looking like 2030 or so. Obviously a caveat about projecting that far into the future but.
It's hard to say what the physics of winter ice formation up there will be in a warmer world. Arctic ocean warmer but the air will still be cold and it will be dark for months. Hard to say which will win out.
The sudden uptick in sea level rise as indicated on the NASA website can be partialy explained by the flood water returning to the sea but the amount of increase now exceeds this. I find it difficult to believe that it is due to warming of the oceans as this tends to be slow and gradual. The events that can give a quick increase would be glaciersfrom four sources. Greenland, Antarctica, land based mountain glaciers and smaller coastal glaciers could all add to the total in a relatively short space of time but I have not heard of any reports to that effect. It would be a worrying trend if that were the case.
Climate Bob, actually I suspect the uptick is due to the combination of flood waters (from the time of the dip) returning to the oceans and evaporated water from the severe droughts the past couple of years. Ice melt undoubtedly plays a part, but I don't think there has been a recent significant increase there. Basically, we have gone from having higher than average water on land (i.e. flooding) to lower than average (i.e. droughts).
From a newbie: Does the continued rise in SL during the recent temperature hyiatus show continued GW?
[Rob P] - Yes, that's how very simple this is. Sea level rise is a combination of extra water volume from the melt of land-based ice, and the expansion of seawater as it gets warmer. The ongoing rise in sea level, although complicated by a number of factors, is a clear indication the oceans are continuing to warm.
As for surface warming, the rate appears to have slowed over the past decade or so, but one needs imagination to describe it as a pause or hiatus. Plenty of people possess the necessary imagination of course......
sailingfree, yes. However, you have to keep in mind that the "hiatus" is for surface temperature and starts roughly in 2007-2008. Not much of the accumulating energy (global warming) is going into warming the troposphere/surface. Most is going into the oceans. Not much of a hiatus there.