


 Arguments


The Oceans Warmed up Sharply in 2013: We're Going to Need a Bigger Graph
Posted on 31 January 2014 by Rob Painting
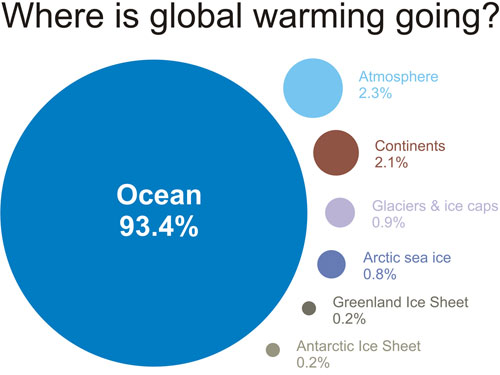
Because the oceans cover some 71% of the Earth's surface and are capable of retaining heat around a thousand times that of the atmosphere, the oceans are where most of the energy from global warming is going - 93.4% over recent decades. So greenhouse gases emitted by human industrial activity not only cause more heat to become trapped in the atmosphere, they also cause more of the sun's energy to accumulate in the oceans.
Long-term the oceans have been gaining heat at a rate equivalent to about 2 Hiroshima bombs per second, although this has increased over the last 16 or so years to around 4 per second. In 2013 ocean warming rapidly escalated, rising to a rate in excess of 12 Hiroshima bombs per second - over three times the recent trend. This doesn't necessarily mean we are entering a period of greatly accelerated ocean warming, as there is substantial year-to-year variation in heat uptake by the oceans. It does, however, once again dispel the persistent myth of a pause in global warming, because the Earth has actually continued to warm faster in the last 16 years than it did in the preceding 16 years.
As can be seen in Figure 1 below, the global oceans have warmed so quickly in 2013 that the National Oceanographic Data Center (NODC) is going to need a bigger graph.
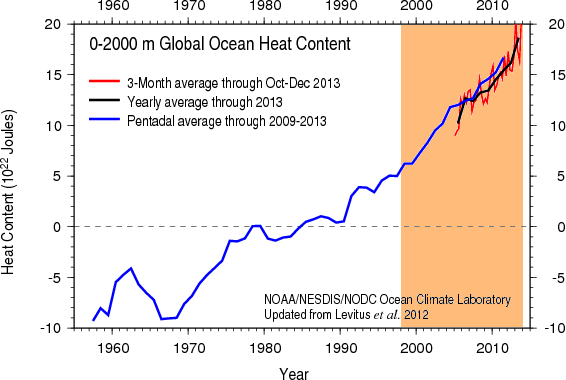
Figure 1 - Ocean Heat Content data for the 0-2000 metre layer (based on Levitus [2012]) for the period 1957-2013. The orange band highlights the interval falsely labelled as a 'pause' in global warming. Further ocean warming will necessitate the vertical axis being extended. Image adapted from the National Oceanographic Data Center (NODC).


Can anyone tell me what the heat content scale translats into in terms of average temperature increase? Easy calculation if I knew the mass of the ocean.
Clever cultural reference in the headline.
What has caused the heating of the ocean to increase and the heating of the atmpsphere to slow down in recent years?
rocketeer - see discussion further up. here.
John Wise @ 3.
The important point is that the planet is capturing more solar input energy because of increased greenhouse gases, particularly the increase in excess CO2 resulting from the burning of fossil fuels and other human impacts.
Until the surface warms to a level that emits radiation at a rate that is balanced with the higher level of energy capture there will continue to be 'net energy capture'. When the ocean surface is cooler, warmth is taken from the surface into deeper ocean layers that 'do not emit heat out of the planet'. The result is energy capture in the oceans until such time as the deeper heat rises to the surface. The next strong El Nino, like the ones that occurred in 1997-98 or 1982-83, could produce very dramatic increases in the surface temperature records. There are similar currents in other oceans, but there is a strong correlation between the Pacific Ocean ENSO (El Nino, La Nina), and significant bumps and dips in the surface temperature.
So, the 2013 global surface average being almost as warm as 1998 while the ENSO is in a slightly cooler than neutral phase indicates that warming has continued.
p.s. In addition to creating excess CO2 the burning of fossil fuels creates other damaging impacts. And it is fundamentally unsustainable because (burning up non-renewable resources). So the CO2 impact on the climate is only one of many reasons this activity needs to be curtailed, the sooner the better.
One Planet @ 5
I am aware of and have a basic understanding of the greenhouse effect,ocean acidification etc. What I am not clear on is what has changed in the last few years to cause more heat to be captured by the oceans and less in the atmosphere with the resultant slower rate of surface or atmospheric warming.
[TD] La Nina: Trade winds push warm surface water to the west, which causes deeper, colder water to rise to replace it. See this post.
John Wise - it seems to a be natural phenomenon tied to the poleward transport of heat. Stronger easterly trade and midlatitude westerly winds spin up the subtropical ocean gyres.
As the tropical surface water is pushed westward in opposition to the Earth's eastward rotation it decelerates, and thus has slower rotational velocity than the Earth below, and relative to other 'parcels' of seawater which are rotating at the same speed as the Earth. The Coriolis force points the decelerating parcel of seawater poleward. At the midlatitudes, the westerly winds push surface seawater eastward in the same direction as Earth's rotation. Relative to the Earth and other parcels of seawater, the wind-affected parcel is now accelerating, and is therefore directed equatorward by the Coriolic force. These two near-surface currents converge in the centre of the subtropical ocean gyres and, with nowhere else to go, the water is directed downward into the ocean interior (known as Ekman pumping).
This is where the majority of deep ocean warming is occurring in the last decade or so - in the subtropical gyres. A near-coherent spin-up of all five subtropical ocean gyres was observed from the early/mid 1990's through to about 2004, when a peak was reached. They have remained in a relatively intense state since then, with a little bit of a lull between 2006-2008.
The North Pacific subtropical gyre spun up intensely in the middle of the 2013 year, and the South Pacific subtropical gyre intensified leading up to the end of 2013. Both appear to have spun down substantially since then. The South Atlantic subtropical gyre seems still to be in a spun-up state. Based on our physical understanding of this wind-driven ocean circulation, these intense spin-ups should have transported more heat to the deep ocean.
When this wind-driven ocean circulation moves into its sluggish phase (the positive phase of the Interdecadal Pacific Oscillation [IPO]), surface warming is likely rise abruptly. There are some tentative signs that this process may already be underway, but I'll have to do a bit more digging to confirm this.
[TD] Rob, maybe you could write a post about this? Perhaps a rebuttal to the myth "deep oceans can't gain heat unless surface oceans do first"?
@rocketeer, Quick calculation: 360 million km^2 is ocean surface area, times 2000m comes to 72 times 10^22 cm^3. Divide this from 20 times 10^22 Joules (since 1980). This is 0.28 Joules per gram. Divide this from heat capacity which is 4.2 Joules per g per degreeC. This gives about 1/15 degreeC. Sounds like not much, but calculate thermal expansion. For water at the average temperature this is 0.0002 per degreeC (in volume), but 0.0006 per degreeC for linear. It's linear we want since surface is constant. Multiply by 1/15 degreeC and multiply by 2000m. Result is 8cm. This is a lot!
Rocketeer@1 said: "Easy calculation if I knew the mass of the ocean." I googled 'mass of the ocean'. Hope that helps.
In this paragraph:
the part emphasised is unknown to me. Can you give more details why such sudden escalation in OHC and provide a reference?
Thanks, Chris.
I think that the point John Wise is making needs to be given some prominence in any discussion of ocean "heat". That we should not expect that heat, as such, in that location, to have any substantive effect on climate... as it corresponds to fractions of a degree over the entirety of the ocean and has no effect on the energy balance.
(We do NOT however know if the heat is in fact evenly distributed down there. I'd guess it is NOT, simply based on the fact that it is not evenly distributed on the surface, so there may be risks to Clathrate formations we do not know about)
We should include it because some accuse us of hiding that issue. When it shifts back we will see even faster rises in temperature and while it continues we are getting a continuously worse imbalance built up. As Rob points out in his response.
Just saying.... it'd be good that we make sure everyone knows we are telling the whole story.
bjchi@11,
I concur.
Changes in temperature are opposite to the changes in radiative imbalance. Deniers would love us to spell out which effect is "worse" and then label us the exaggerating "extremists and alarmists" or accuse us of "conflicting story". Such accusations are of course baseless and ignorant rhetoric & based on flawed ethics.
AFA ethics are concerned, I think radiative imbalance is bigger problem than the observed dT. That's because dT is felt directly by those who would like to delay the action to reverse AGW prompting them to reconsider their stance. While radiative imbalance is not felt and the action to reverse AGW is likely to be pushed into the future among bogus statements by deniers: "global warming has stopped in last xxx years", in an attempt to escape from the responsibility of their own actions.
Chriskoz - See the NODC data referred to in the blog post - specifically this data. I understand that the mid-range estimate for the Hiroshima bomb of 6.5x10¹³ joules is used in the Hiroshima widget. The oceans gained 2.463x10²² joules in 2013. Divide that by the Hiroshima estimate above = 378,923,076 joules. Divide by (31,536,000) seconds per year = 12.01 Hiroshima bombs per second. Near enough for our purposes.
Why the sudden escalation? Pass. However, as noted in my comment @7, three of the subtropical ocean gyres were very active during the year. The active wind-driven ocean circulation should have drawn down a lot of extra heat into the ocean via the subtropical gyres. The persistent upwelling of cold water in the eastern tropical Pacific would have reduced cloud cover there, via reduced oceanic evaporation, and thus allowed more of the sun's energy to enter the tropical ocean - this would have aided the ocean warming process, as generally the case when the tropical ocean is cooler-than-normal.
Is it correct to say that the amount of heat absorbed into the oceans since 1998 until now....is more than 4 times what it was in 1998? (ie 5 joules to 20 joules).
(Rob P - all caps removed)
@14
It'd be better to say the oceans gained about 50 ZJ (zettajoules) of heat from 1980 to 1998, then about an additional 150 ZJ of heat from 1998 to 2013.
I'll admit I had to look up the "zetta-" prefix. Big numbers.
@ Rob Painting
WRT your comment here can you provide some suggested reading? It sounds like you may be basing some of this on McPhadden & Zhang (2002) and (2004)? Is there more?
This is a particularly fascinating phenomenon and I find myself completely (ahem) at sea. Any and all pointers welcome.
BBD - I am working on a series of posts explaining the wind-driven ocean circulation, whose mean state is characterised by the sea surface temperatures evident in the Interdecadal Pacific Oscillation Index, but I'm kind of stuck on illustrating the Coriolis Effect. Hope to have that finished within a couple of weeks.
I can direct you toward scores of research papers on the subject, but I'm not sure how much sense they would make without understanding of the Coriolis force, particularly the east-west component, and Ekman pumping. The textbook; Atmosphere, Ocean and Climate Dynamics an Introductory Text by John Marshall & Alan Plumb is useful, as is the MIT GFD lab - where the 'weird properties' of rotating fluids is demonstrated in simple lab experiments.
The Zhang & McPhadden papers do indeed highlight the spin-down and then spin-up of the wind-driven ocean circulation, but one place to start is: Interaction between the Subtropical and Equatorial Ocean Circulations: The Subtropical Cell - (McCreary & Lu 1994). Typing either 'subtropical cell' or 'Pacific decadal variability' into Google Scholar will yield lots of papers on the subject.
I don’t understand how it can be said so authoritatively that the rate of ocean heating has been rapidly accelerating recently. If you look at the table of ocean heating rates at various depths as a function of time given in the posting directly below this post, it seems that from 0-700 m the rate of heating since 2004 has slowed compared to 1983-2004, and we don’t have any good data below 700m until the Argo data started flowing in (2005-2008?).
With so little data, where does the confidence of the heating acceleration claim come from?
tcflood - See these SkS posts:
1. New Research Confirms Global Warming Has Accelerated
2. Warming oceans consistent with rising sea level & global energy imbalance
The acceleration in ocean warming is matched by an acceleration in sea level rise, even when taking into account the increased loss of land-based ice over the recent decade. The trend is complicated though, with slowing in heat uptake after about 2005 - as can be seen in the Hiroshima widget.
Of course, the amusing part is that the fake-skeptics were proclaiming the ocean heat content data were the greatest thing since sliced bread about 4-5 years ago. That probably stemmed from the fact that only the upper 700 metre layer data was available, and that seemed to show ocean cooling - in contradiction to our understanding of Earth's energy imbalance. Of course we now know that much of the heat from above 700 metres was being pumped down into deeper layers below (Ekman pumping), and that the Earth was indeed still warming.
With the addition of 4-5 years more data the fake-skeptics are now proclaiming we don't have enough data. This is only because they don't like the implications, and simply demonstrates their pseudo-scientific approach to the issue.
Thanks Rob. I'll read the two posts you reference.
Rob Painting
Thanks for this and I very much look forward to your forthcoming series of posts on this topic. It seems little known and ripe for a wider audience.
I did some sample numbers for a "cool skin" post comment 18 October 2011 by Rob Painting but since there's some OHC numbers questions & answers here, I'm using it as an excuse to re-post my thoughts.
Minnett & Kaiser-Weiss GHRSST 12-Jan-2012 has a graph of ocean skin temperature variation. Here are my sample or average global ocean numbers, derived backwards to give the Sun's 161 w/m**2 exiting but nonetheless illustrative and legitimate as nearly as matters (because I trust the competency of ORAS4).
temperature:
1,000m depth temperature = 5C
thermal conductivity of seawater 0.58 W/mK
ocean-air interface = 17.000C
1.441mm depth temperature = 17.400C (the warmest spot in the ocean depth though the "few metres" of depth below it is only a miniscule bit colder, all warmed by Sun SWR)
this top 1.441mm depth is the "skin" and "sub-skin"
100m depth temperature certain in range 16.090C to 17.400C but virtually certain >17C because of mixing top ~90m
temperature gradient of top 1.441mm of ocean is 277.6 Celsius/metre
By conductivity, temperature gradient pushes 161.00 w/m**2 up from 1.441mm depth to ocean-air interface which precisely removes the Sun's 161 w/m**2 going into the top few metres depth and leads to no ocean warming.
AGW increases downward LWR and air temperature directly above ocean with extreme rapidity of a few decades, which warms ocean-air interface by 0.700C, so:
ocean-air interface = 17.700C
1.441mm depth temperature = 18.097C
temperature gradient of top 1.441mm of ocean is 275.5 Celsius/metre
By conductivity, temperature gradient pushes 159.79 w/m**2 up from 1.441mm depth to ocean-air interface which leaves 1.21 w/m**2 of the Sun's 161 w/m**2 going down into the ocean below and leads to ocean warming of 13.8 ZettaJoules / year (the billions of atomic bombs in sks widget). So, the difference of 0.003C in the warming over the top 1.441mm of ocean causes ocean warming that is 7.5 times as fast as the average post-glaciation ocean heat gain that moved the ecosphere from an ice age with glaciers down to New York State and today's climate and ecosphere warming that is 4.5 times as fast including all the "ice-age" glacier melt that happened.
If the 1.441mm depth had warmed by 0.700C same as the ocean-air interface then oceans would gain no heat, but the massive colder oceans below will only let 1.441mm to <several tens-to-hundreds of metres> depth warm by 0.697C and only when the entire ocean has warmed by 0.700C in a few thousand years will it let that 1.441mm depth warm the final 0.003C and stop heat gain with 4,100 ZettaJoules of heat having been added to the oceans, enough to melt 13,666,666 cubic kilometres of ice. Of course, that will never happen because the ocean-air interface is going to keep warming with the +CO2 that will keep happening and it's all going to accelerate.
Temperature gradient from 1.441mm (18.097C) to 1,000m (5C) depth is 0.01310 Celsius/metre
By conductivity, temperature gradient pushes 0.0076 w/m**2 down from 1.441mm depth to 1,000m depth.
This is only 0.6% of the actual heat transport of 1.21 w/m**2 because 99.4% is transported down by water circulation, mostly natural with shark & whales & krill helping a bit.
Year 2013: surface skin has wamed a tiny fraction of 1C (not shown for comparison simplicity) and ocean mixing will not permit it to balance within 0.003C at the sub-skin (maybe also ocean happens to mix heat down a tad faster due to a natural variation), now will only let 1.441mm to <several tens-to-hundreds of metres> depth warm by 0.69462C instead of prior 0.697C (ocean-air interface at 0.70000C). Repeat above computation gives 158.834 w/m**2 up from 1.441mm depth to ocean-air interface which leaves 2.166 w/m**2 of the Sun's 161 w/m**2 going down into the ocean, giving increased warming rate of 24.65 ZettaJoules / year.
Values such as 0.70000C are not known with this precision but precision is irrelevant because it is the residual of the 0.7C anomaly (computed here as 0.003C per 1.441mm of near-surface depth for 2000-2010, 0.00538C for 2013) that is adding the ocean heat, so if actual at ocean-air interface were, say, 0.726C then it must be 0.723C at 1.441mm depth to reduce upward flux by 1.21 w/m**2 and cause the measured +138 ZettaJoules / decade. It's illustrative, you have to modify with the best data you can find.
In a weird way, isn't the fact that deep oceans are warming actually (slightly) good news? Let me explain.
As I understand it, there are (simply put) fast feedbacks and slow feedbacks. The conventional wisdom is that in the time since the industrial era, only the fast feedbacks have been operating (surface ocean, lapse rate, sea ice, snow, water vapor, biosphere). Our rate of CO2 increase has been outstripping their ability to absorb CO2.
Slow feedbacks including the deep ocean, are meant to cut in only after a number of centuries to millennia.
If we have evidence that the deep ocean is coming "into play" NOW, that implies surface-deep heat exchange and therefore, presumably, gas exchange. If so, even though we keep building heat in the planetary system (bad news I get it) from a surface point of view, might this buy a few more decades to get emissions down (assuming actual political & business action)?
By bringing the deep ocean into play, it's like turning on a bigger AC - with observed changes to surface global temps in recent years.
Against this idea is the fact that CO2 has continued to rise without any apparent inflection, but then we are cranking it out at such a rate that's not really surprising.
I don't see how we can get heat into the deep oceans without also getting CO2 into the deep oceans.
I'm not an oceanographer but it would seem important to understand the physical location(s) geographically of this extra heat and if its associated with a current, when will that current return those extra joules to the surface? That would be a bad year. If the deep currents are slow we may have a couple of extra decades before then, unless thermal instability disrupts those currents...
howardlee - "I don't see how we can get heat into the deep oceans without also getting CO2 into the deep oceans."
When the wind-driven ocean circulation is intense, such as during the negative phase of the IPO & La Nina, there is strong upwelling of cold deep water along the equator, and along the eastern coasts of the continents. This is known as Ekman suction. This cold deep water is high in dissolved CO2, and therefore there is a large flux of carbon dioxide to the atmosphere from the ocean. During the positive phase of the IPO, and during El Nino, the circulation winds down. This shuts down the upwelling and flux of CO2 to the atmosphere.
Contrary to your assertion, there is a greater uptake of CO2 into the global oceans during the positive phase of the IPO & El Nino. Note the graph below from Keeling (1995) - taken from the SkS rebuttal on Murry Salby & CO2. The bottom figure (b) is the oceanic exchange of carbon and the blue colour denotes La Nina periods. Note how the oceanic flux is negative - indicating loss of carbon from the ocean.
Of course the oceans are storing more CO2 over the long-term - this is why the oceans are acidifying at most likely the fastest rate (outside of an asteroid impact) in the last 300 million years. I'm just pointing out some of the complexity.
As for strong subsurface ocean storage giving more time for humans their act together, that really depends how much longer this (cool surface) phase of the circulation lasts. The recent unprecedented intensification of the trade winds may simply be shortening the length of the cycle - meaning that this negative phase may be much shorter than the previous one. We shall see.
Rob - that's helpful, thanks. I read the Keeling et al 1995 paper. It's probing the causes of variations in the Mauna Loa record, so it's really not getting to the issue of deep ocean storage as far as I can tell.
I'm really taking the longer view of this. As you say, in the long term the ocean is storing more (via acidification). Per the work of Zeebe and others, the amount and rate of CO2 absorbtion on a global scale depends, in the long term, on the feedbacks (fast, slow) that come into play.
I see very strong parallels with past global warming events and mass extinctions (Permian, Triassic, Toarcian, Cretaceous OAEs, PETM et al). They have all been associated with huge carbon emissions, from Large Igneous Provinces (Some debate on that regarding PETM). We are releasing comparable quantities of carbon at rates that exceed LIP rates (but increasingly the timeframes of those seem to be being revised shorter...).
Basically per the work of Zeebe and others, the idea is that in those times (and today) the rates of CO2 emissions, and temperature increases, overwhelmed the short term feedbacks (biosphere, surface ocean etc), before the long term feedbacks (deep ocean, weathering, etc) could cut in to process them. Hence CO2 ramped up ever faster in the atmosphere, further accelerating warming, until you have the same symptoms of a global-warming-mass-extinction like the end Triassic or even Permian (ocean acidification, jump in global temperatures, ocean anoxia,etc). There's evidence that immediately following the Permian emissions, it was lethally hot on land and in the oceans in equatorial to tropical regions for the very early Triassic.
That's why I'm wondering if the deep ocean is cutting in already as a feedback - absorbing both CO2 and temperature on a long-term net basis rather than on a multidiecadal oscillatory basis. The deep ocean in the latest IPCC report and in the work of many others including Zeebe, is not supposed to cut in until several centuries have passed. If it's really cutting in now, after a century or two, it would bring a much larger reservoir for CO2 and heat into the equation. I'm not for a moment suggesting this makes global warming go away, only it might slow the rate of change down - a bit - in the short term (perhaps the average transit time of deep currents). BUT ONLY IF the deep ocean reservoir is currently in active CO2 exchange with the atmosphere at meaningful rates.
Yes, it is a shame that the total amount of ocean energy increased by 0.001% since 1998. But what exactly does that mean when we're still emerging from the Little Ice Age?
[PS] % is meaningless. You can discuss little ice age here.
Concerned citizen 60025- we are not still emerging from the last ice age.
The ice ages were contolled by orbital wobbles - Milankovitch cycles. They happen at a very well understood cyclicity. They predict we should be heading into the next ice age, which should cut-in by the year 3,500 AD.
Temperature records up to the industrial age show exactly that pattern - a slow decline since about 6,000 years ago. But all that cooling has been reversed in the last century or two. We have emphatically departed from the Milankovitch cycle of the ice ages and reversed 6000 years of cooling in a time period far, far shorter than the wavelength of orbital wobbles.
Well,Rob called it a year ago.
NOAA just changed the scale of their graph (select panel 2). It is now -10 - +25. That should last for another 4 years. Then it will need to be 30, then 35, 40, 45 .... you get the picture.