


 Arguments


Warming oceans consistent with rising sea level & global energy imbalance
Posted on 29 January 2014 by dana1981, Rob Painting, Kevin Trenberth
- The ocean is quickly accumulating heat and is doing so at an increased rate at depth during the so-called “hiatus” – a period over the last 16 years during which average global surface temperatures have risen at a slower rate than previous years.
- This continued accumulation of heat is apparent in ocean temperature observations, as well as reanalysis and modeling experiments, and is now supported by up-to-date assessments of Earth's energy imbalance.
- Another key piece of evidence is rising global sea level. The expansion of the oceans (as they warm) has contributed to 35–40% of sea level rise over the last two decades - providing independent corroboration of the increase in ocean temperatures.
The Deep Ocean Layers are Quickly Accumulating Heat
Recently there have been some widespread misconceptions about heat accumulation in the oceans, particularly in the deeper layers below 700 meters. Balmaseda et al. (2013) was a key study on this subject, using ocean heat content data from the European Centre for Medium-Range Weather Forecasts' Ocean Reanalysis System 4 (ORAS4). A ‘reanalysis’ is a climate or weather model simulation of the past that incorporates data from historical observations. In the case of ORAS4, this includes ocean temperature measurements from bathythermographs and the Argo buoys, and other types of data like sea surface height and surface temperatures. Their study concluded that heat has increased in the deep oceans at an unprecedented rate in recent years, with approximately 30 percent being sequestered below 700 meters since the year 2000.
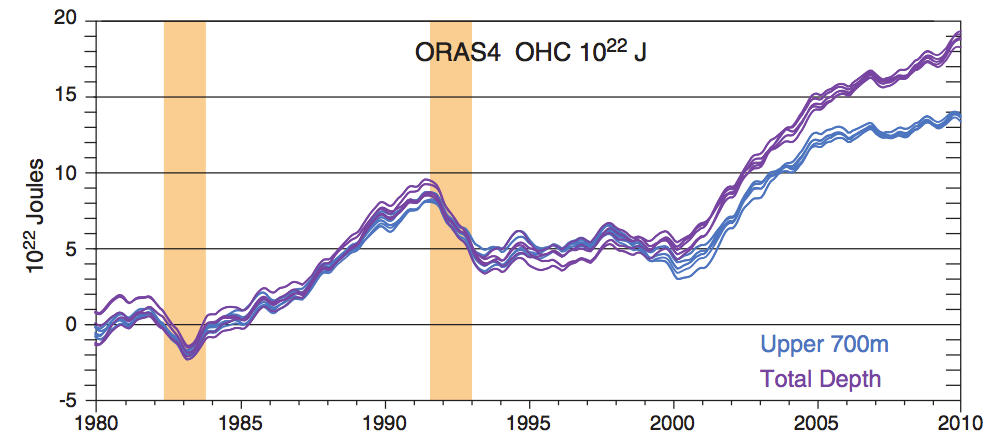
The five ensemble members of the ORAS4 ocean reanalysis OHC for 0–700m and full-depth ocean are shown, where they have been aligned for 1980 to 1985, in 1022 J. The increased heating below 700m of about 0.2 W/m2 globally is revealed after about 2000. The orange bars show the times of the El Chichón and Pinatubo volcanic eruptions. From Trenberth & Fasullo (2013).
The increase in deep ocean heat content is also a robust result in data sets that do not include reanalysis. For example, as discussed in Nuccitelli et al. (2012), the ocean heat content data set compiled by a National Oceanographic Data Center (NODC) team led by Sydney Levitus shows that over the past decade, approximately 30 percent of ocean heat absorption has occurred in the deeper ocean layers, consistent with the results of Balmaseda et al. (2013).
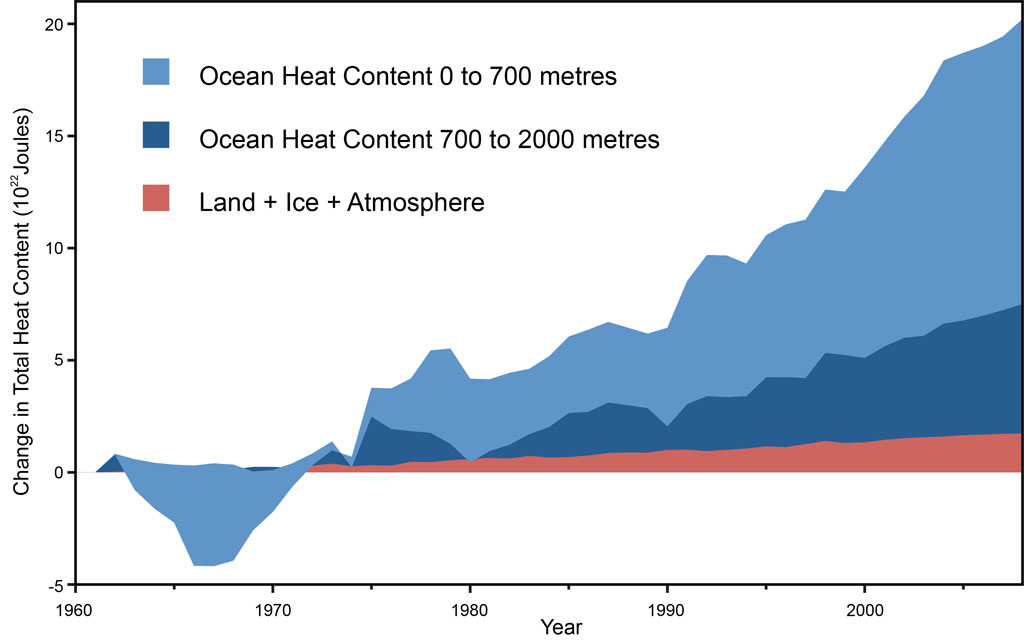
Land, atmosphere, and ice heating (red), 0-700 meter OHC increase (light blue), 700-2,000 meter OHC increase (dark blue). From Nuccitelli et al. (2012)
Similarly, a new paper by Lyman & Johnson (2013) concludes,
"In recent years, from 2004 to 2011, while the upper ocean is not warming, the ocean continues to absorb heat at depth (e.g., Levitus et al. 2012; von Schuckman and Le Traon 2011), here estimated at a rate of 0.56 W m-2 when integrating over 0–1800 m."
The paper also includes this useful table illustrating that according to observational data, ocean heat content has indeed accumulated rapidly in the deep oceans in recent years. Of the heat accumulating in the upper 1,800 meters of oceans for 2004–2011, 46 percent was sequestered in the deep oceans (below 700 meters) in the Lyman & Johnson data set.
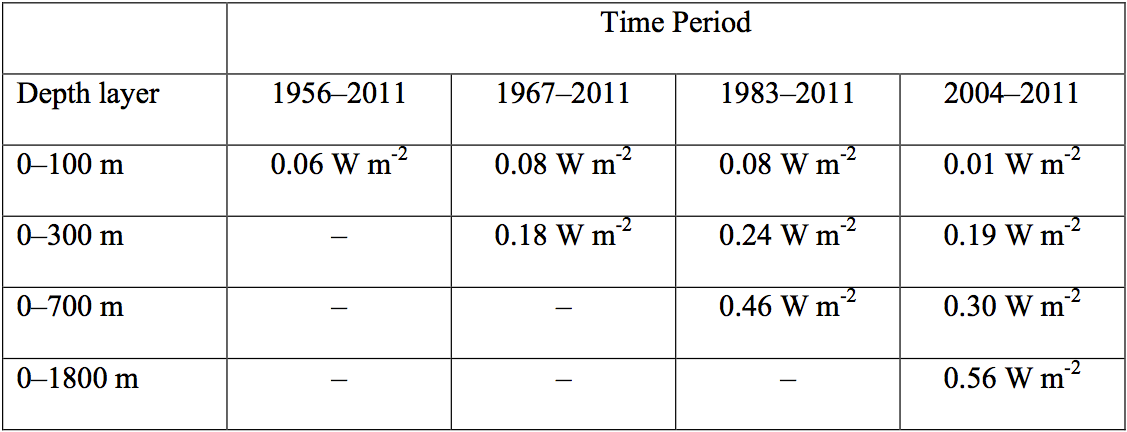
For 2004–2011, they find the oceans accumulating 0.56 W/m2 (9x10²¹ J/yr) in the upper 1,800 meters – equivalent to 4.5 Hiroshima atomic bomb detonations per second – during a time when many have argued that global warming has magically 'paused'.
There are some differences among these studies, although all agree that the deep ocean is taking up more heat recently. The differences arise from how gaps in observations are filled in time and space, and the reanalyses do this most comprehensively by utilizing all kinds of data as well as using ocean models to span gaps.
Ocean Heat Accumulation Consistent with Other Observations
We also know from satellite observations that the planet is accumulating heat owing to a global energy imbalance. A new paper by Trenberth et al. (2014) notes that the amount of heat accumulating in the global climate (most of which is absorbed by the oceans) is generally consistent with the observed global energy imbalance.
Due to the increased greenhouse effect 'trapping' more heat, there's more incoming than outgoing energy at the top of the Earth's atmosphere. That energy has to go somewhere. With over 90 percent being absorbed by the oceans, we fully expect the oceans to do exactly what they're doing – accumulate a whole lot of energy. What's more, continually increasing greenhouse gases increase the imbalance by about 0.3 W/m2 per decade even as the planet warms and radiates some extra heat back to space. If global warming were to 'pause', it would require an explanation of where the energy from the global imbalance is going.
There's also the issue of sea level rise, whose main contributors are melting glaciers and ice sheets, and thermal expansion (water expanding as it warms). Climate scientists have been able to close the sea level 'budget' by accounting for the various factors that are causing average global sea levels to rise at the measured rate of about 3.2 millimeters per year since 1992 (when altimeters were launched into space to truly measure global sea level). The warming oceans account for about 35–40% of that rate of sea level rise over the past two decades, according to the IPCC AR5. If the oceans weren't continuing to accumulate heat, sea levels would not be rising nearly as fast.
The Pause is Fictional; Ocean Warming is Factual
The bottom line is that all available information related to ocean heat content shows that the oceans and global climate continue to build up heat at a rapid pace, consistent with the global energy imbalance observed by satellites and the rate of global sea level rise. In recent years, about one-third of that heat has accumulated in the deep oceans.
While the rate of increase of global surface temperatures in recent years has slowed in large part due to the more efficient heat transfer to the deep oceans, that can't last forever. A key reason is that sea level rise occurs unevenly, and in some places, such as near the Philippines, sea level has risen over 20 cm since 1992, while in other places it has fallen slightly. In particular, the slope of the ocean surface across the Pacific has increased by 20 cm, and the water wants to slosh back but is prevented by stronger easterly trade winds. The resulting changes in ocean currents are part of the reason why more heat has gone deeper.
When that trend reverses, as past observations suggest it will (likely within the next decade, according to Trenberth & Fasullo [2013]) we'll experience an acceleration of warming at the Earth's surface.


OHC trend was also relatively strong between 1969 - 1979, similar to the period since 2000.
For both periods HadCRUt4 shows flattish surface trends.
It's just two periods, but the cursory implication is that warming slows or stops at the surface for periods that OHC rises quickly. Is there a long-term correlation, and does anyone know of published literature on this?
barry@1,
If you think about the fact that OHC trend is responsible for over 90% of warming due to TOA imbalance, you may reasonably expect the surface T changes (where only 3% of that imbalance energy goes) will not be very well correlated. It's hard to establish precise correlation from when other factors (volcanoe aerosols, sun's variability) are coming into play and influence TOA balance.
However your remark:
can be interpreted as an indication of LaNina conditions (ENSO minus zero) that may have prevailed during your periods. You would have to consider other effects (volcanoes & sun variability) to establish your correlation.
Trenberth et al. (2014) cited in the article is an excelent analysis of OHC/ENSO and TOA imbalance that may help you.
I think this general analysis is right on target and the "pause" in the accumulation of energy in the Earth climate system is indeed an illusion. Tropospheric sensible heat is a poor proxy for measuring the energy gain in the Earth system. It is only a partially good proxy over the longest time frames. The Earth climate system continues to gain energy from the geologically rapid build up of GH gases caused by human activity.
Having said all this however, let me correct what I think is a basic thermodynamic error that many make when saying the "heat is going into the oceans" from anthropogenic global warming. By a very very big margin, the net flow of latent and sensible heat is from ocean to atmosphere on a global basis. The atmosphere simply does not heat the ocean-- quite the opposite. What increasing GH gases do is alter the rate of energy flow from ocean to atmosphere to space. The oceans gain energy because this flow is reduced. Much of this addition energy in the ocean is advected to the poles (especially the north pole, due to the hemispheric energy flux differences). Thus we see much if the sea ice decline actually occuring from ice being melted from the bottom From warmer water. Thus, a slightly warmer atmosphere acts like a control knob to create a much warmer ocean and even faster warming polar region.
barry @1
Actually from your graph, 0-700 and 0-2000 OHC seems to have moved in lock-step from 57 - 83 with a blip around 75. Implying no long term heating in 700-2000. Then from 83-86 0-2000 rose faster implying heating in 700-2000. Then from 86 to 94 0-2000 matched 0-100 so no warming od 700-2000. Then from 94 onwards 700-2000 started warming continuously.
Perhaps 700-2000 actually started warming around 83 onwards with something suspending that from 86 to 94.
And what could cause these sorts of fluctuations? Winds. Increased winds in the tropics and mid latitudes can 'spin up' the mid-ocean gyres, increasing the rate at which water gets pumped down to mid depths through Ekman pumping, taking heat from the surface with it.
Submarine volcanic eruptions have always been an episodic natural contributor to ocean warming. For example the El Hierro submarine volcanic eruption in the Canary Archipelago, off the northwest African coast from October 2011 to March 2012.
How can we distinguish between ocean warming due to natural and anthropogenic causes? - or have we entirely overlooked the role of submarine volcanic eruptions.
wwsyim - the global oceans are warming from the top down. There are many other lines of evidence, but this alone precludes submarine volcanoes as a culprit.
wwsyim@5,
No, we haven't "overlooked" the role of submarine volcanic eruptions.
The 'heat' of underwater volcanic eruptions you're presumably refering to, is part of earth's geothermal etnergy. The total geothermal energy was mesured as 0.1W/m2, which is much less than current toa imbalance. You can read about it, e.g. here:
Out of that 0.1W/m2, volcanoes are only a part. Your volcanoes (underrwater) are still ~3/4 of total volcanoes on the globe. So I can confidently say that the heat of your volcanoes is at least 10 times smaller than the heat retained due to TOA imbalance. To have a little bit of understanding about the enormity of TOA imbalance, you can read further therin:
Any of your volcanoes would be able to do it? It would be an enormous volcano that no one has seen yet... Of course, one can find & claim that that some specific eruption warmed ocean water by several degrees and caused change of currents and that may have even contributed to the reversal of ENSO oscillations. But it's going to be only local and minor event. Globally, the biggest factor is imbalance due to GHG.
The "natural" CO2 emissions from all volcanoes are 100times smaller than human emissions, as you can read here. So the volcanic CO2 is also a minor factor.
chris & Glenn,
While ENSO maybe the primary factor in ocean/atmosphere heat flux, it is not the only mechanism. Trenberth's paper is trying to resolve the energy budget on interannual scale, but I am interested in decadal trends. (I'm not sure if the paper says that they are better resolved or not) There has been much discussion attributing the 'pause' in surface temps since the turn of the millenium to accelerated uptake of energy in the oceans. This would seem to be corroborated in the OHC data since the turn of the millenium. So I looked further back to see if that kind of correlation was evident, using OHC as the pacemaker.
For periods when there was a clear linear trend change in OHC (0-700 & 0-2000), there seems to be an inverse correlation with surface temperatures. I added a few more trend lines to surface data here.
The first 2 trendlines are sub-decadal and should be ignored (although they fit my hypothesis) , but the following 3 are decadal periods with distinct trends. ENSO is not factored because it is a component of total OHC.
The three decadal surface temp trends behave as I imagine for periods when OHC rises quickly or is flattish. OHC has a steep warming trend 1969 - 1979 (incl), has a much lower trend 1980 - 1990, and a steep trend again 2000 - 2014. Surface trend for those periods are, inversely, flattish, steeply warming, and flattish again. IIRC, long-term volcanic forcing is negligible, and solar influence is not a major factor (15% on decadal time scales according to Trenberth). I didn't attempt to run a trend for 1990 - 2000, as OHC trend for that period was hard to read.
I don't know if there may be something to accounting for surface/ocean trends on decadal scales, but I was interested in the possibility in light of the recent 'haiatus' in surface temperatures. From Trenberth's paper:
Consistent with prevailing theories on the 'pause'?
In order for subaerial volcanoes to warm the ocean, they would have to be erupting on orders of magnitude larger than observed. This also would be affecting the acidification of the ocean, which we know is derived from human FF usages. Per Gerlach 2011:
"To create more than 35 gigatons per year of volcanic CO2 would require that magma across the globe be produced in amounts exceeding 850 cubic kilometers per year, even for magma hypothetically containing 1.5-weight-percent CO2. It is implausible that this much magma production—more than 40 times the annual midocean ridge magma supply—is going unnoticed, on land or beneath the sea. Besides, the release of more than 35 gigatons per year of volcanic CO2 into the ocean would overwhelm the observed acid-buffering capacity of seawater and contradict seawater’s role as a major sink for atmospheric CO2 [Walker, 1983; Khatiwala et al., 2009]. In short, the belief that volcanic CO2exceeds anthropogenic CO2 implies either unbelievable volumes of magma production or unbelievable concentrations of magmatic CO2. These dilemmas and their related problematic implications corroborate the observational evidence that volcanoes emit far less CO2 than human activities.
It is informative to calculate volcanic analogs that elucidate the size of humanity’s carbon footprint by scaling up volcanism to the hypothetical intensity required to generate CO2 emissions at anthropogenic levels. For example, using the 2010 ACM factor of 135 (Figure 1) to scale up features of present-day volcanism, Kilauea volcano scales up to the equivalent of 135 Kilauea volcanoes; scaling up all active subaerial volcanoes evokes a landscape with the equivalent of about 9500 active present-day volcanoes [Siebert et al., 2010]. Similarly, the seafloor mid-ocean ridge system scales up to the equivalent of 135 such systems. Of particular interest, though, is the roughly 4 cubic kilometers per year of current global volcanic magma production [Crisp, 1984], which would scale up to about 540 cubic kilometers per year. This significantly exceeds the estimated average magma output rates of continental flood basalt volcanism [Self, 2010], which range from about 10 to 100 cubic kilometers per year. Thus, annual anthropogenic CO2 emissions may already exceed the annual CO2 emissions of several continental flood basalt eruptions, consistent with the findings of Self et al. [2005]."
http://www.agu.org/pubs/pdf/2011EO240001.pdf
It's not subaerial volcanoes.
(emphasis added)
I am reminded of how often Pielke Sr. would dismiss surface air temperatures as a poor metric for global warming, in favor of OHC. His blog now long closed, Is he commenting or contributing elsewhere regarding the warming ocean? The last I've seen of him was in praise of Bob Tisdale who, I have to admit, sometimes give me pause and along with Judith Curry are pretty much my only remaining sources for "balance." (My impression is that Curry's recent Congressional statement regarding sea level rise is probably inaccuarate and dismissible but I don't think she addressed OHC specifically).
Barry @ 8 - " Consistent with prevailing theories on the 'pause' slower rate of surface warming?"
Yup. See old SkS posts:
1. The Deep Ocean Warms When Global Surface Temperatures Stall
2. Ocean Heat Poised To Come Back And Haunt Us?
3. A Looming Climate Shift: Will Ocean Heat Come Back to Haunt us?
The stronger mixing of heat into the deep ocean during the negative (cool) phase of the Interdecadal Pacific Oscillation (IPO) would seem to be the primary suspect for the slower rate of surface warming, but light-blocking aerosols (around 20% according to one estimate) and a cooler than normal sun are also factors.
Presumably this heat in the oceans will make itself felt when, for instance, we have an El Nino. The inertia of the system implies momentum (actually the same thing in physics) and suggests that even if we ceased to warm the oceans, the effects of the warmer ocean will persis long after. Of course, even if we ceased to put carbon in the atmosphere tomorrow, the warming would continue until the various carbon sinks had time to reduce atmospheric carbon so we can't even stop the warming of the oceans if we wanted to. We truly are leaving a mess for our children.
I would like to know by what percentage the oceans are warming. Does anyone know the answer?
As a percentage change in temperature for entire ocean, it is small - because you need gigantic amounts of energy to shift the temperature of 1.3 billion cubic kilometres by 1 degree. 5.4E23J by my calculation, and change since 1970 has be 2E23J so I guess a bit under 0.4C. Still average ocean temp is 4C so that is 9%. More than I would have thought so perhaps someone should check my calculation. But so what? The measured change tells us what the energy imbalance for the earth is. Percentage change isnt a particularly useful indicator of hazard. Try increasing the percentage of cyanide gas around you by 0.027% for instance.
scaddenp@14,
You'r off (exaggerated) by factor of 10.
1.3 billion cubic kilometres = 1.3E9 * 1E9 m3 = 1.3E9 * 1E9 *1E6 cm3
1cm3 takes 4.19J per 1K => total ocean heat content per 1K is: 1.3E9 * 1E9 *1E6 * 4.19 = 5.45E24J. So, according to this calculation dT of ocean would be 0.04K on average. However because we don't measure ocean heat content below 2000m (about half of the total volume), the OHC you cite applies to the top half volume only, so the average dT in this part of volume is just under 0.1K (0.08) consistent with the estimates.
However your statement:
does not make sense both logistically and technically. Where did you take that "9%" from? I guess from the diference between ocean heat content over freezing point as opposed to the OHC change since 1970? Saltwater freezing point is about -2C rather than zero, so in that case you miscalculated your "9%". In any case such number does not make any sense in context of Earth energy imbalance topic at hand.
Your number sounds more reasonable. Miscounted a zero somewhere.
The 9% is temperature. Increase of .37 on average temp of 3.9C. So make that 0.9% which sounds much more reasonable.
"What's more, continually increasing greenhouse gases increase the imbalance by about 0.3 W/m2 per decade even as the planet warms and radiates some extra heat back to space."
I don't get this at all. It seems prima facie false. I would have thought that it is, on the contrary, *only* if surface temperature does *not* increase at all that the imbalance will keep increasing in exact proportion to the increase in external forcing (isn't it the anthropogenic forcing change, and not the rate of increase of the imbalance, which precisely is 0.3 W/m^2/decade?).
When the surface temperature is allowed to keep up, in accordance to the transient climate sensitivity to the forcing change (i.e. TCR * delta_forcing(t)), then the imbalance should remain constant since the Planck response balances out the forcing increase. The existence of the sustained imbalance, averaged over a couple decades, is mainly a result of slow ocean diffusivity, and the steadily increasing forcing, while it (the imbalance) fluctuates around this average value as a result of internal variability (ENSO etc.)
Pierre-Normand @17. If the amount of energy received by the Earth from the Sun exceeds the amount the Earth radiates into space, then the only thing the Earth can do is increase its temperature, which in turn will increase the amount of radiation into space. This process will continue until these two energy fluxes are equal. In that time to reach a new equilibrium the amount of energy "stored" in the planet will increase, raising the temperature of the Earth.
Thus the rise of temperature of the surface (and all other portions of the planet) is caused by the global energy imbalance.
Phil, you seem to be agreeing with all I said. This increase in surface radiation into space is proportional to what I called the "Planck response". If the anthropogenic forcing wouldn't keep increasing anymore (because we would manage to suddenly reduce CO2 emission to a level that merely compensates upkeep by sinks, somehow, and the atmospheric concentration would remain constant) then surface temperature would slowly rise until the TOA balance is restored (and then rise some more as slow feedbacks kick in). If, however, we just keep increasing the forcing, as we currently do, then the surface warming strives to restore the balance but can't keep up with the constantly increasing forcing (mainly because oceans are slow to warm) and the TOA imbalance is maintained. But it is not *increasing* by 0.3W/m^2 per decade as the article states. This would only occur if the surface did *not* warm, or warmed very little. Then there would be no Planck response and the imbalance would grow at a rate equal to the rate of forcing increase.
Pierre Normand and Phil, an decadal increase of 0.3 W/m^2 is equivalent to a 5.8% per decade, or a 0.57% per annum increase in CO2, ignoring other anthropogenic factors. That is low relative to the current emissions rate, but possibly a reasonable estimate once all anthropogenic emissions are included.
Assume a equilibrium climate sensitivity for doubling CO2 of 3 degrees, and a transient climate response of 2 degrees. That means for each 1 degree increase in temperature, there is a 1.23 increase in OLR. Further assume that the forcing increases by 0.3 W/m^2 per decade. From the transient climate response, it follows that temperatures increase by 0.16 C per decade on average, and hence the upward LWR from the increase in temperature increases by 0.2 W/m^2. In this scenario, therefore, the energy imbalance increases by 0.1 W/m^2 per decade. Thus, contrary to Pierre Normand, a constant, linearly increase in forcing will result in a an average increase in the energy imbalance, decade by decade. The increase, however, is much smaller than the increase in forcing. It is about a third of the increase in forcing on the assumptions used above, but will vary with different assumptions.
Given this, it is likely that the 0.3 W/m^2 figure quoted in the article is a mistake, but it is possible that expected increase in forcing is greater than 0.3 W/m^2 per decade; and also that different assumptions were used in the calculation, resulting in a much higher relative increase in energy imbalance for a given increase in forcing. It would be good if Rob Painting or Keven Trenberth could clarrify.
Pierre Normandy, yes sorry. I misread your original compliant. Thanks to Tom @20 for attempting some quantitative analysis. My only contribution is qualatative; it is, of course, possible for the imbalance to increase - the rate of CO2 emission has to exceed the planets response. Tom calculation suggests that it does, but not as much as the figure quoted. I had assumed that this was a measured quantity, it would be interesting to know !
I believe that the 0.3W/m2 figure is for the sum of imbalance from 1750, the most commonly used IPCC baseline - the accumulated anthropogenic emissions forcing. Warming over the last 150 years has certainly cancelled out some of that imbalance, but it's not unreasonable to look at totals rather than year to year values when discussing GHG forcing.
[Source]
KR,
Your graph is very useful for the discussion. I read the total forcing as 1.6 W/m2, not as 0.3 W/m2. Look at the brick red bar labeled "total net anthropogenic" and the graph at the bottom. That appears to be the total forcing since 1750. Where do you see 0.3 as the final number?
michael sweet - 0.3 W/m2 per decade, as stated in the opening post, is the current rate of increase in that anthropogenic forcing value.
KR,
I had lost track of the discussion above.
The author notes that … “warming oceans account for about 35–40% of that rate of sea level rise over the past two decades, according to the IPCC AR5”.
I have long found it difficult to believe that thermal expansion of seawater is responsible for 40% of SLR. Recent research reports that melting ice sheets and mountain glaciers are about three times larger than steric influences on SLR.
That conclusion seems much closer to reality but may be unwelcome in some circles since the implication is that, if true and with SLR now at 3.4mm/annum, loss of land-based ice must be considerably greater than hitherto reported.
Tom@20,
In your estimate you first assume:
then, by deducting TCR of 2/3 of assumed forcing, to obtain TOA imbalnce increase, you conclude:
That conclusion came up as the result of your assumption, which is just your assumption not supported by any data. The quoted figure most likely comes from different assumption so I don't understand by what logic you can call it a "mistake".
Myself, I'm proposing a different method to verify the quoted figure.
Looking at Trenberth et al. (2014) fig. 1, it'd be nice to paste it here but I dunno how :( , which shows he net TOA radiation (down) from CCSM4, I eyball that from 1960 to 2000 (4 decades), the imbalance grew from 0 to about 0.7W/m2, which is roughly 0.17 per decade.
At the same time, the mean growth reate of CO2 from NOAA increased from just under 1ppm/y to 2ppm/y. Current growth (2010+) is 2.5ppm/y. So, assuming CO2 is the only long term forcing agent here, we can say that the forcing is growing almost twice as fast (2.5ppm) as it used to in 1960-2000 on average (1.5ppm). Given that quoted figure (0.30) and my figure (0.17) eyeballed from Trenberth et al. (2014) fig. 1, are roughly in the ame proportion (almost twice as fast), I conclude that quoted figure (0.30) is correct. Obviously, my method (likewise yours) ignores other long term forcings - specifically CFC emissions that stopped in late 80s + human aerosols seems to be important players here - inclusion of other forcings may change the result.
scaddenp@16,
Celsjus scale is interval scale only. It is not ratio-scale because it does not have meaningful zero point, al least in relation to saltwater temperature, therefore you cannot use it to calculate a ratio.
So you cannot answer the question "by what percentage the oceans are warming" with "0.9%". There is no answer to this question because the question is ambiguous: it does not specify the relation with respect to what the "warming percentage" is sought.
If the question specified, e.g. relation to the molecular kinetic energy, then Kelvin scale (which has meaningful zero point in this case) would have been appropriate to calculate the ratio.
Read more for example here (Quantitative data).
KR@22,
For your method of verifying the TOA imbalance changes, it's better to check the newer graph from AR5:
(yeah, I finally learned how to insert imgs!)
where you can see the A forcing increased in last 3 decades (1980-2011) by about 1W/m2 (2.29 - 1.25 = 1.04 is exact central estimate).
The increase in global surface temperature (land + ocean) for that period can be seen for example from NOAA. I estimate dT increased from 1980 to 2010 by about 0.4K. Given equilibrium climate sensitivity of 0.75K/Wm2, the amount of forcing neutralised by said dT is; 0.4*0.75 = 0.3W/m2.
Therfore, out of 1W/m2 forcing in last 3 decades reported by IPCC above, 0.7W/m2 was not neutralised by dT and stays as radiative imalance increase. That yield about 0.23W/m2/decade which is slightly lower than quoted figure (0.30) because we just calculated an average of last 3 decades. 0.30, as the boundary value of current, increasing forcing, seems consistent with our result.
I think if it's handy to have a faux-factor for ocean heat gain %age then it's either from sea water melt/freeze temperature or the average ocean temperature during previous glaciation. Former makes sense because we live in a water-world and there's a big rift in the aspects of liquid vs solid water that's pertinent to us. Latter has some rationale. A species living on a liquid-cheese planet will think we're incompetent and don't know Absolute Zero, but that's their problem.
I'm ammending my post @29 because I've just noticed I made an arithmetic mistake therein.
The amount of forcing neutralised by dT in 3 decades of 1980-2010, should be calculated as 0.4/0.75 = 0.53W/m2. Therefore, the imbalance remaining from IPCC forcing of 1W/m2 is 0.47W/m2 which yields imbalance increase of 0.18W/m2/decade, not 0.23 as I erroneously reported @22.
That correction softens my original conclusion (that 0.30 is indeed the latest imbalance trend) but does not negate it: it is still possible that an average trend of 0.18 over 3 decades may be aproaching an external value of 0.30 at present.
chriskoz:
1) My post was primarily to illustrate that a growing energy imbalance is consistent with, and indeed required (on average) with a constantly growing forcing. Pluging realistic figures into the equations, however, reveals a probable discrepancy in the OP which had been commented on, and which therefore I also reported. I did not claim that my estimate was accurate. Only that the discrepancy was sufficiently large that a 0.3 W/m^2 figure was dubious.
In general, to have a mean decadal increase in energy imbalance of 0.3 W/m^2, it must be the case that the growth in forcing times (1-TCR/ECS) = 0.3 Even with ECS and TCR at, respectively the upper and lower end of the likely range from AR5, that requires a decadal growth of forcing of 0.39 W/m^2, significantly more than the figure you derived from the AR5 chart. Alternatively, with a decadal increase in forcing of 0.35 W/m^2, you need a ratio of TCR/ECS = 0.14, ie, that the ECS by 7 times the TCR. Neither of these conditions is plausible. Therefore I can be confident that the increase is not 0.3 W/m^2, without pretending to know how much less than 0.3 W/m^2 it is.
I note with interest your calculation using GISTEMP data, but unless you are committing to the belief that the current low temperatures relative to trend represent an actual reduction in the trend rather than the effects of transient features such as ENSO fluctuations, using the actual temperature value will lead to a poor estimate of the further evolution of the energy imbalance. Using the Foster and Rahmstorf adjusted GISTEMP trend of 0.17 C/decade, we get a temperature increase over three decades of 0.51 C, with short term fluctuations eliminated. That drops your figure to 0.22 W/m^2 per decade, which is certainly reasonable, but not definitive.
2) Rather than Fig 1, which only shows model outputs, I will show Fig 7, which shows emperical (reanalysis) estimates along with the model outputs from Fig 1:
I note two things. First, the energy imbalance according to the model has been declining since 1995. Over that period, with a decadal increase of 0.3 W/m^2, it should have risen to about 1.5 W/m^2, which is noticably outside the montly standard deviation. That strongly suggests that a trend rate of 0.3 W/m^2 is inconsistent with the model over the last two decades.
Second, the reanalysis values are very eratic on both monthly and 1-3 year time scales. That means estimating the decadal trend from that data will be very hard. However, overall it follows the models quite will, which does not support a 0.3 W/m^2 per decade increase.
To summarize, energy imbalance will increase on average with constantly increasing forcing. With current forcing changes, the increase is likely less than 2.5 W/m^2, and possibly much less. Consequently, it is a mistake to say it is 0.3 W/m^2. I remain interested to see if Rob Painting or Kevin Trenberth (in particular) can give us a more accurate estimate.
My apologies, I made the same mistake that Chriskoz corrected for @31. Correcting, and using the Foster and Rahmstorf figures leads to an energy imbalance increase of 0.12 W/m^2 per decade. (Calculated as 0.35 - (0.17/0.75) W/m^2 per decade.)
Chriskoz, thanks for your integrity in reporting corrections regardless of their impact on the argument you are trying to make. That sort of integrity is too rare, and I greatly appreciate it.
This may be elementary physics, but I have seen one argument that the thermal coefficent of water is close to zero for water nearo freezing, and can even be negative for water between 0 and 4ºC. Can someone clarify if heating of the deep ocean volume contributes much to sea level rise? Does it relate to the pressure?
davidsanger #34 I made the same mistake 4 weeks ago because I just assumed salt water and pressure have negligible effect, but they have important effect. I found variation in quoted numbers and not a full set, but roughly I found like:
Volumetric thermal expansion coefficient of sea water (various salinities) at atmospheric pressure
Pure 20 25 30 35 40
H2O ---- grams salt / kg -----
Volumetric coefficient γ at 25 °C (*10**−6/K) 264 270 278 282 288 **
Volumetric coefficient γ at 20 °C (*10**−6/K) 207 241 248 256 263 270
At 4,000m depth pressure at 20 °C 280
Volumetric coefficient γ at 15 °C (*10**−6/K) 192 201 211 221 230
Volumetric coefficient γ at 10 °C (*10**−6/K) 88 136 148 160 171 182
Volumetric coefficient γ at 5 °C (*10**−6/K) 15 73 88 101 115 128
Volumetric coefficient γ at 0 °C (*10**−6/K) -67 40 56 70 84/52 100 **
At 4,000m depth pressure at 0 °C 130
** Very approximate because do not have values above/below. At a depth of 4000 m the bottom water (about 0 °C, salinity 35 g kg−1)
My table format didn't align in this post. Bottom line is that thermal expansion coefficient is +ve, even below 0C.
KR #22 chriskoz #29 I see histogram graphs show net aerosol -ve forcing. I found Dr. Dan Lubin lecture interesting. He says aerosols constrained in Arctic through winter by Polar Night Jet alter clouds to give a forcing of +3.4 w/m**2. If he means from latitude 70N (he doesn't say) at 6% of Earth surface that would be +0.20 w/m**2 of aerosol forcing which I would have thought deserved its own line because of its contrary effect to aerosols elsewhere.
David Sanger @ 34 - though not negligible, only a small amount of warming is occurring below the 2000 metre depth. For the effects of warming on the expansion of seawater for 0-700 & 0-2000 metre depth ranges, see the image below from the National Oceanographic Data Center (NODC).
Tom@33,
You convinced me that the number we've looked at (0.3W/m2/decade) can be overestimated: the data we've considered confirms your conclusion. Indeed, using the Foster and Rahmstorf figures is more appropriate in my method @29 and leads to a lower value, thanks for pointing that.
Re my integrity: thanks. All I care about is the correctness of science. That's an obvious bottom line all users of this blog should follow.
grindupBaker@36,
Which lecture by Dan Lubin are you referring to? Is it related to the latest dark snow project by Jason Box? Is Dan's research indeed new, not considered by AR5?
In any case, I disagree it would have 'deserved its own line'. Perhaps it is already factored in 'cloud adjustment' component, because I see that component changed from -0.7 in AR4 to -0.55 in AR5...
However this can be OT here so I if you want further discussion maybe it should be moved to another thread.
grindupBaker@35 Rob Painting@37 Thanks. So it sounds like even though at sea level freshwater at 4º or less does not expand when heated, that with the salinity and higher pressure, the deep ocean below 700m is actually expanding as it heats and thus adding a little to searise.
David Sanger,
Some of the behaviour of the ocean is not intuitive because the immense size of the ocean dwarfs peoples normal sense of how things behave. If a two liter soda bottle expands 1/10,000 of its volume from a change in temperature, you would be hard pressed to measure it. If the deep ocean (over 4,000 meters) expands a similar amount, that is 40+ cm of sea level rise. Even very small changes in ocean volume add up to a lot of sea level rise. When the ocean shifts, even a little, people next to the ocean must be wary.
@DavidSanger and others.... part of the discussion/questions about thermal expansion at low temperatures in the deep ocean is missing the key point that saltwater behaves very differently from freshwater. Freshwater has a maximum density at c. 4 C. Seawater does not: its density increases right down to the freezing point which is typically c. -1.8 C.
So even though the thermal expansion coefficient for saltwater does decrease slightly as seawater approaches its freezing point, there is absolutely no doubt that adding heat to ocean deepwater will result in thermal expansion.
I've just joined this blog and I really like the fact that people debate and ask reasonable, critical questions but without calling each other names. The contrast with Judith Curry's blog is very evident.
[JH] Welcome aboard and thank you for the kind words about the civility of our dsicussion threads. We take great pride in that. We also work very hard to ensure that all commenters strictly adhere to the SkS Comments Policy.
@SimplyConcerned. thanks that's really very clear now. And I also agree with you and JH about the overall civility of this site, at least in my experience and from what I've read so far.
It would be interesting to overlay the first chart with average global air temperatures (putting the scale on the right hand side). I think this would help explain the flat-spot from 1993 to 2001, as well as showing the relationship of where growing heat is being manifested at present.
the Nuccitteli (2012) graph of total heat content through 1800M depth yeilded a heat accumulation of 9.5E22joules between 1998 and 2008.
3.5E22 joules between 1988 and 1998
and 1.5E22 joules between 1978 and 1998
By taking the difference in heat accumulated per decade and dividing by the seconds per decade and square meters of the earth, this total heat accumulation rate value can be converted to a W/m^2/decade.
Plotting this accumulation of heat produces an exponential curve with an R^2 value of .9978
The equation for this exponential rate of total accumulation is 0.0361*exp(0.9229*x)
the values of this funciton shows the expected increase in TOA watts/meter squared based on the previous 3 decades of data going forward the decadel rate of TOA based on accumulation rates are (will be):
0.090848 1978-1988
0.137779 1988-1998
0.346731 1998-2008
(0.872576 2008-2018)
(2.195904 2018-2028)
(5.526165 2028-2038)
(13.90702 2038-2048)
However, a second order polynomial function fits the data with an R^2 value of 1.0
the equation for this function is y=.1243*x^2 - .2485*x +.2175
the values of this funciton shows the expected increase in TOA watts/meter squared based on the previous 3 decades of data going forward the decadel rate of TOA based on accumulation rates are (will be):
0.0933 1978-1988
0.1244 1988-1998
0.373 1998-2008
(0.6216 2008-2018)
(0.8702 2018-2028)
(1.1188 2028-2038)
(1.3674 2038-2048)
all values in watts/meter^2 TOA instantaneous value at the end of each decade
correction, taking the first order derivative of the polynomial function directly above yeilds the instantaneous accumulation rate at the end of each decade. The derivative function is y=.2486*x - .2485
this yeilds the actual instantaneous value (the values directly above were decadel averages)
1E-04 1978-1988
0.2487 1988-1998
0.4973 1998-2008
(0.7459 2008-2018)
(0.9945 2018-2028)
(1.2431 2028-2038)
(1.4917 2038-2048)
incidentally, using this derivative function, the actual TOA at the end of 2013 was
0.57188 Watts/Meter Squared
jja, from table 1 of Nucutelli et al, we have the following average TOA energy imbalance for various periods:
Interval------ Flux
1970-2008--- 0.31
1980-2008--- 0.37
1990-2008--- 0.46
2000-2008--- 0.53
From that you can calculate the total energy input over the intervals 1970-1979, 1980-1989, 1990-1999, and 2000-2008, and from them the average flux in W/m^2 over those intervals, which are in order:
1.36 W/m^2
1.99 W/m^2
3.97 W/m^2
4.77 W/m^2
The last three of these approximately correspond to the three intervals you examine @45, but vary significantly from them. In particular, your 1978-1988 average is less than half of the 1980-1989 average, despite the very substantial overlap. Looking at the graph shows the disparity arises primarilly from your choice of start year, which is obviously well above trend. There is not suggestion this was a deliberate cherry pick. Rather it results from simply taking each successive decade back from the final year. Never-the-less, it does mean your result is primarilly the product of a short term fluctuation.
Using the figures from the table, the change in average "decadal" TOA flux (with, of course, only 9 years for the final "decade") are:
0.63 W/m^2
1.98 W/m^2
0.8 W/m^2
These values certainly do not support your quadratic curve. Indeed, I doubt they can be sensibly extrapolated. Given all values in the data, a sensible fit might be obtained, but it would clearly not support increases in the TOA energy imbalance of 0.3 W/m^2 per decade.
It should be noted that the 1970-2008 rate is 0.31 W/m^2. It is possible that the authors intended to quote this rate, and mistated a rate as an acceleration.
Tom,
why did you not include the 2002-2008 value of .73?
The calculation of flux that you use is full of assumptions and neglects significant potential errors, plus it is unnecessary. The total heat accumulation, averaged over the decade yeilds the average TOA flux for that period. correct?
The change in average decadel flu that you list is total AF forcing, right?
Again, I don't see why that is important. The total net heat content increase in Nuttecelli produces the average TOA value for the time period.
I checked the climateskeptic letter to PLA and found their algorithm to TOA as
TOA = 0.62[d(OHC)/dt] I used this to check my math and found the following average forcing values to match my calculations.
decade average TOA
1978-1988 9.32E-02
1988-1998 2.17E-01
1998-2008 5.90E-01
The correct function that graphs these values is the binomial that I quoted in 46. (y=.1243*x^2 - .2485*x +.2175)
The first order derivative of the function shows the instantaneous decadel rate of change of TOA. (y=.2486*x - .2485) -- The rate of change of TOA at the end of each decade.
The binomial function produces the following average TOA values for each year as noted:
TOA 1983 0.0933, delta = .0933
TOA 1993 0.2177, delta = .1244
TOA 2003 0.5907, delta = .373
TOA 2013 1.2123, delta = .6216
TOA 2023 2.0825, delta = .8702
TOA 2033 3.2013, delta = 1.1188
TOA 2043 4.5687, delta = 1.3674
The (average decadel) rate of change of TOA for each year is
dTOA/dt 1983 = 0.1244
dTOA/dt 1993 = 0.373
dTOA/dt 2003 = 0.6216
dTOA/dt 2013 = 0.8702
dTOA/dt 2023 = 1.1188
dTOA/dt 2033 = 1.3674
dTOA/dt 2043 = 1.6160
which happens to equal the delta values shown above.
[PW] Unnecessary white space removed.
jja @49:
1) I did not consider the 2002-2008 period because it was significantly less than a decade. If even decadal values are eratic, as is apparent, than a seven year interval is also going to be eratic, and not necessarilly projectable for future trends.
2) I did not question your calculation of the correct values for the episodes you chose. I questioned your projection from three decadal averages when decadal averages obviously vary substantially depending on start date. Decades are obviously too short a period to be projectable on this data.
3) If you want to project the data, you need to calculate the change in heat year by year over the whole interval, and find which curve is the best fit to that data. (Make sure you use a test that accounts for the loss of simplicity by introducing greater curvature to the fit.) Reducing the data to three decades when the choise of a different three decades on which to make the fit would radically alter the result is not good science, and not informative.