


 Arguments
Software
Resources
Comments
The Consensus Project
Translations
About
Support
Arguments
Software
Resources
Comments
The Consensus Project
Translations
About
Support
![]()
![]()
![]()
![]()
![]()
![]()
![]()
![]()
![]()
![]()


![]()


Latest Posts
- New Publication: Identifying Flawed Reasoning in Contrarian Claims about Climate Change
- The Merchants of Doubt are coming for Extreme Event Attribution science
- 2026 SkS Weekly Climate Change & Global Warming News Roundup #25
- Cooking up the Climate Stripes, with Ed Hawkins
- Skeptical Science New Research for Week #25 2026
- How ‘balcony solar’ could help fight rising utility costs
- Fact brief - Does solar energy need subsidies to compete with fossil fuels?
- Plateauing CO2 emissions have slowed atmospheric growth
- 2026 SkS Weekly Climate Change & Global Warming News Roundup #24
- Skeptical Science New Research for Week #24 2026
- June update: Help still needed to get translations prepared for our website relaunch!
- How many people does heat actually kill?
- Check out the brand-new hurricane ‘cone of uncertainty’ graphics arriving this season
- 2026 SkS Weekly Climate Change & Global Warming News Roundup #23
- SkS Housekeeping: Updating the Comments Policy
- Skeptical Science New Research for Week #23 2026
- Nobody knows the future of energy
- Fact brief - Do electric vehicles almost always have a lower carbon footprint than gasoline-powered cars?
- Solar, wind, and EVs have knocked out a doomsday climate scenario
- 2026 SkS Weekly Climate Change & Global Warming News Roundup #22
- Skeptical Science New Research for Week #22 2026
- The next era of Atlantic hurricanes could be far more destructive
- On the death of RCP8.5
- RCP8.5 Update
- 2026 SkS Weekly Climate Change & Global Warming News Roundup #21
- Skeptical Science New Research for Week #21 2026
- What’s a ‘super El Niño’? And other El Niño questions, answered
- Fact brief - Does electromagnetic radiation from wind turbines pose a threat to human health?
- Five things you need to know about El Niño’s likely comeback
- 2026 SkS Weekly Climate Change & Global Warming News Roundup #20
Archived Rebuttal
This is the archived Basic rebuttal to the climate myth "Temp record is unreliable". Click here to view the latest rebuttal.
What the science says...
|
The warming trend is the same in rural and urban areas, measured by thermometers and satellites, and by natural thermometers. |
Temperature data is essential for predicting the weather. So, the U.S. National Weather Service, and every other weather service around the world, wants temperatures to be measured as accurately as possible.
To understand climate change we also need to be sure we can trust historical measurements. A group called the International Surface Temperature Initiative is dedicated to making global land temperature data available in a transparent manner.
Surface temperature measurements are collected from about 30,000 stations around the world (Rennie et al. 2014). About 7000 of these have long, consistent monthly records (Fig. 1). As technology gets better, stations are updated with newer equipment. When equipment is updated or stations are moved, the new data is compared to the old record to be sure measurements are consistent over time.
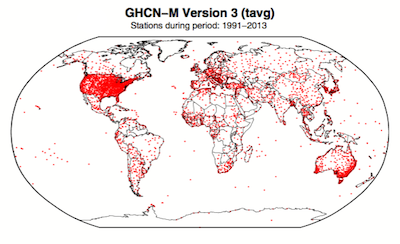
Figure 1. Station locations with at least 1 month of data in the monthly Global Historical Climatology Network (GHCN-M). This set of 7280 stations are used in the global land surface databank. (Rennie et al. 2014)
In 2009 some people worried that weather stations placed in poor locations could make the temperature record unreliable. Scientists at the National Climatic Data Center took those critics seriously and did a careful study of the possible problem. Their article "On the reliability of the U.S. surface temperature record" (Menne et al. 2010) had a surprising conclusion. The temperatures from stations that critics claimed were "poorly sited" actually showed slightly cooler maximum daily temperatures compared to the average.
In 2010 Dr. Richard Muller criticized the "hockey stick" graph and decided to do his own temperature analysis. He organized a group called Berkeley Earth to do an independent study of the temperature record. They specifically wanted to answer the question is "the temperature rise on land improperly affected by the four key biases (station quality, homogenization, urban heat island, and station selection)?" Their conclusion was NO. None of those factors bias the temperature record. The Berkeley conclusions about the urban heat effect were nicely explained by Andy Skuce in an SkS post in 2011. Figure 2 shows that the U.S. network does not show differences between rural and urban sites.
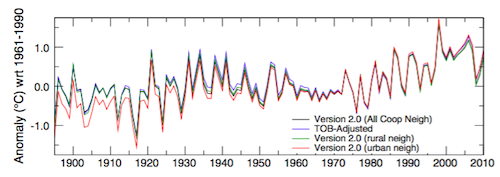
Figure 2. Comparison of spatially gridded minimum temperatures for U.S. Historical Climatology Network (USHCN) data adjusted for time-of-day (TOB) only, and selected for rural or urban neighborhoods after homogenization to remove biases. (Hausfather et al. 2013)
Temperatures measured on land are only one part of understanding the climate. We track many indicators of climate change to get the big picture. All indicators point to the same conclusion: the global temperature is increasing.
------
See also
Understanding adjustments to temperature data, Zeke Hausfather
Explainer: How data adjustments affect global temperature records, Zeke Hausfather
Time-of-observation Bias, John Hartz
Check original data
All the Berkeley Earth data and analyses are available online at http://berkeleyearth.org/data/.
Plot your own temperature trends with Kevin's calculator.
NASA GISS Surface Temperature Analysis (GISSTEMP) describes how NASA handles the urban heat effect and links to current data.
NOAA Global Historical Climate Network (GHCN) Daily. GHCN-Daily contains records from over 100,000 stations in 180 countries and territories.
Updated on 2017-08-06 by dana1981.


THE ESCALATOR

(free to republish)